
Pi Network (PI) is trading at $0.1883, consolidating near the 23.6% Fibonacci retracement level after a failed attempt to hold gains above $0.29. Two converging signals now suggest the quiet period is over — and not in the bulls’ favor.
Realized volatility has re-ignited after a seven-month compression phase, and PI’s relationship with Bitcoin has flipped negative. Together, they frame a bearish near-term setup with specific levels to watch.
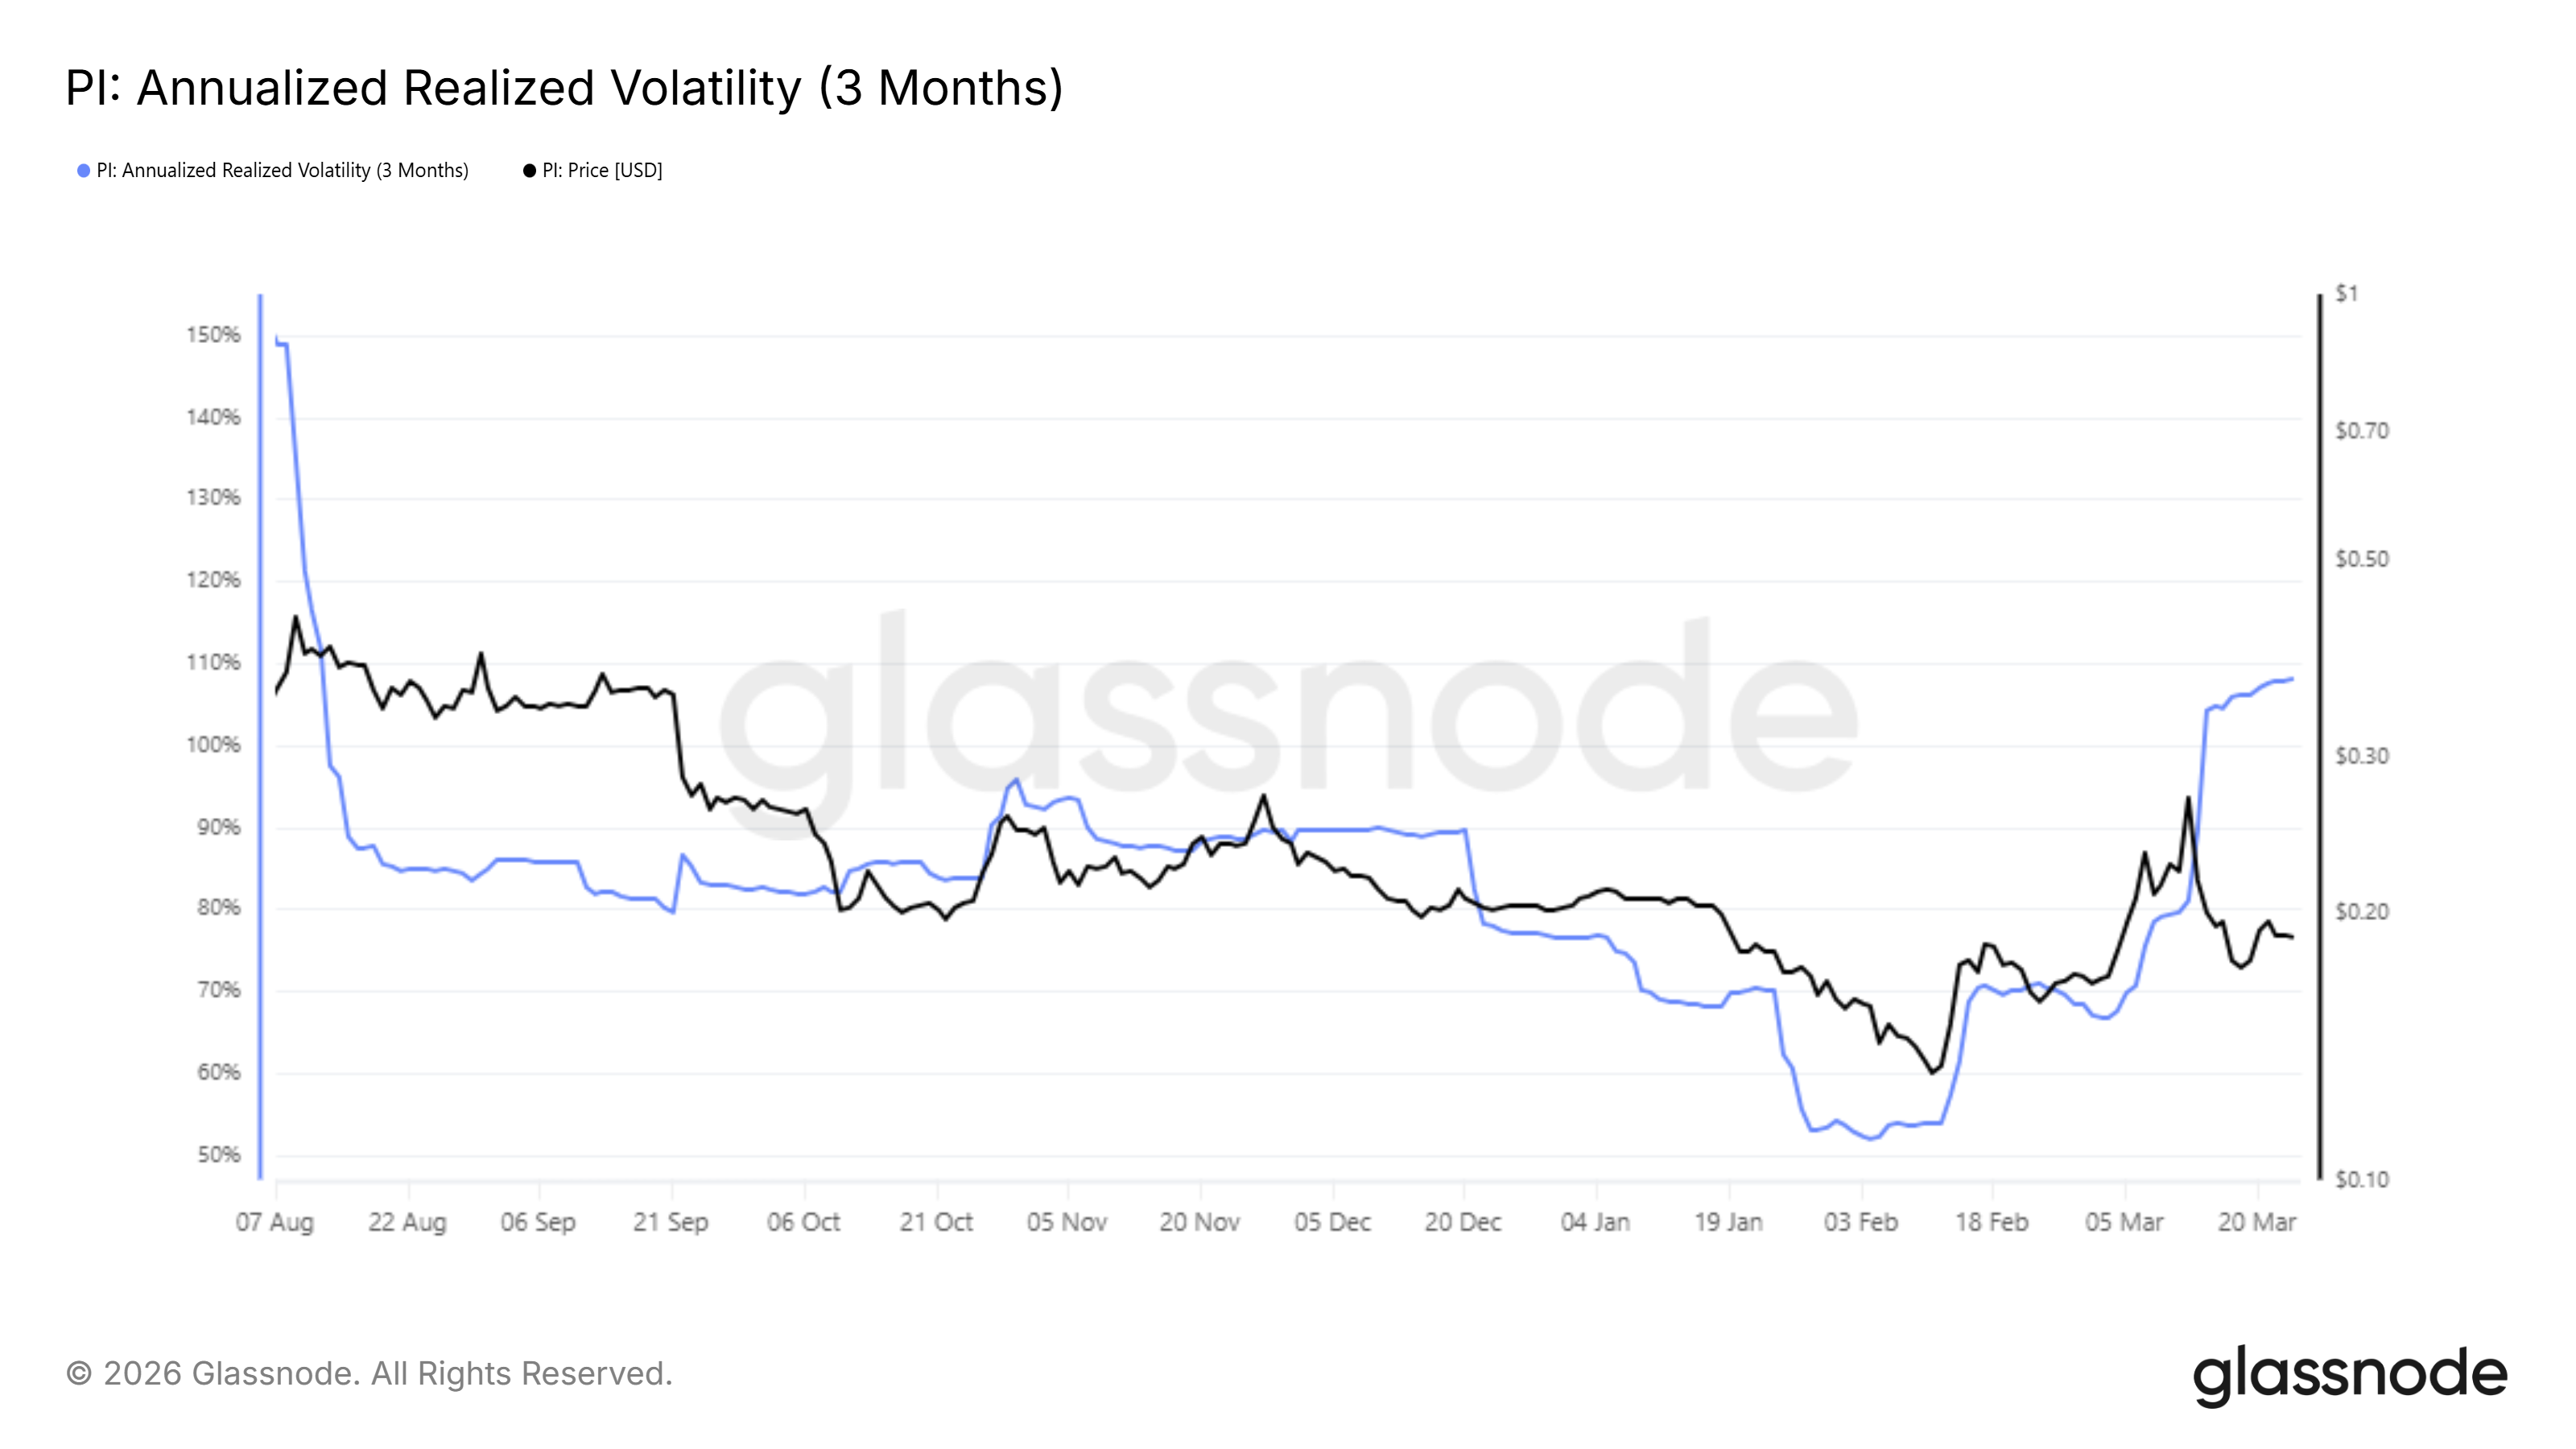
Pi Coin’s 7-Month Silence
The annualized realized volatility chart shows that back in August 2025, volatility opened above 150%. It then compressed steadily alongside Pi Coin price, bottoming near 52% in early February — a seven-month squeeze that signaled exhaustion rather than stability.
In March, both lines reversed sharply. Price spiked to $0.29 while volatility surged back above 100%, reaching approximately 108% at the right edge of the chart. That kind of expansion after a prolonged squeeze historically precedes large directional moves.
Want more token insights like this? Sign up for Editor Harsh Notariya’s Daily Crypto Newsletter here.
Negative Bitcoin Correlation Makes a BTC Rally PI’s Problem
The correlation coefficient chart for PI against Bitcoin shows that through most of February, the reading sat near 1.0. It has since fallen to -0.30, meaning PI and Bitcoin are now moving in opposite directions more often than not.
The practical consequence is straightforward. If Bitcoin rallies and lifts the broader market, PI is currently positioned to move against that tide rather than with it. That removes the most reliable recovery catalyst available to most altcoins.
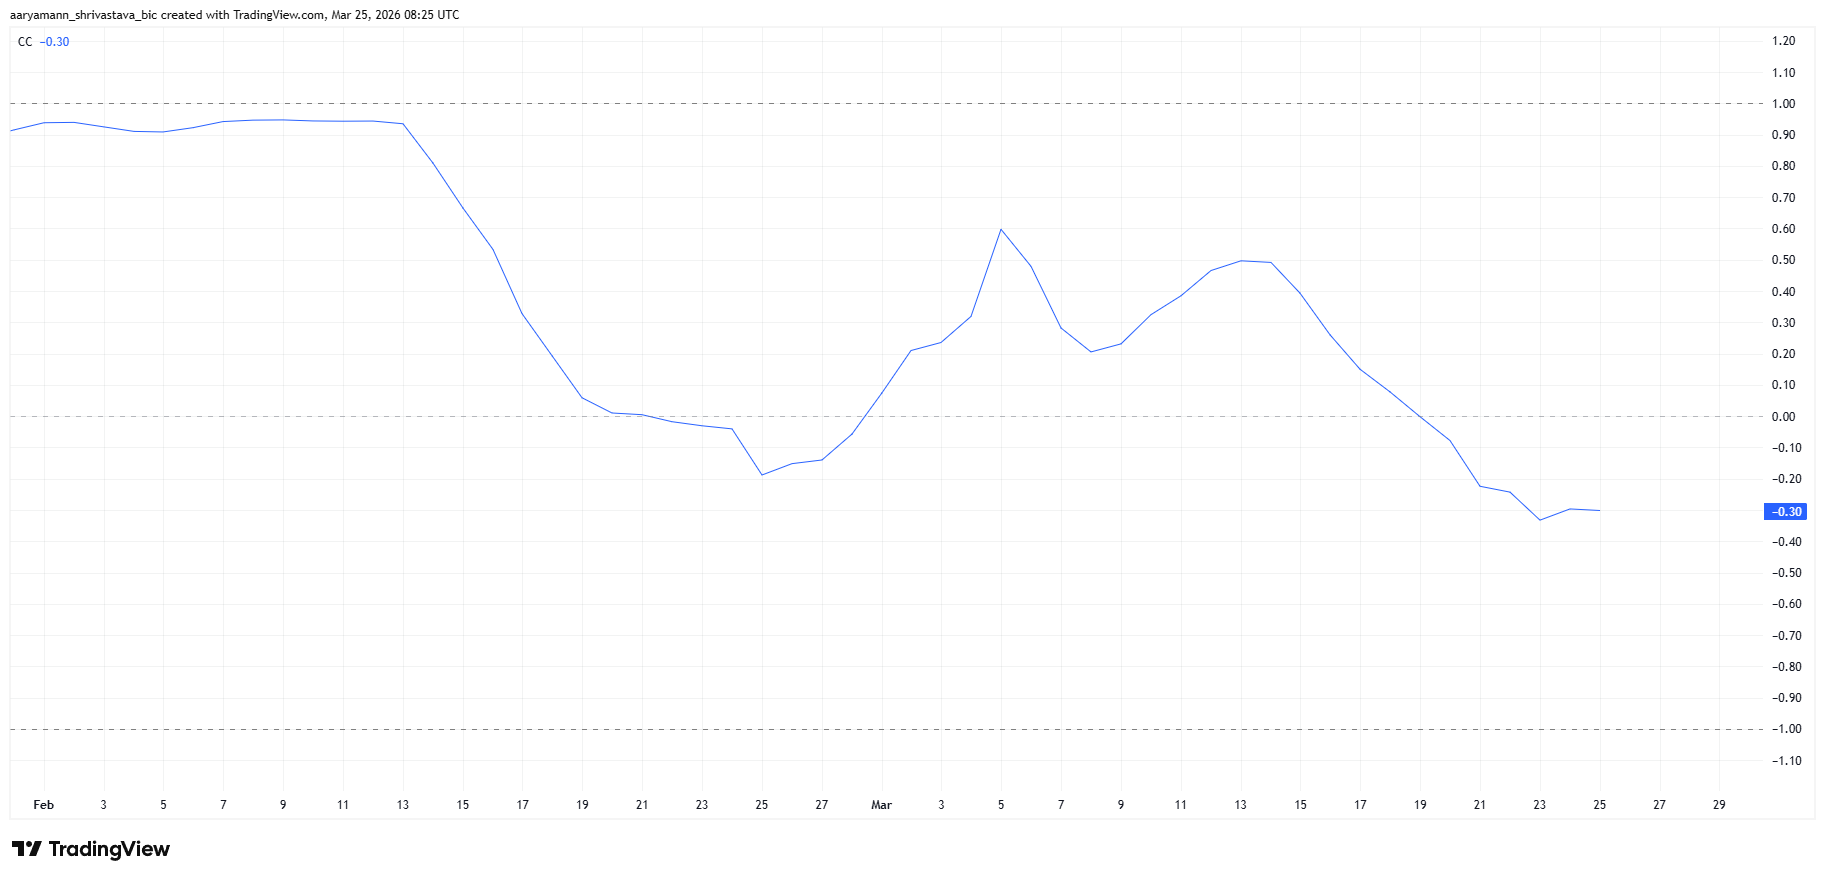
A return above 0.50 correlation would be needed before Bitcoin’s strength could meaningfully support PI’s price.
PI Price Breakdown Still Likely
The daily chart shows Pi Coin price at $0.1883, just below the 23.6% Fibonacci level at $0.1894. The grid runs from the February low at $0.1555 to the March 13 peak at $0.2990. The 20-day EMA sits at $0.1930, sloping downward and acting as immediate resistance.
The chart also shows a double top pattern projecting a potential 33% drop towards the ATL of $0.1300. Pi Coin may see some decline even if it does not form a new all-time low.
The neckline sits near $0.1555, and the measured move from the double top projects a target in the $0.1527 range — consistent with the Fibonacci support at that level. With price now stalling both the 23.6% Fibonacci level and the descending EMA below, the conditions for that measured move to play out remain intact.
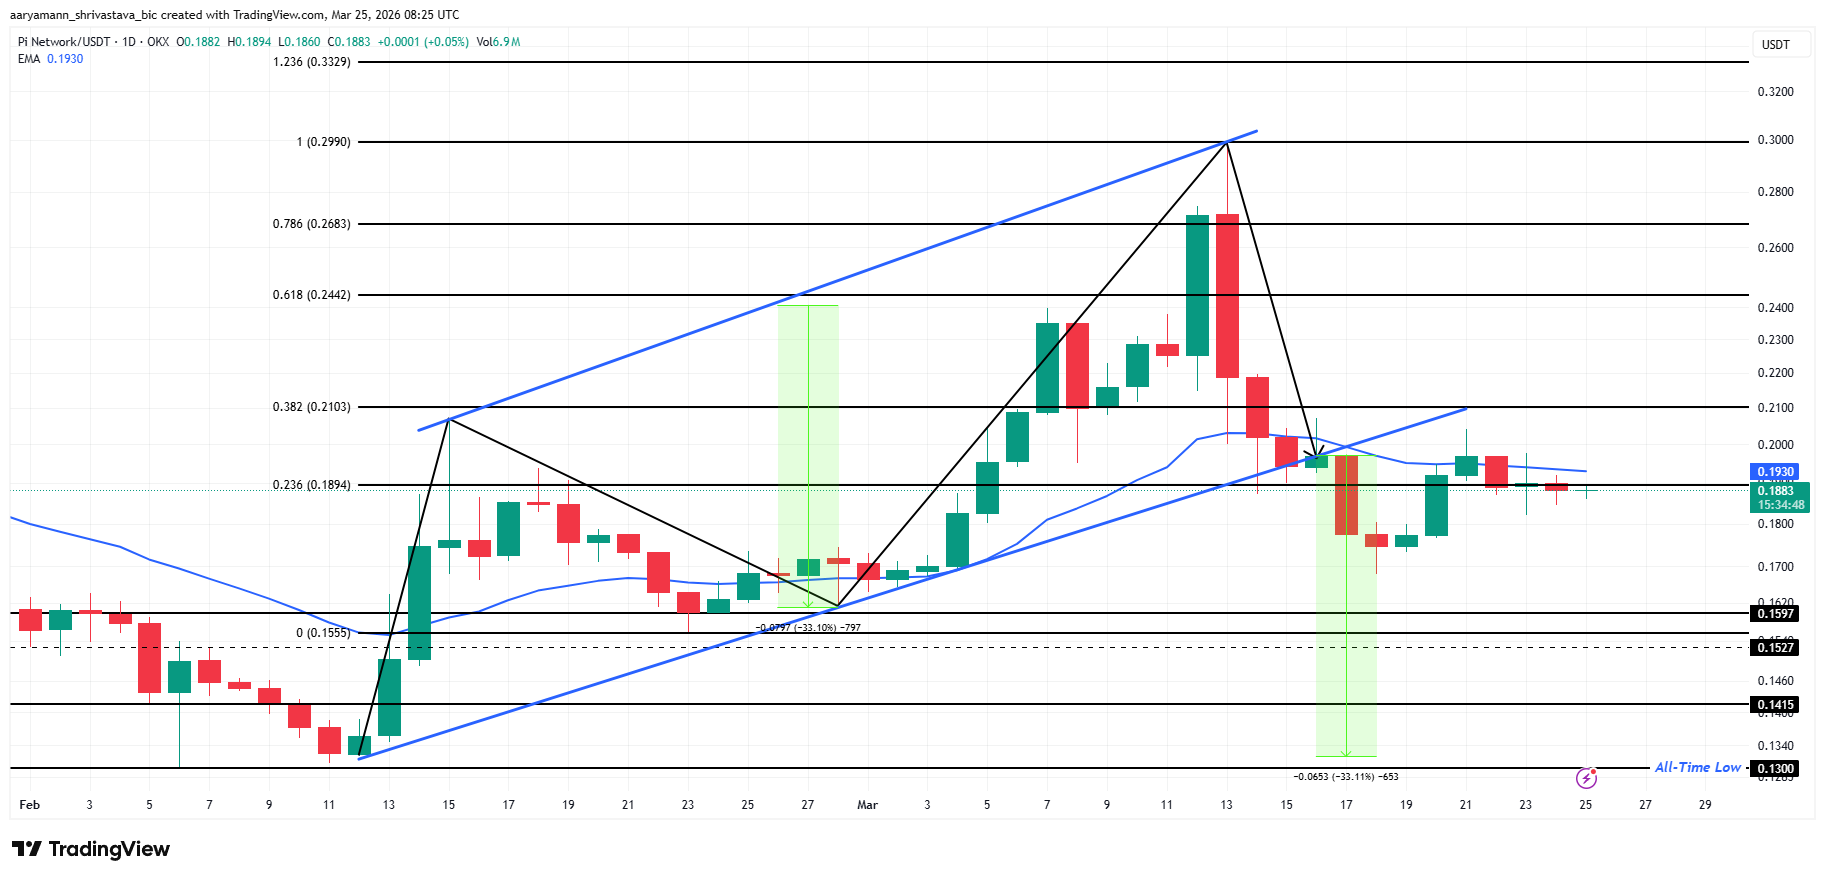
A daily close below $0.1894 would confirm Pi Coin price’s recovery has failed and open the door toward $0.1597, then $0.1527. The all-time low at $0.1300 sits as the last floor below that.
The invalidating scenario is a close above the 38.2% Fibonacci level at $0.2103. Above there, $0.2442 becomes the next test. A breakout through $0.2103, paired with PI’s Bitcoin correlation turning positive, would shift the structure from bearish to neutral.
The post Pi Coin Ends 7-Month “Silence”; Price is Ready For Big Swings appeared first on BeInCrypto.