
Solana (SOL) price rose over 5% since March 24, reclaiming the $92 zone as a potential golden cross takes shape on the 4-hour chart.
However, on-chain data reveals that a key holder cohort has been quietly exiting over the past month. That divergence between a bullish technical signal and bearish holder behavior raises a question that the SOL price chart will ultimately have to answer.
EMA Golden Cross Builds as Long-Term Holders Hold Firm
The 4-hour Solana chart shows a promising shift in momentum. The 20-period Exponential Moving Average (EMA), a trend indicator that gives greater weight to recent price movements, has already crossed above the 200-period EMA. That crossover helped fuel the 5% rally from March 24.
Want more token insights like this? Sign up for Editor Harsh Notariya’s Daily Crypto Newsletter here.
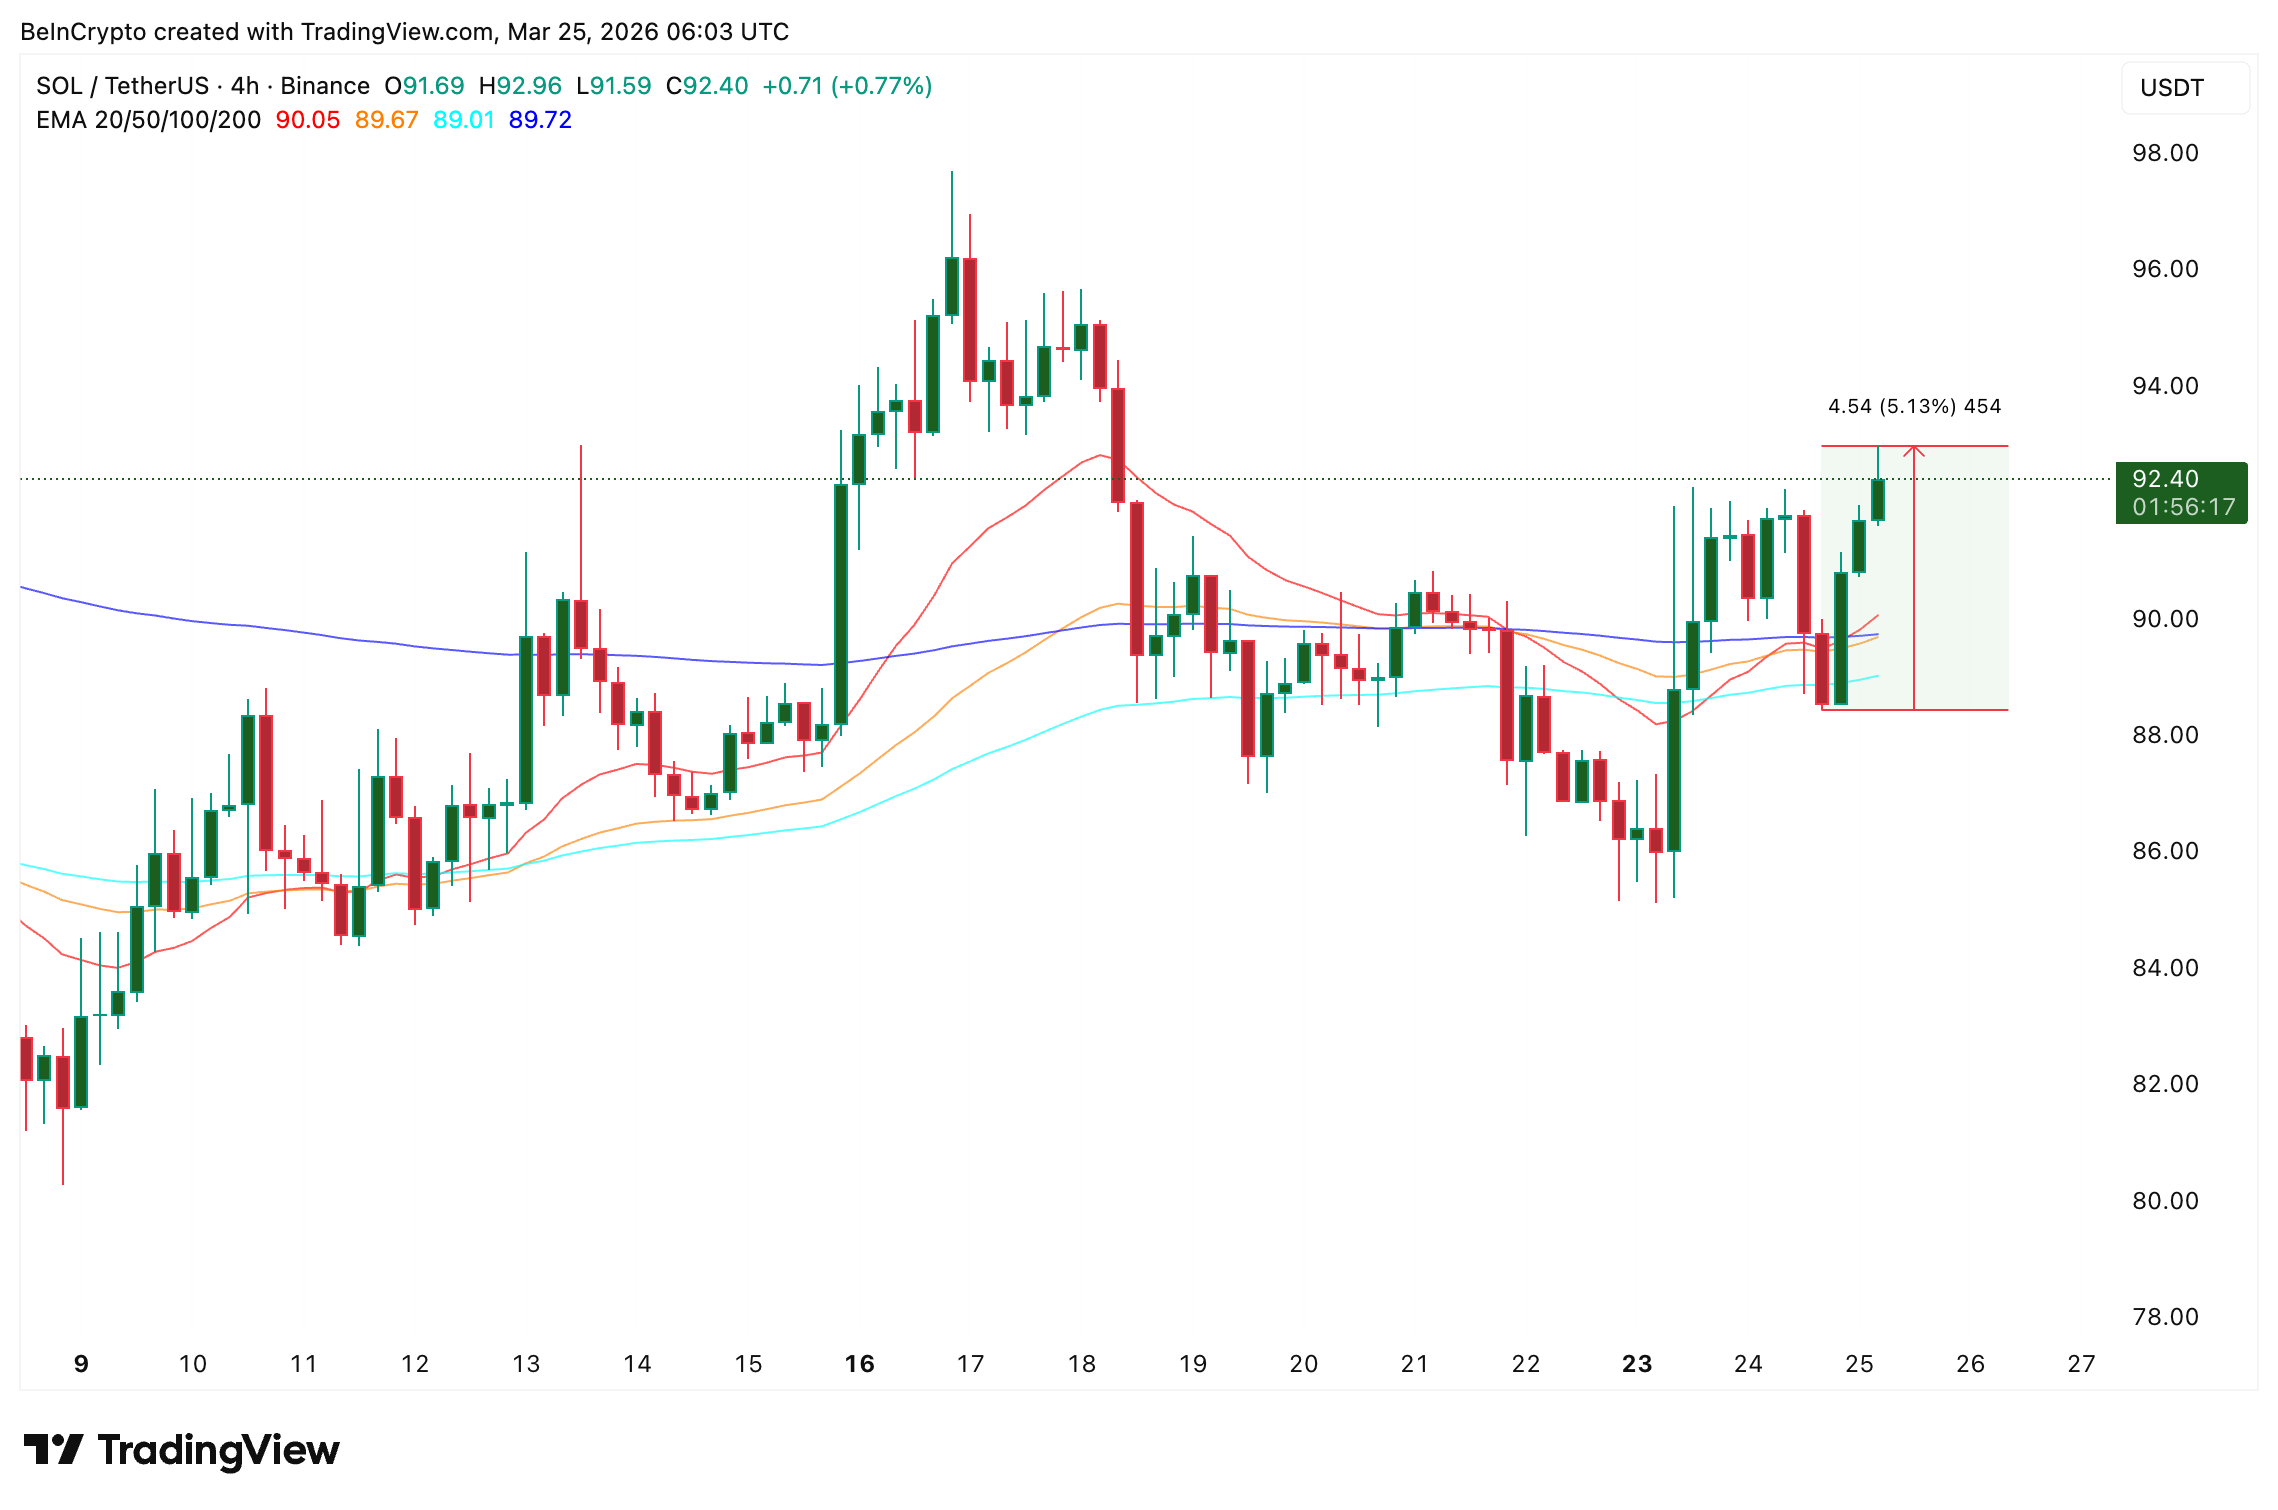
More importantly, the 50-period EMA is now closing in on the 200-period EMA. If it crosses above, a golden cross would form, a signal that historically precedes extended upside moves.
This technical optimism finds support in long-term holder behavior. The hodler net position change, a Glassnode metric tracking accumulation by longer-term wallets, rose from roughly 1,160,485 SOL on March 18 to 1,673,105 SOL by March 24. That 44% increase over six days suggests conviction holders are adding to positions, not distributing.
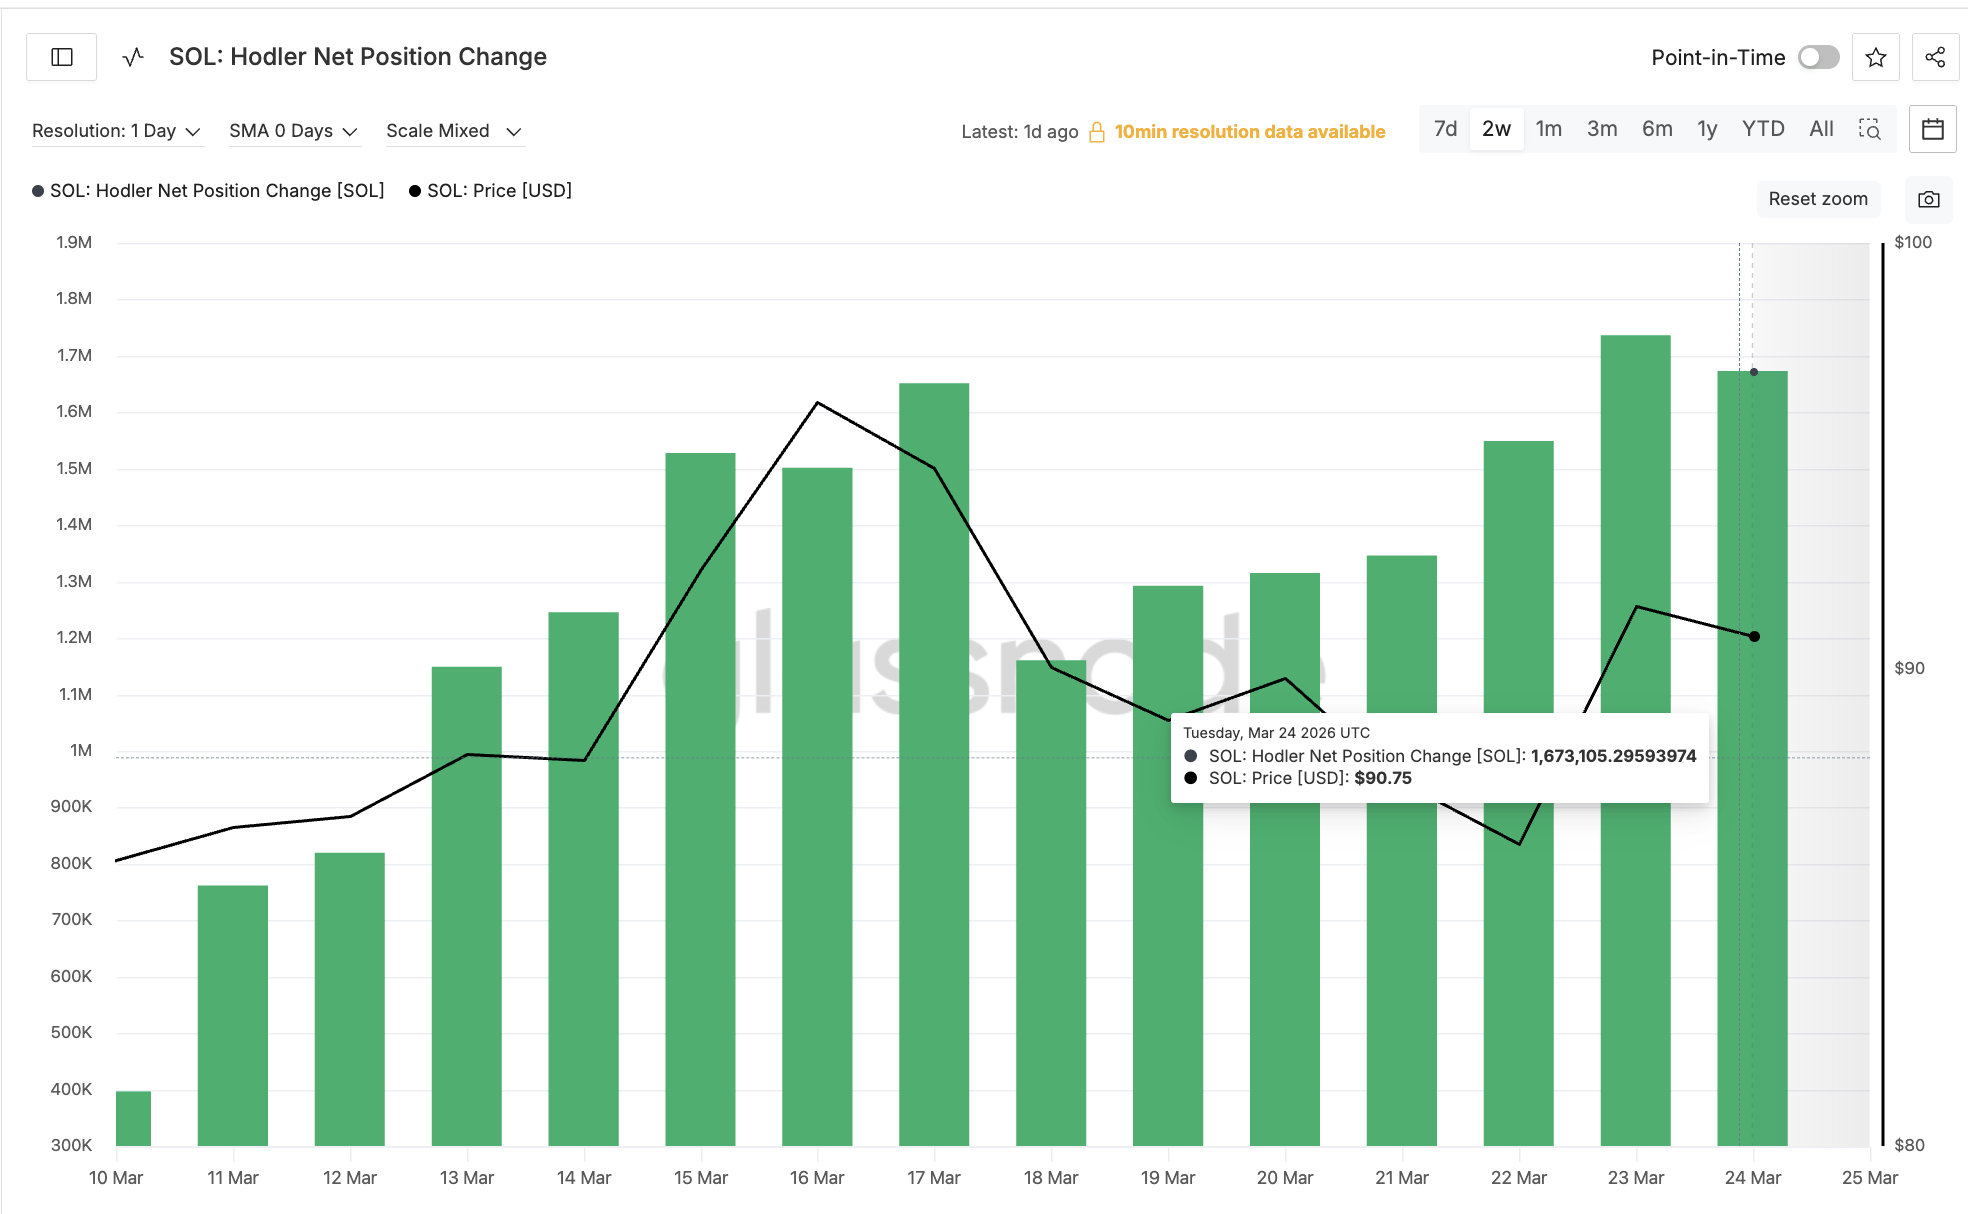
The accumulation aligns with a broader recovery in network fundamentals. Weekly DEX volume on Solana surged 103% to $138.4 billion in the week ending March 16, the highest level in a year. Long-term holders appear to be pricing in a rebound in activity, even as Solana’s price remains well below its January highs.
However, not every cohort shares this conviction, and what the shorter-term holders are doing paints a very different picture.
Head and Shoulders Looms as Short-Term Holders Dump 16%
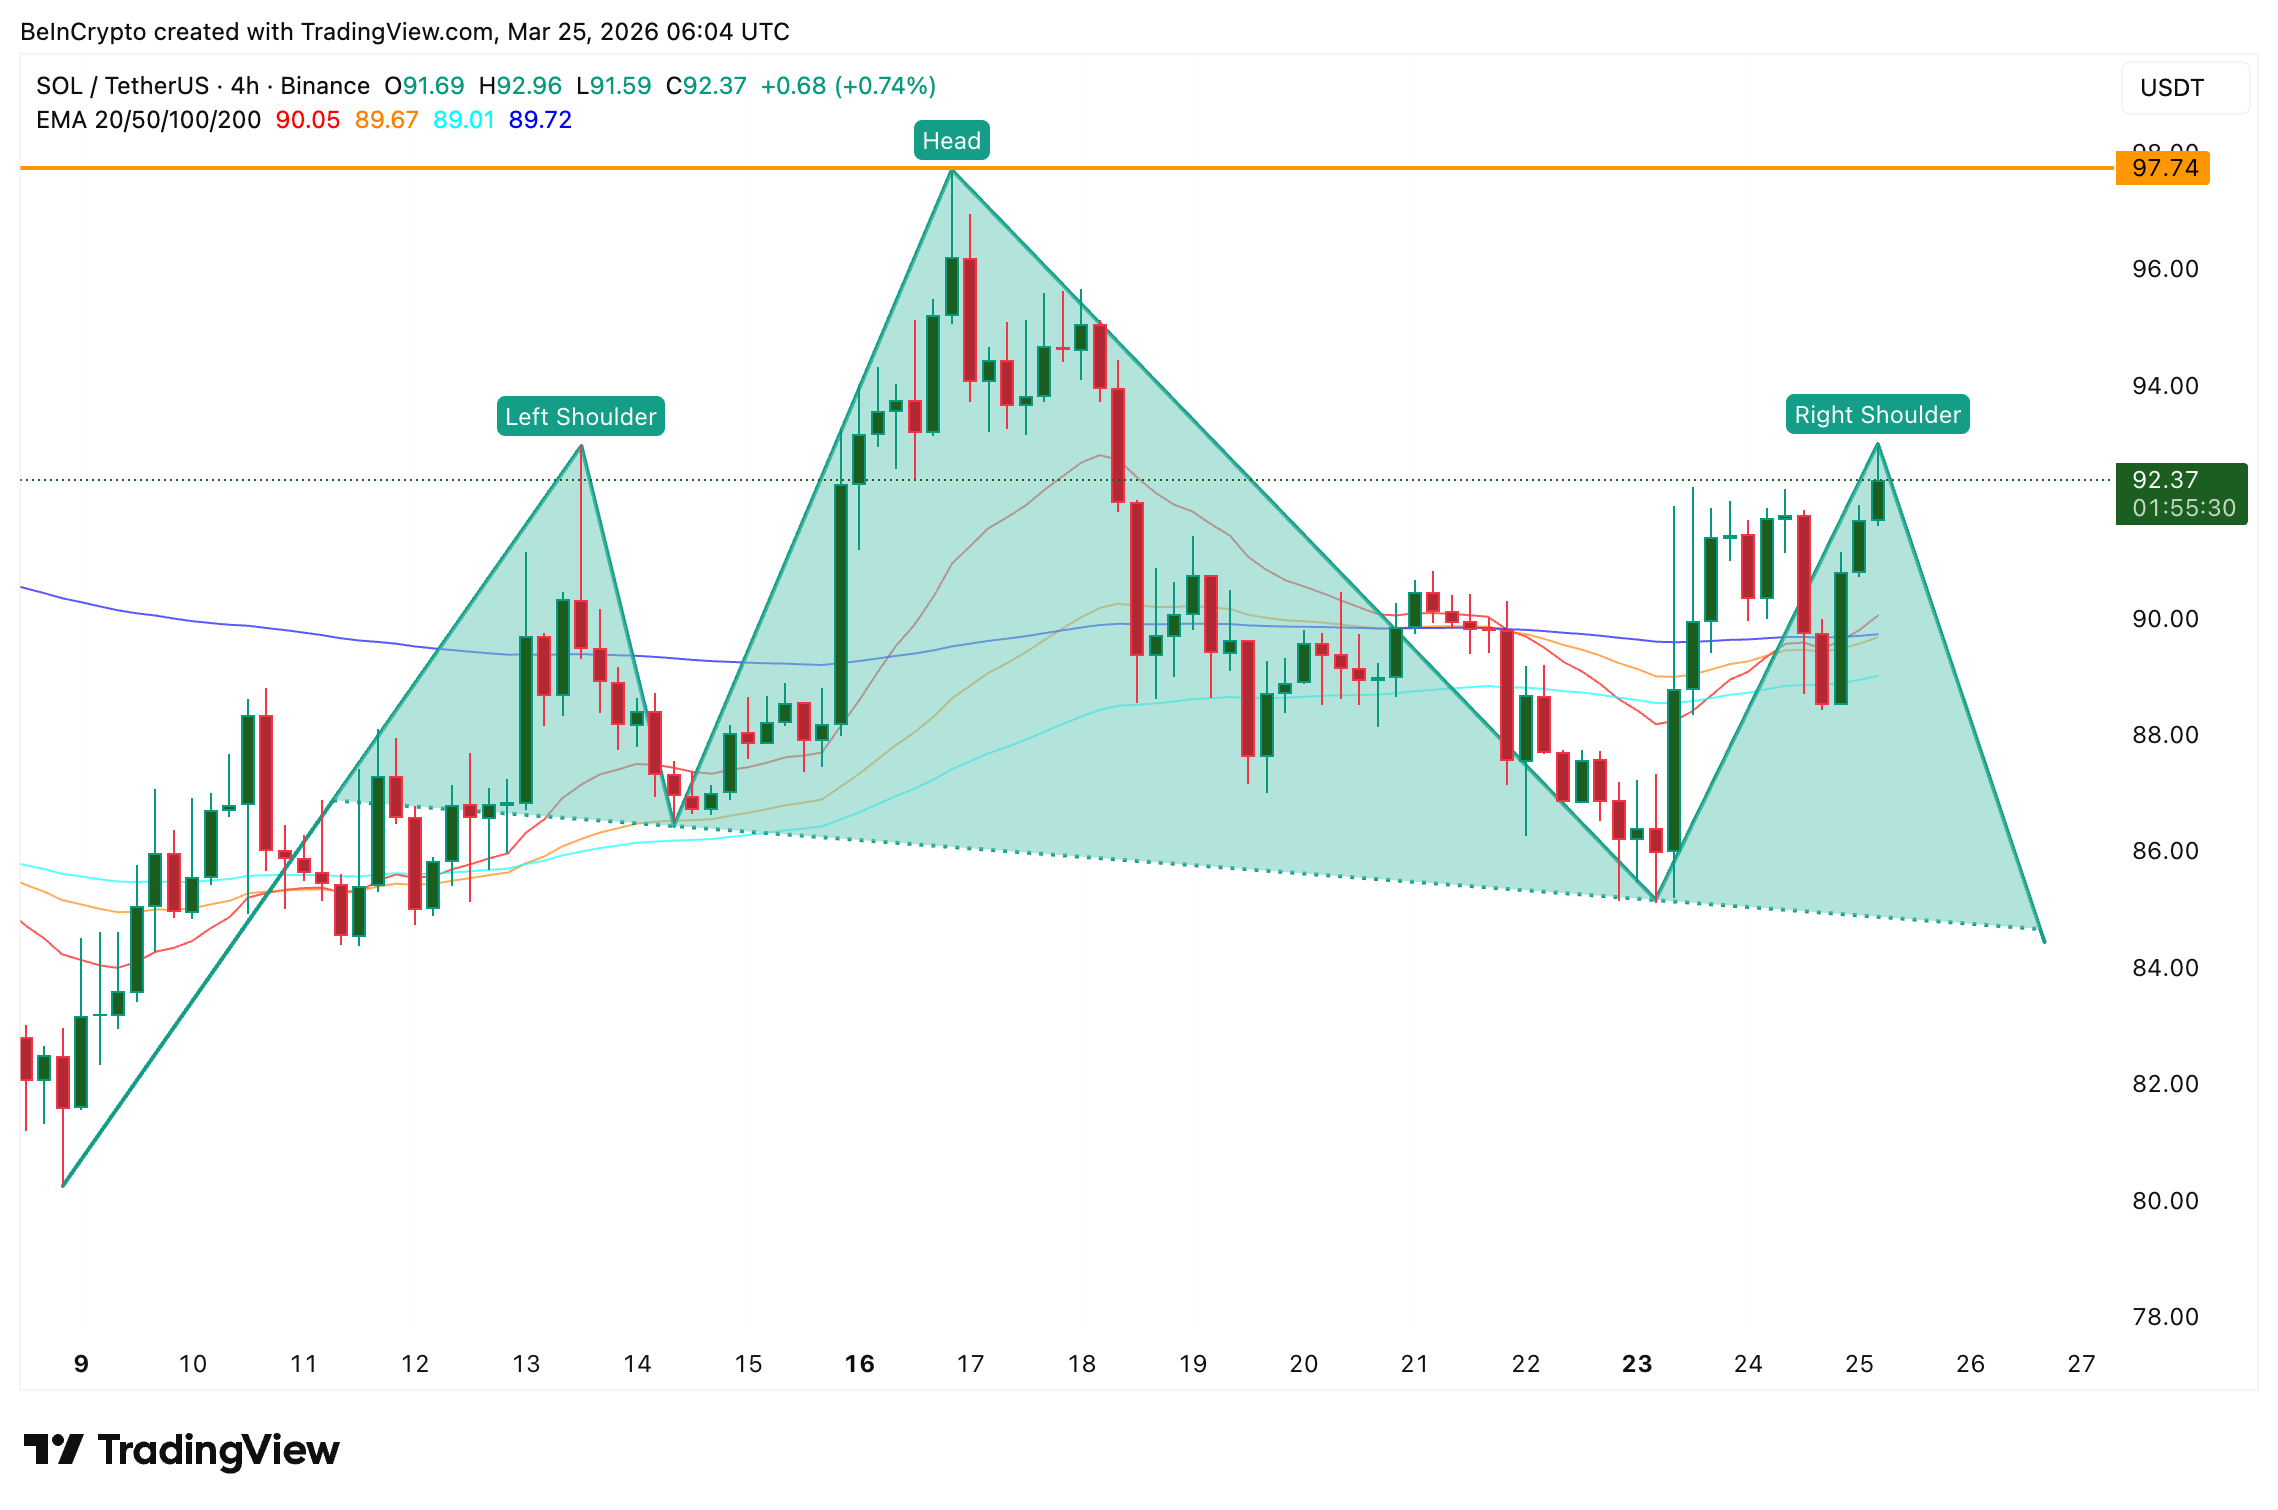
Despite the bullish EMA setup, the broader 4-hour structure since early March tells a bearish story. A head-and-shoulders pattern has taken shape, and the right shoulder is currently developing near $92.
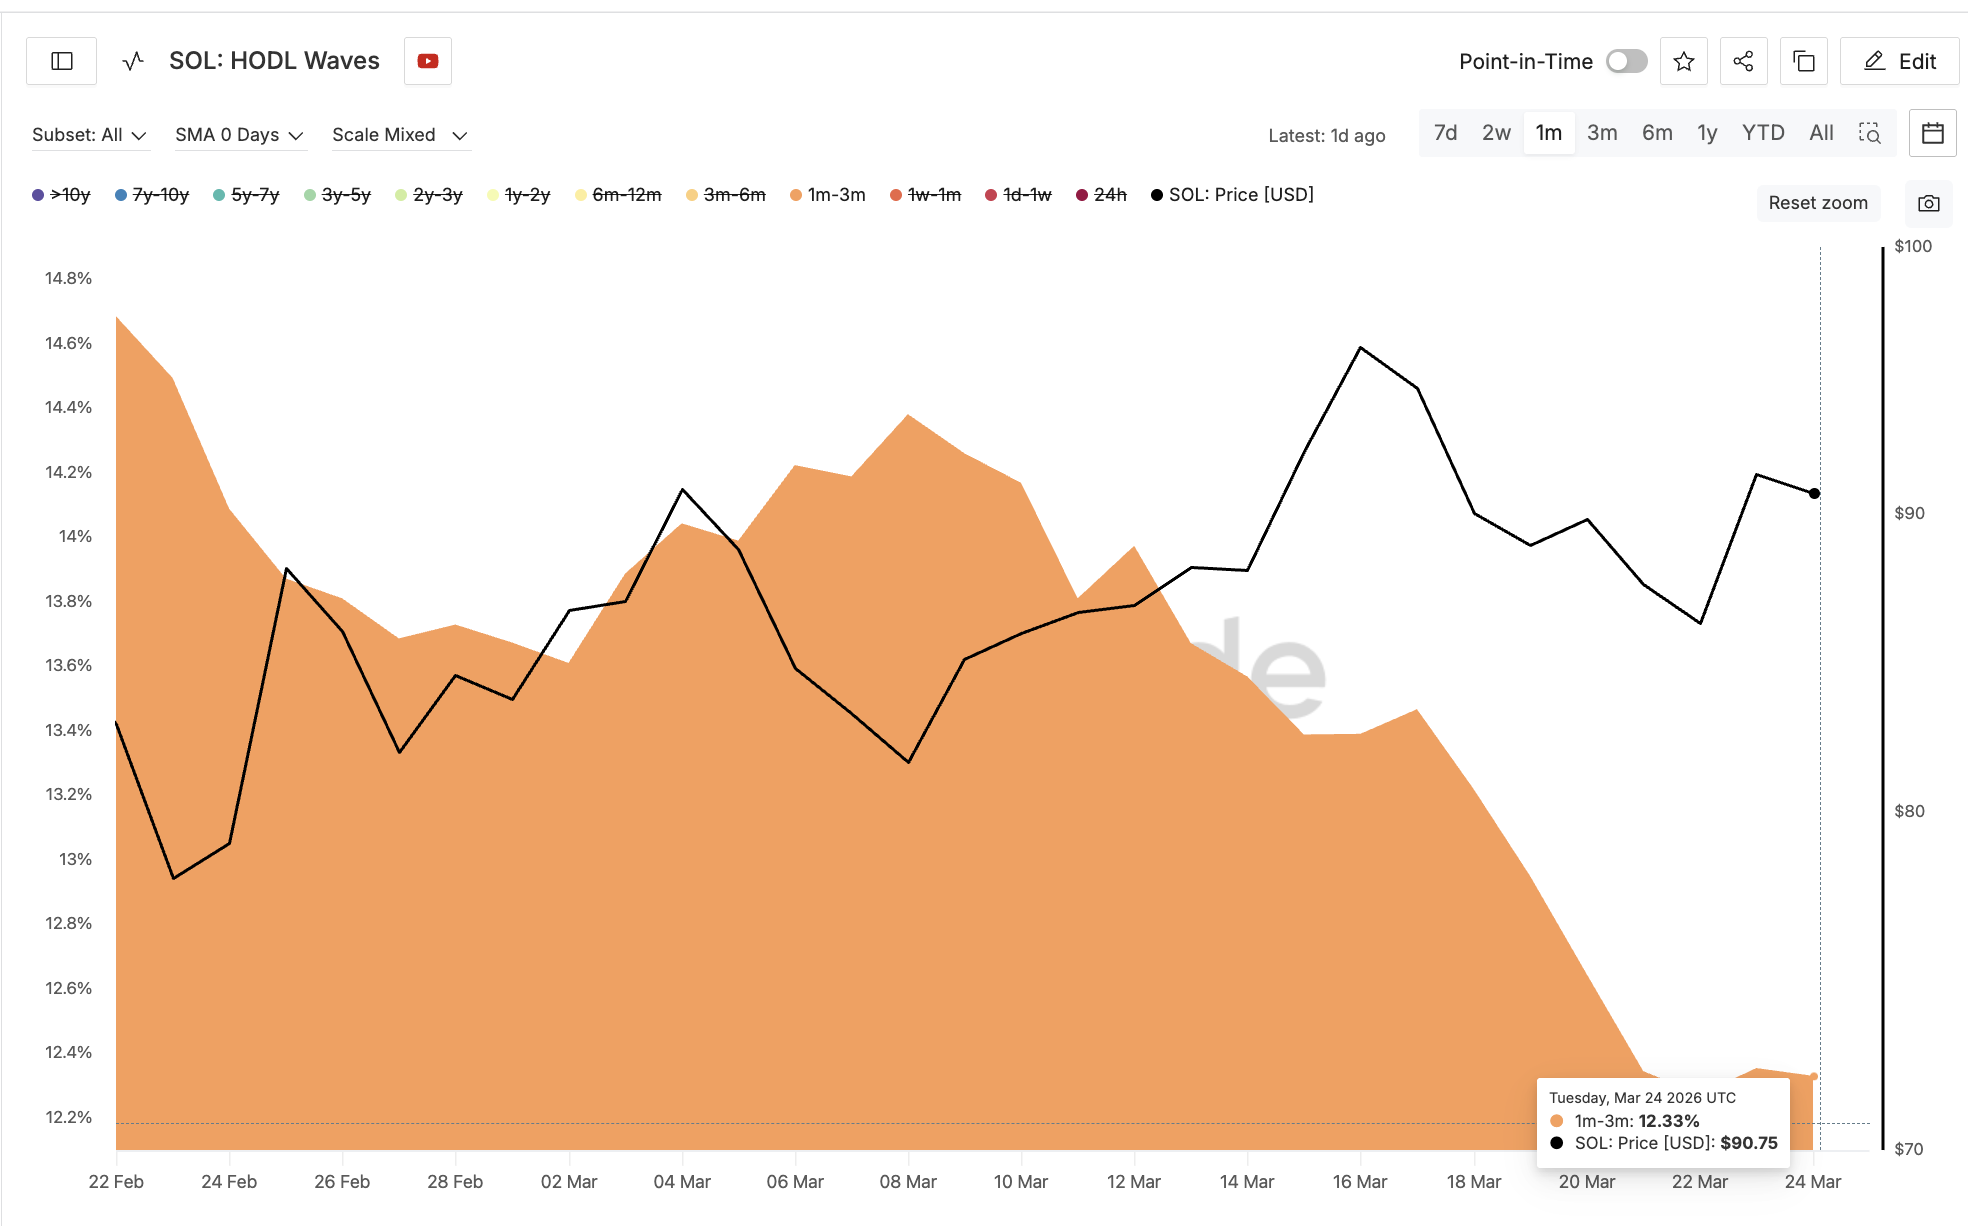
The pattern becomes more concerning when paired with Glassnode’s HODL Waves data, which segments cohorts by time. The 1-month to 3-month cohort, representing the most active short-term traders, held 14.68% of the circulating SOL supply on February 22. By March 24, that share had fallen to 12.33%, a drop of roughly 2.35 percentage points. That translates to a 16% reduction in their total holdings over just one month.
This is not minor profit-taking. A 16% supply drop from short-term holders signals that recent buyers are distributing at every bounce. The timing matters because it coincides with Solana’s recovery from the March lows. As the price climbed back toward the right shoulder, these holders used the strength to exit rather than ride the move higher.
Their selling explains why the right shoulder candle has seen a relatively large wick. Every push into that zone meets supply from a cohort that appears skeptical about the rally’s sustainability. The head-and-shoulders right shoulder keeps forming precisely because sellers step in at these levels.
With long-term holders accumulating but short-term holders distributing, the price chart becomes the final decider of which group is right.
Solana Price Forecast and the $93 Line
The tension between bullish EMAs and bearish structure converges at one level. A clean 4-hour close above $93 ($92.99 to be precise) would push SOL above the right shoulder resistance and prime a move toward $97, the head of the pattern. That breakout would also validate the looming golden cross and shift momentum decisively in favor of the bulls.
However, head and shoulders patterns that form during recovery rallies sometimes complete even when individual indicators flash bullish. The golden cross offers a momentum tailwind, but it does not invalidate the pattern on its own.
If SOL loses $90 on a sustained basis, the key technical level to watch sits at $85, which aligns with a historically significant 0.618 retracement. Below that, the neckline support near $84 becomes the decision zone. A breakdown through $84 would activate the pattern’s measured move of roughly 12%, targeting the $72 zone.

For now, $93 separates a golden cross rally toward $97 from a head-and-shoulders breakdown toward $72.
The post Solana’s Golden Cross Faces a 16% Supply Exit That Could Derail the Rally appeared first on BeInCrypto.