Ethereum has staged an impressive recovery from the $1.5K support region, but the latest rally is now approaching a critical inflection point. The market is testing a major supply zone that could determine whether the rebound extends toward higher resistance levels or transitions into another period of consolidation.
Ethereum Price Analysis: The Daily Chart
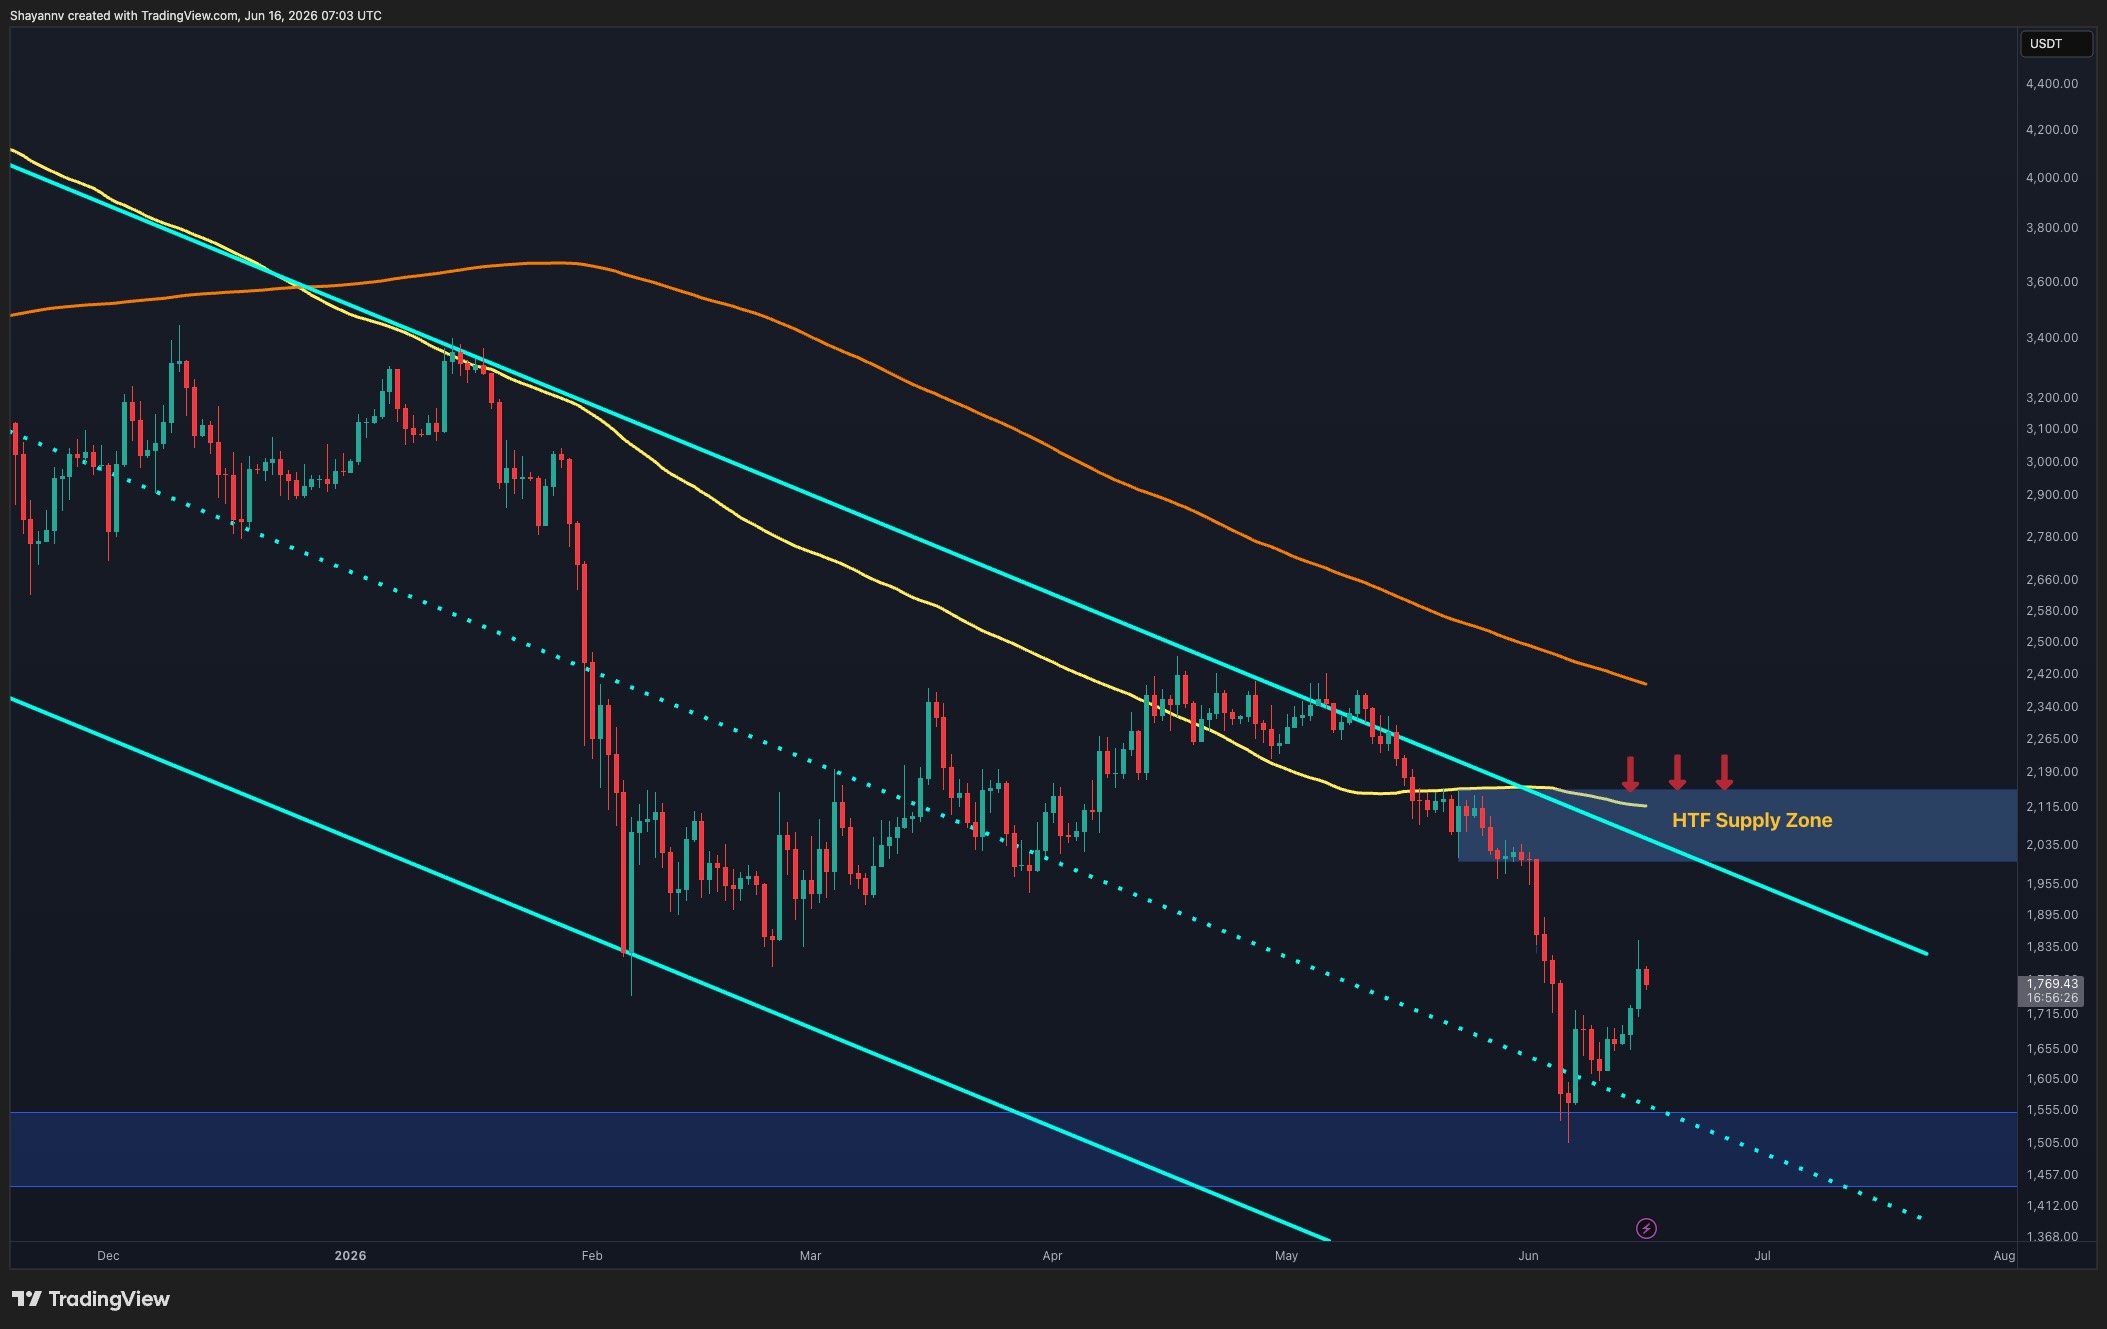
On the daily timeframe, ETH remains within a broader descending channel and continues to trade below the 100-day and 200-day moving averages. However, the recent price action has been constructive, with buyers successfully defending the $1.5K support zone and driving a strong recovery toward the $1.8K area.
The most important resistance now sits between $2K and $2.15K. This higher-timeframe supply zone coincides with the descending channel resistance and the 100-day moving average, making it a significant obstacle for bulls. A successful push into this area would likely attract increased selling pressure and serve as the next major test of market strength.
For now, the rebound remains intact as long as ETH continues to hold above the $1.5K support region. The recent higher low also suggests that buyers are gradually regaining control after the prolonged corrective phase.
ETH/USDT 4-Hour Chart
On the 4-hour timeframe, ETH recently rallied into the $1.83K resistance region, which aligns with the 0.5 Fibonacci retracement level at $1.83K and the highlighted decision zone between roughly $1.82K and $1.88K.
This area has already produced a reaction, with price pulling back after tapping the lower boundary of the supply zone. The current correction is therefore a crucial test of demand. If buyers manage to defend the $1.75K to $1.8K area and establish a higher low, another attempt toward the 0.618 Fibonacci level at $1.9K becomes increasingly likely.
A breakout above $1.9K could then expose the 0.702 and 0.786 retracement levels at $1.96K and $2.01K, respectively. On the other hand, failure to hold the recent breakout structure would increase the probability of a deeper retracement before the uptrend can continue.

Sentiment Analysis
The funding rate chart provides an interesting perspective on market sentiment. Funding rates recently turned deeply negative as ETH approached the $1.5K region, indicating that short positioning became crowded during the decline.
Historically, similar periods of strongly negative funding have coincided with local bottoms, as excessive bearish positioning often creates the conditions for short squeezes and relief rallies. The current setup appears to be following a comparable pattern, with ETH recovering sharply after funding rates reached extreme negative territory.
More importantly, funding has now returned to positive levels while remaining far below the euphoric readings seen during previous major rallies. This suggests that leverage is gradually rebuilding, but speculative excess has not yet reached concerning levels.
As a result, the funding data continues to support the possibility of additional upside toward the $1.9K to $2K resistance region, although the market is now entering a key supply area where profit-taking and renewed selling pressure could emerge.

The post Ethereum Price Analysis: ETH’s Recovery Hinges on This Level as Bulls Aim for $2K appeared first on CryptoPotato.