Bitcoin is trading at $77.5k as the third week of May draws to a close. The market is recovering quietly from the $75k–$76k support zone after last week’s failed breakout attempt above $80k.
The structure has absorbed the pullback without breaking, the ascending channel floor continues to rise, and the on-chain picture tells a story that the price chart alone undersells. Sentiment is rebuilding from levels last seen at the very beginning of the previous bull market.
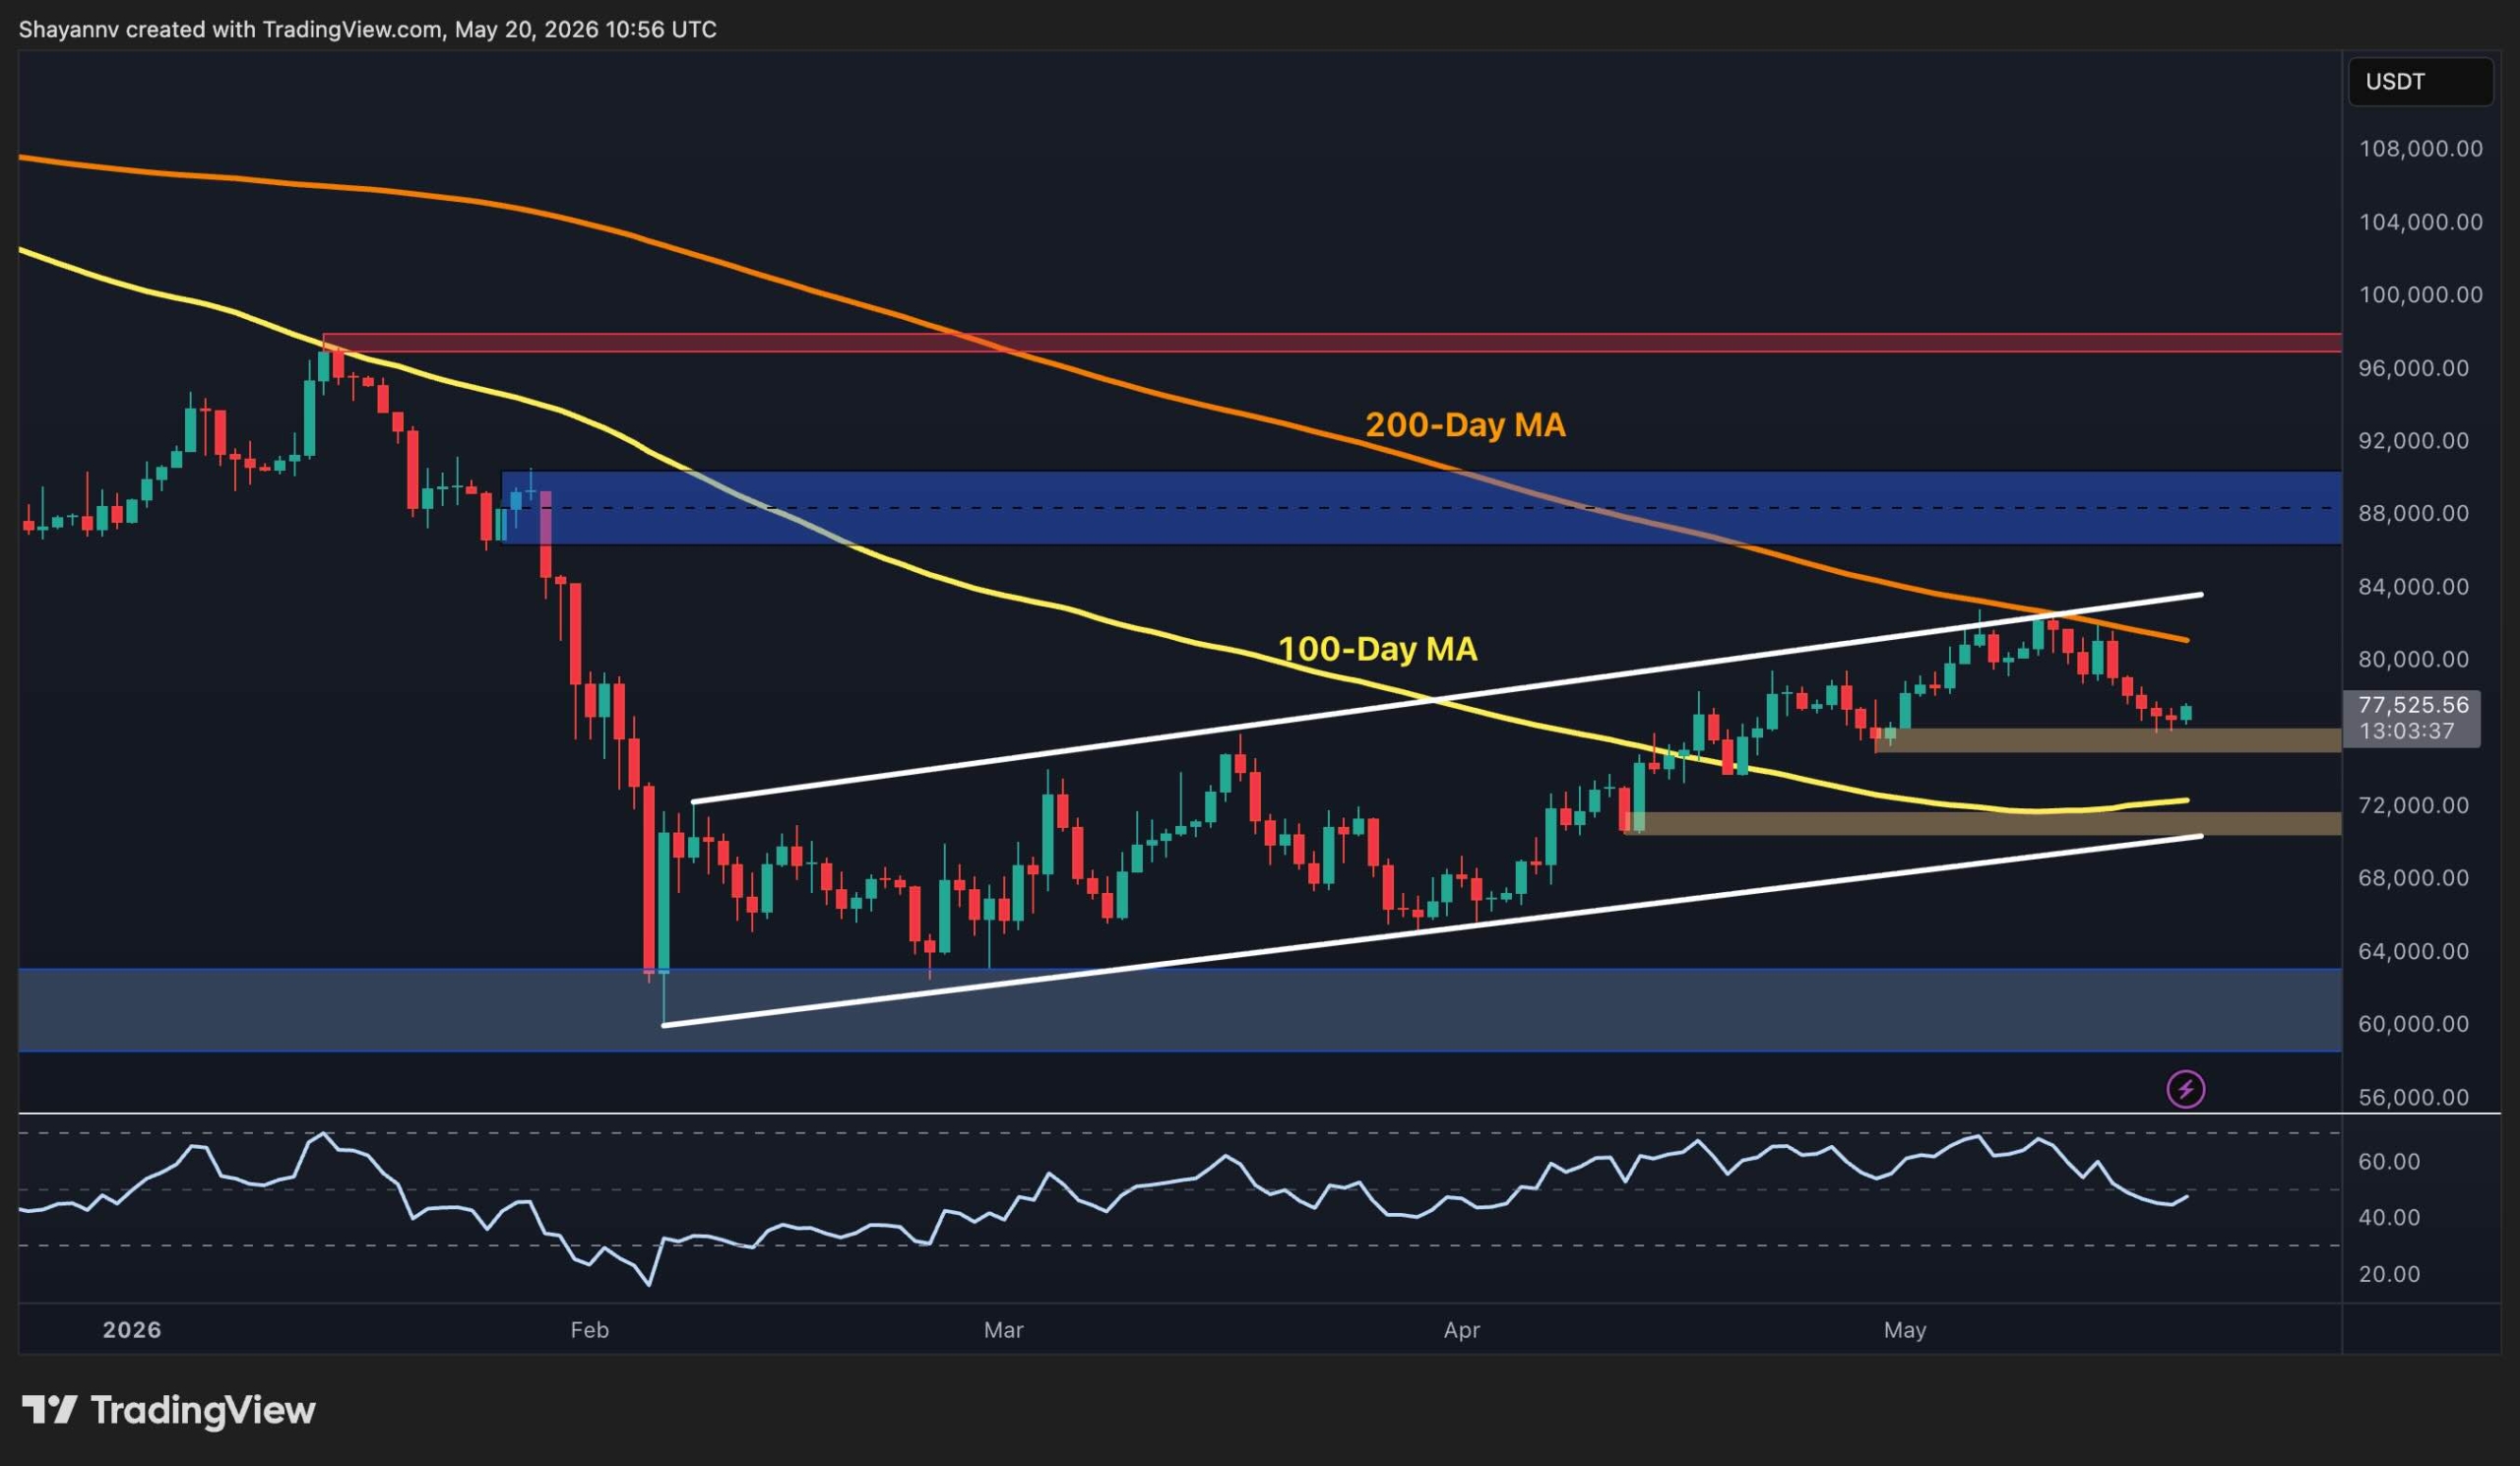
Bitcoin Price Analysis: The Daily Chart
On the daily timeframe, the ascending white channel from the February low has held, with the asset bouncing from the upper edge of the $75k–$76k support zone today, rising toward $77.5k. The 100-day moving average is now sloping upward to approximately $72k and is now converging with that same support zone. This will likely create a strengthening combined support floor that rises a little further every week.
The RSI is also hovering around 50, showing little signs of directional momentum. A recovery back above $80k and a breakout above the 200-day moving average nearby are the immediate requirements to restore bullish momentum.
If this scenario materializes, the $88k–$90k band is the structural target above. On the other hand, a daily candle close below $75k and the 100-day MA near $72k would be the first serious structural damage of the recovery.
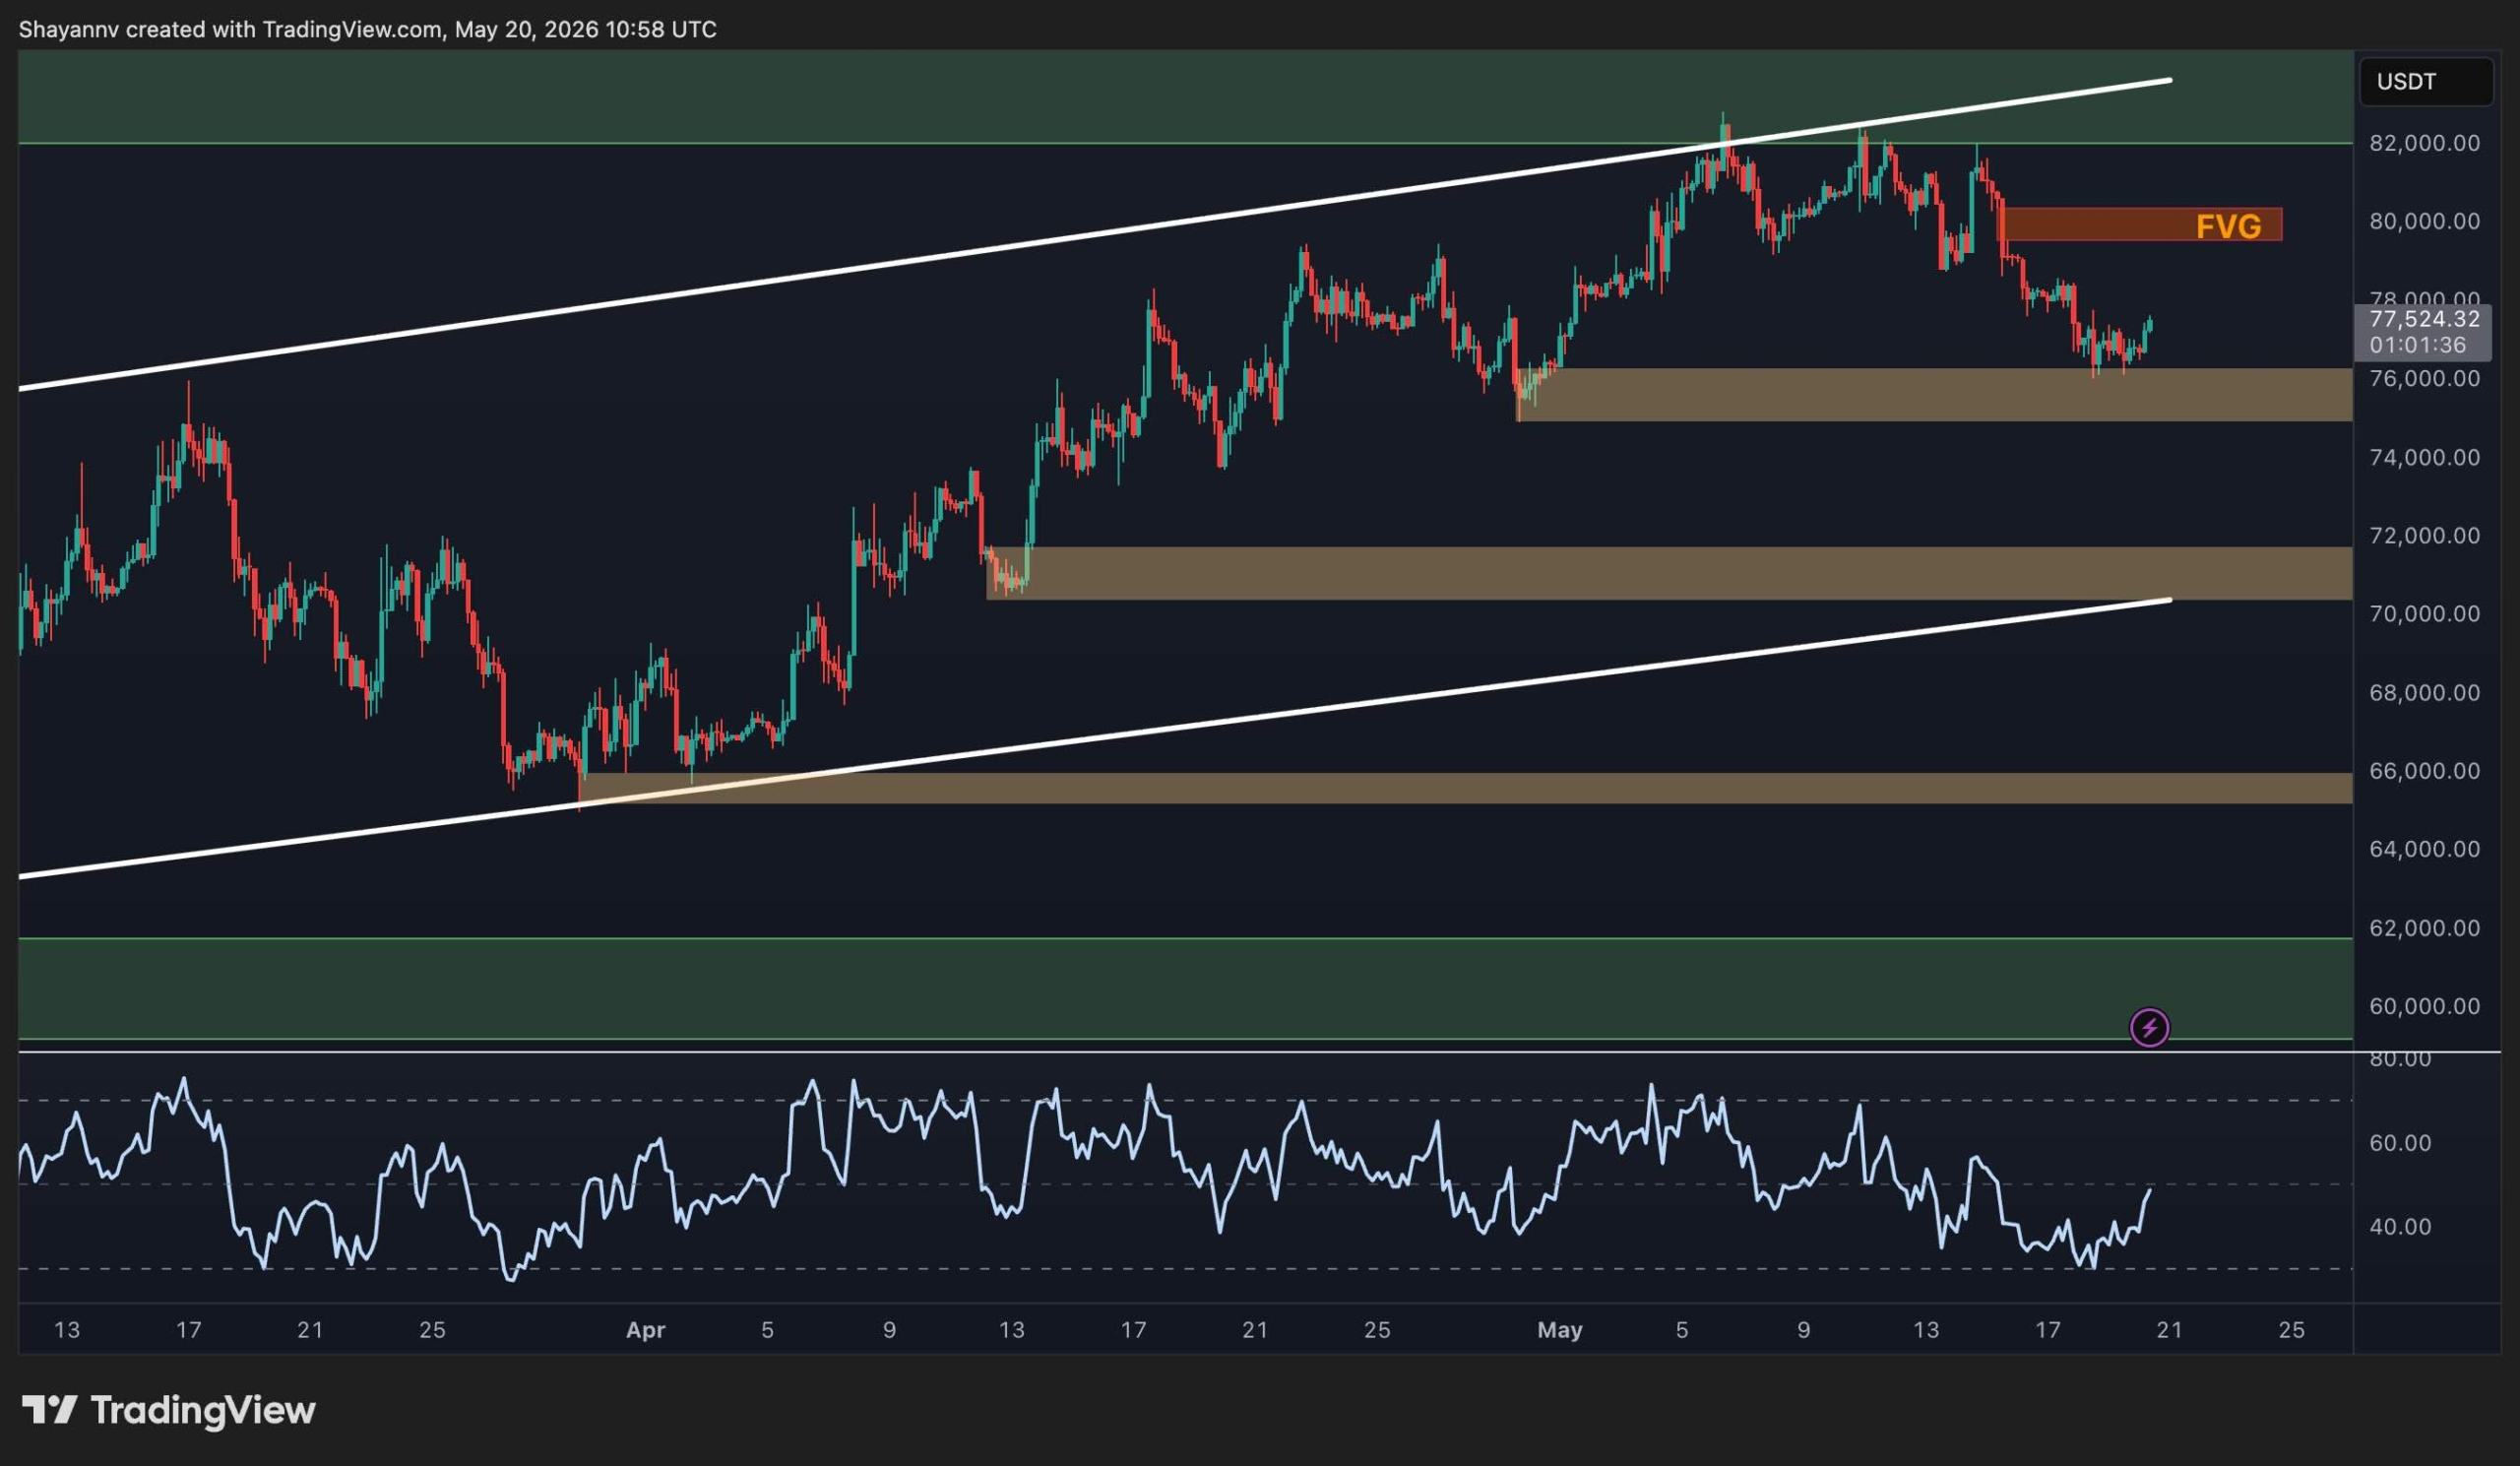
BTC/USDT 4-Hour Chart
The bounce from the $75k–$76k support zone has lifted the 4-hour RSI from the low-to-mid 30s back to approximately 50. The asset is now tracking toward the bearish Fair Value Gap marked on the chart near $80k. This is a price imbalance left by the sharp sell-off from the $82k highs, which the underlying asset typically returns to fill before resolving direction.
The FVG is the immediate short-term target on the upside. A clean move through it would signal that the pullback is fully absorbed and the next push toward the $82k supply zone and the upper boundary of the daily channel is building. However, failure to trade through the FVG and a rollover back below $75k would suggest the selling pressure from the failed breakout is not yet exhausted, opening the path toward the lower demand zone at $70k–$72k as the next test.
On-Chain Analysis
The Net Unrealized Profit/Loss has recovered from its February low of approximately 0.12, which was the deepest reading since October 2023 and briefly demonstrated a capitulation period. The metric has now risen back to the current reading of 0.29. That number puts the market above the green zone, and the average BTC holder is sitting on moderate unrealized gains, but the kind of euphoria that precedes major tops is nowhere in sight.
The historical parallel is precise. NUPL crossed 0.29 in late 2023 near $40k on its way to the bull market peak. The journey from that level to the 0.50 threshold, where momentum historically accelerates, corresponded to a price move from roughly $40k to $80k. At $77.5k with NUPL at 0.29, the on-chain sentiment structure suggests the market is in a similar position. It’s likely past capitulation, rebuilding confidence, but with the majority of the cycle’s unrealized gains still ahead rather than behind.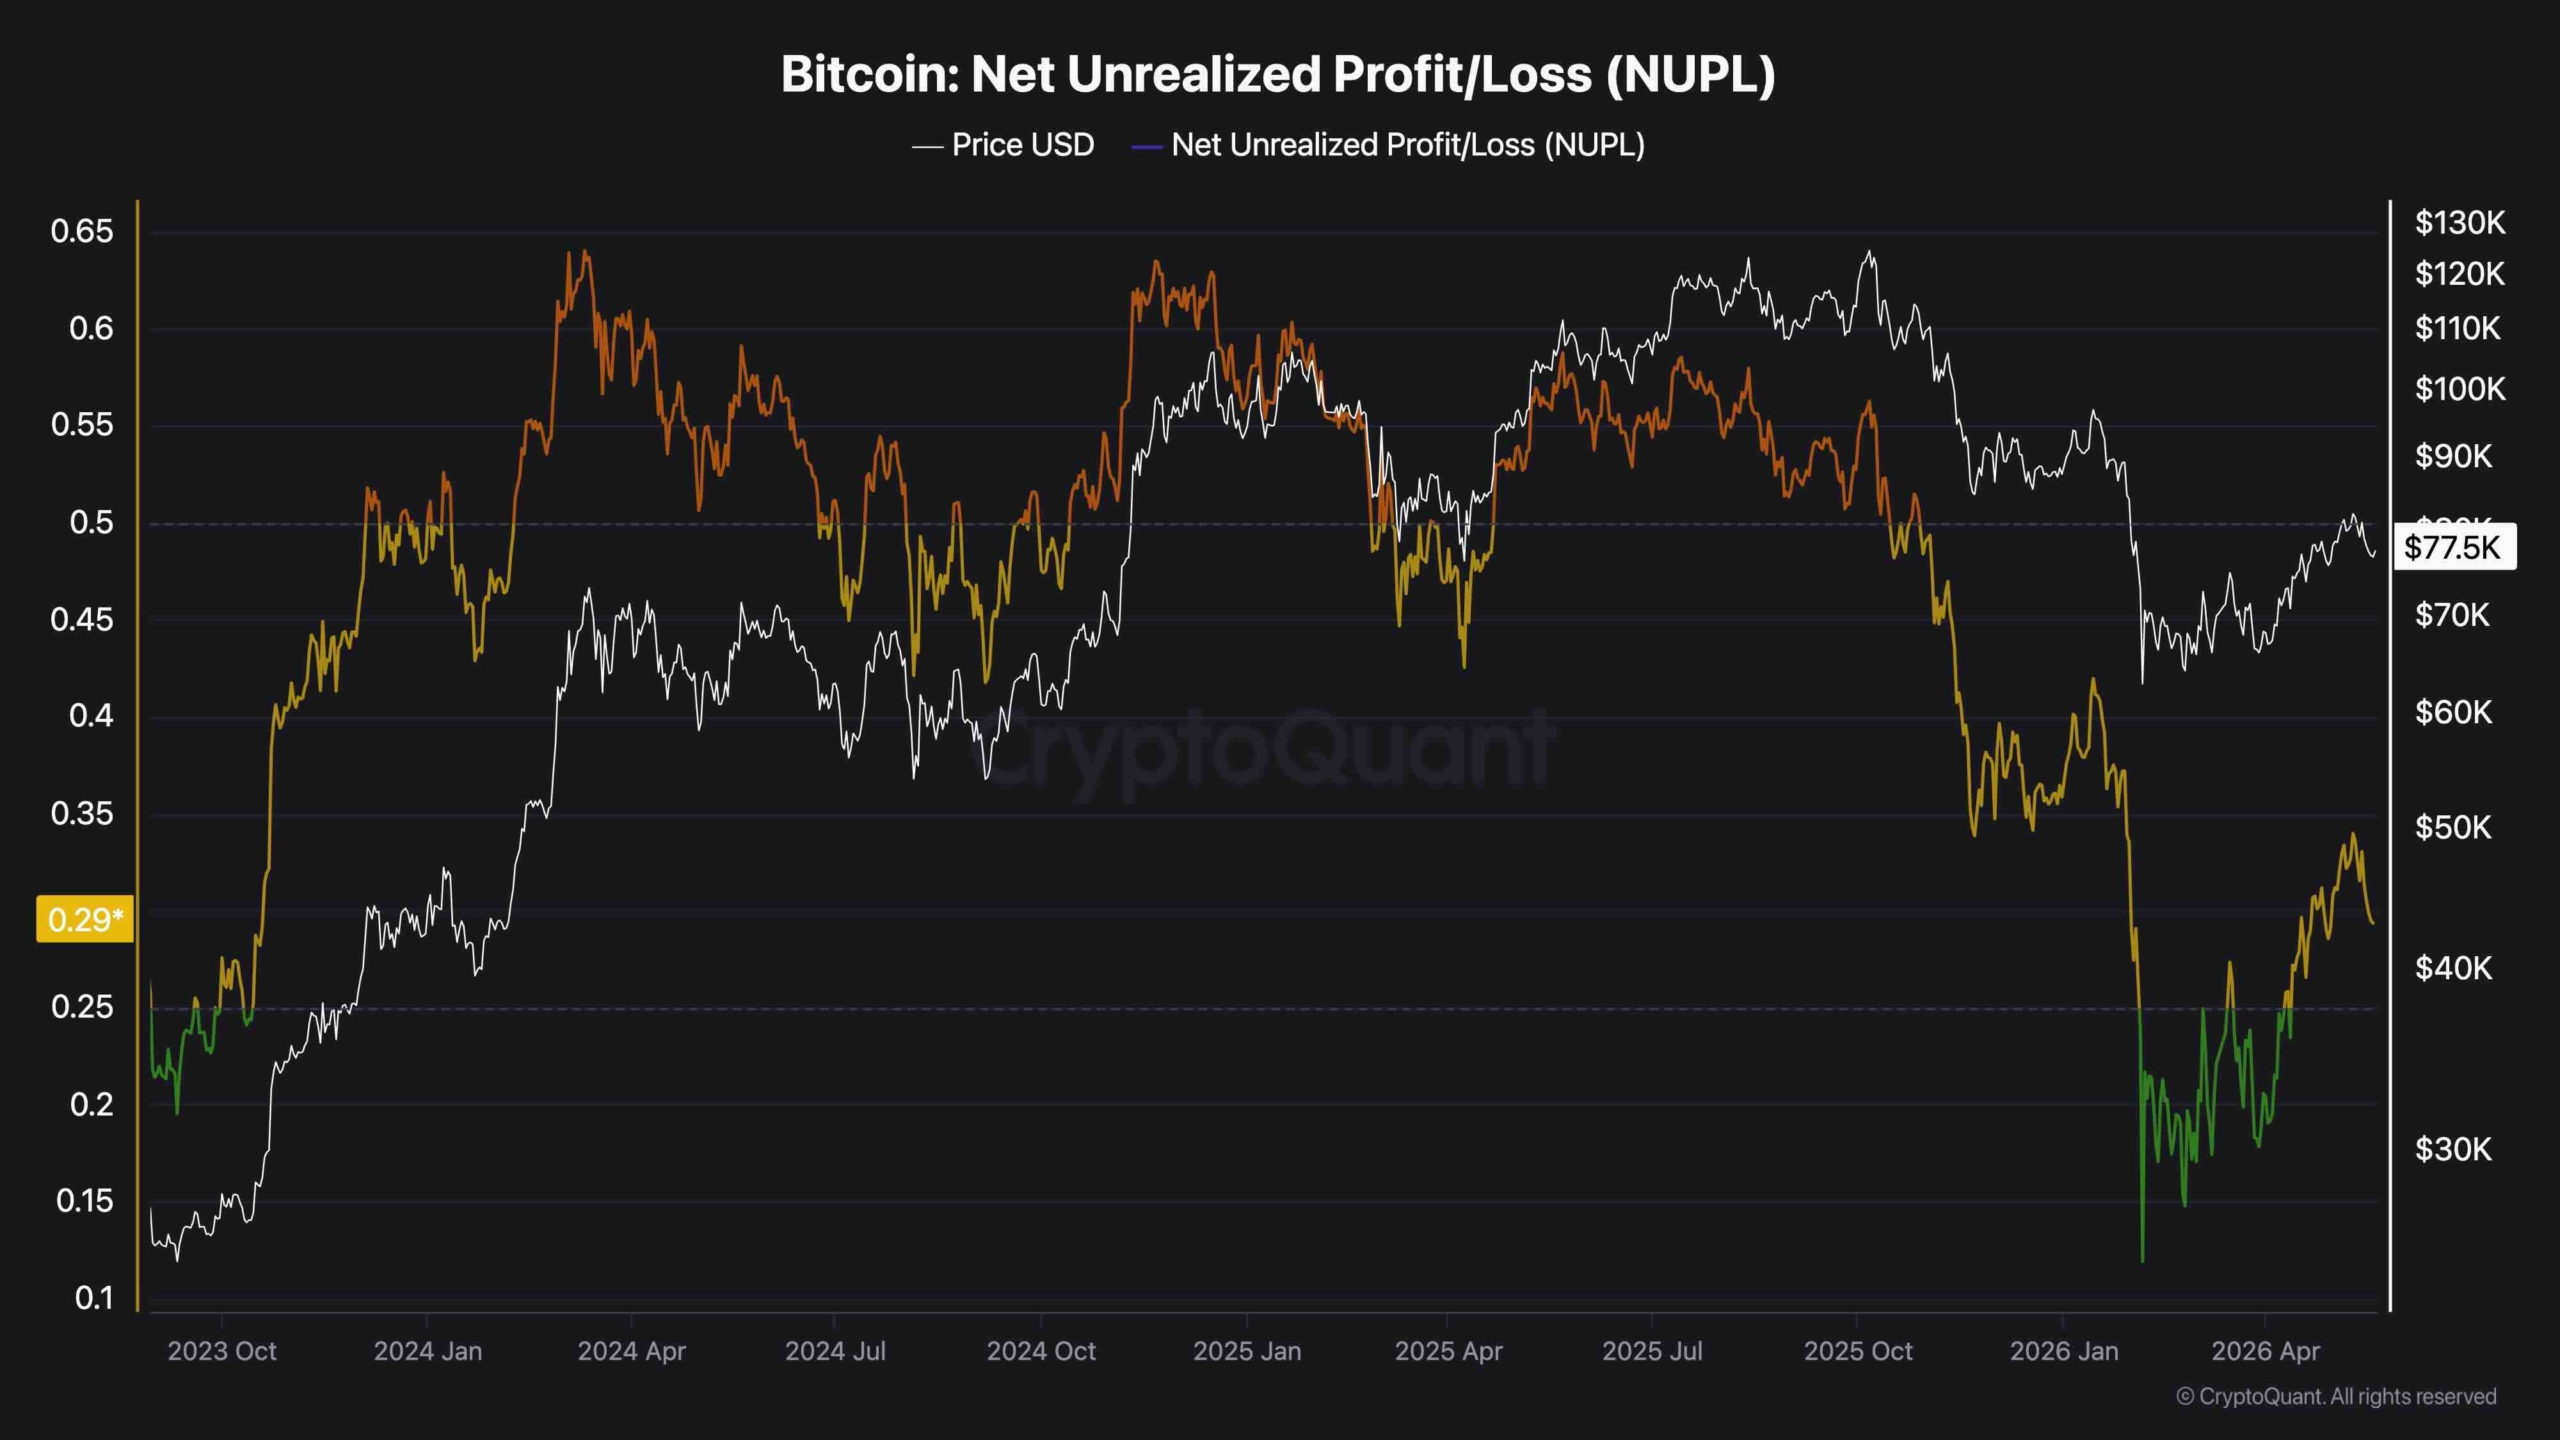
The post Bitcoin Price Analysis: On-Chain Metric Says BTC Is Coiling for a Big Move appeared first on CryptoPotato.