Zcash price has been under steady pressure over the past two weeks, and the broader structure now leans decisively bearish. Since mid-January, ZEC has slipped into a breakdown path that points toward a potential 35% decline if key levels fail.
At the same time, not all signals are aligned. Some large holders are still adding exposure, and short-term momentum indicators suggest dip buying has not fully disappeared despite quick exits. Whether Zcash stabilizes or continues lower now depends on how the price reacts around a few critical levels.
Breakdown Structure Points Toward a 35% Decline
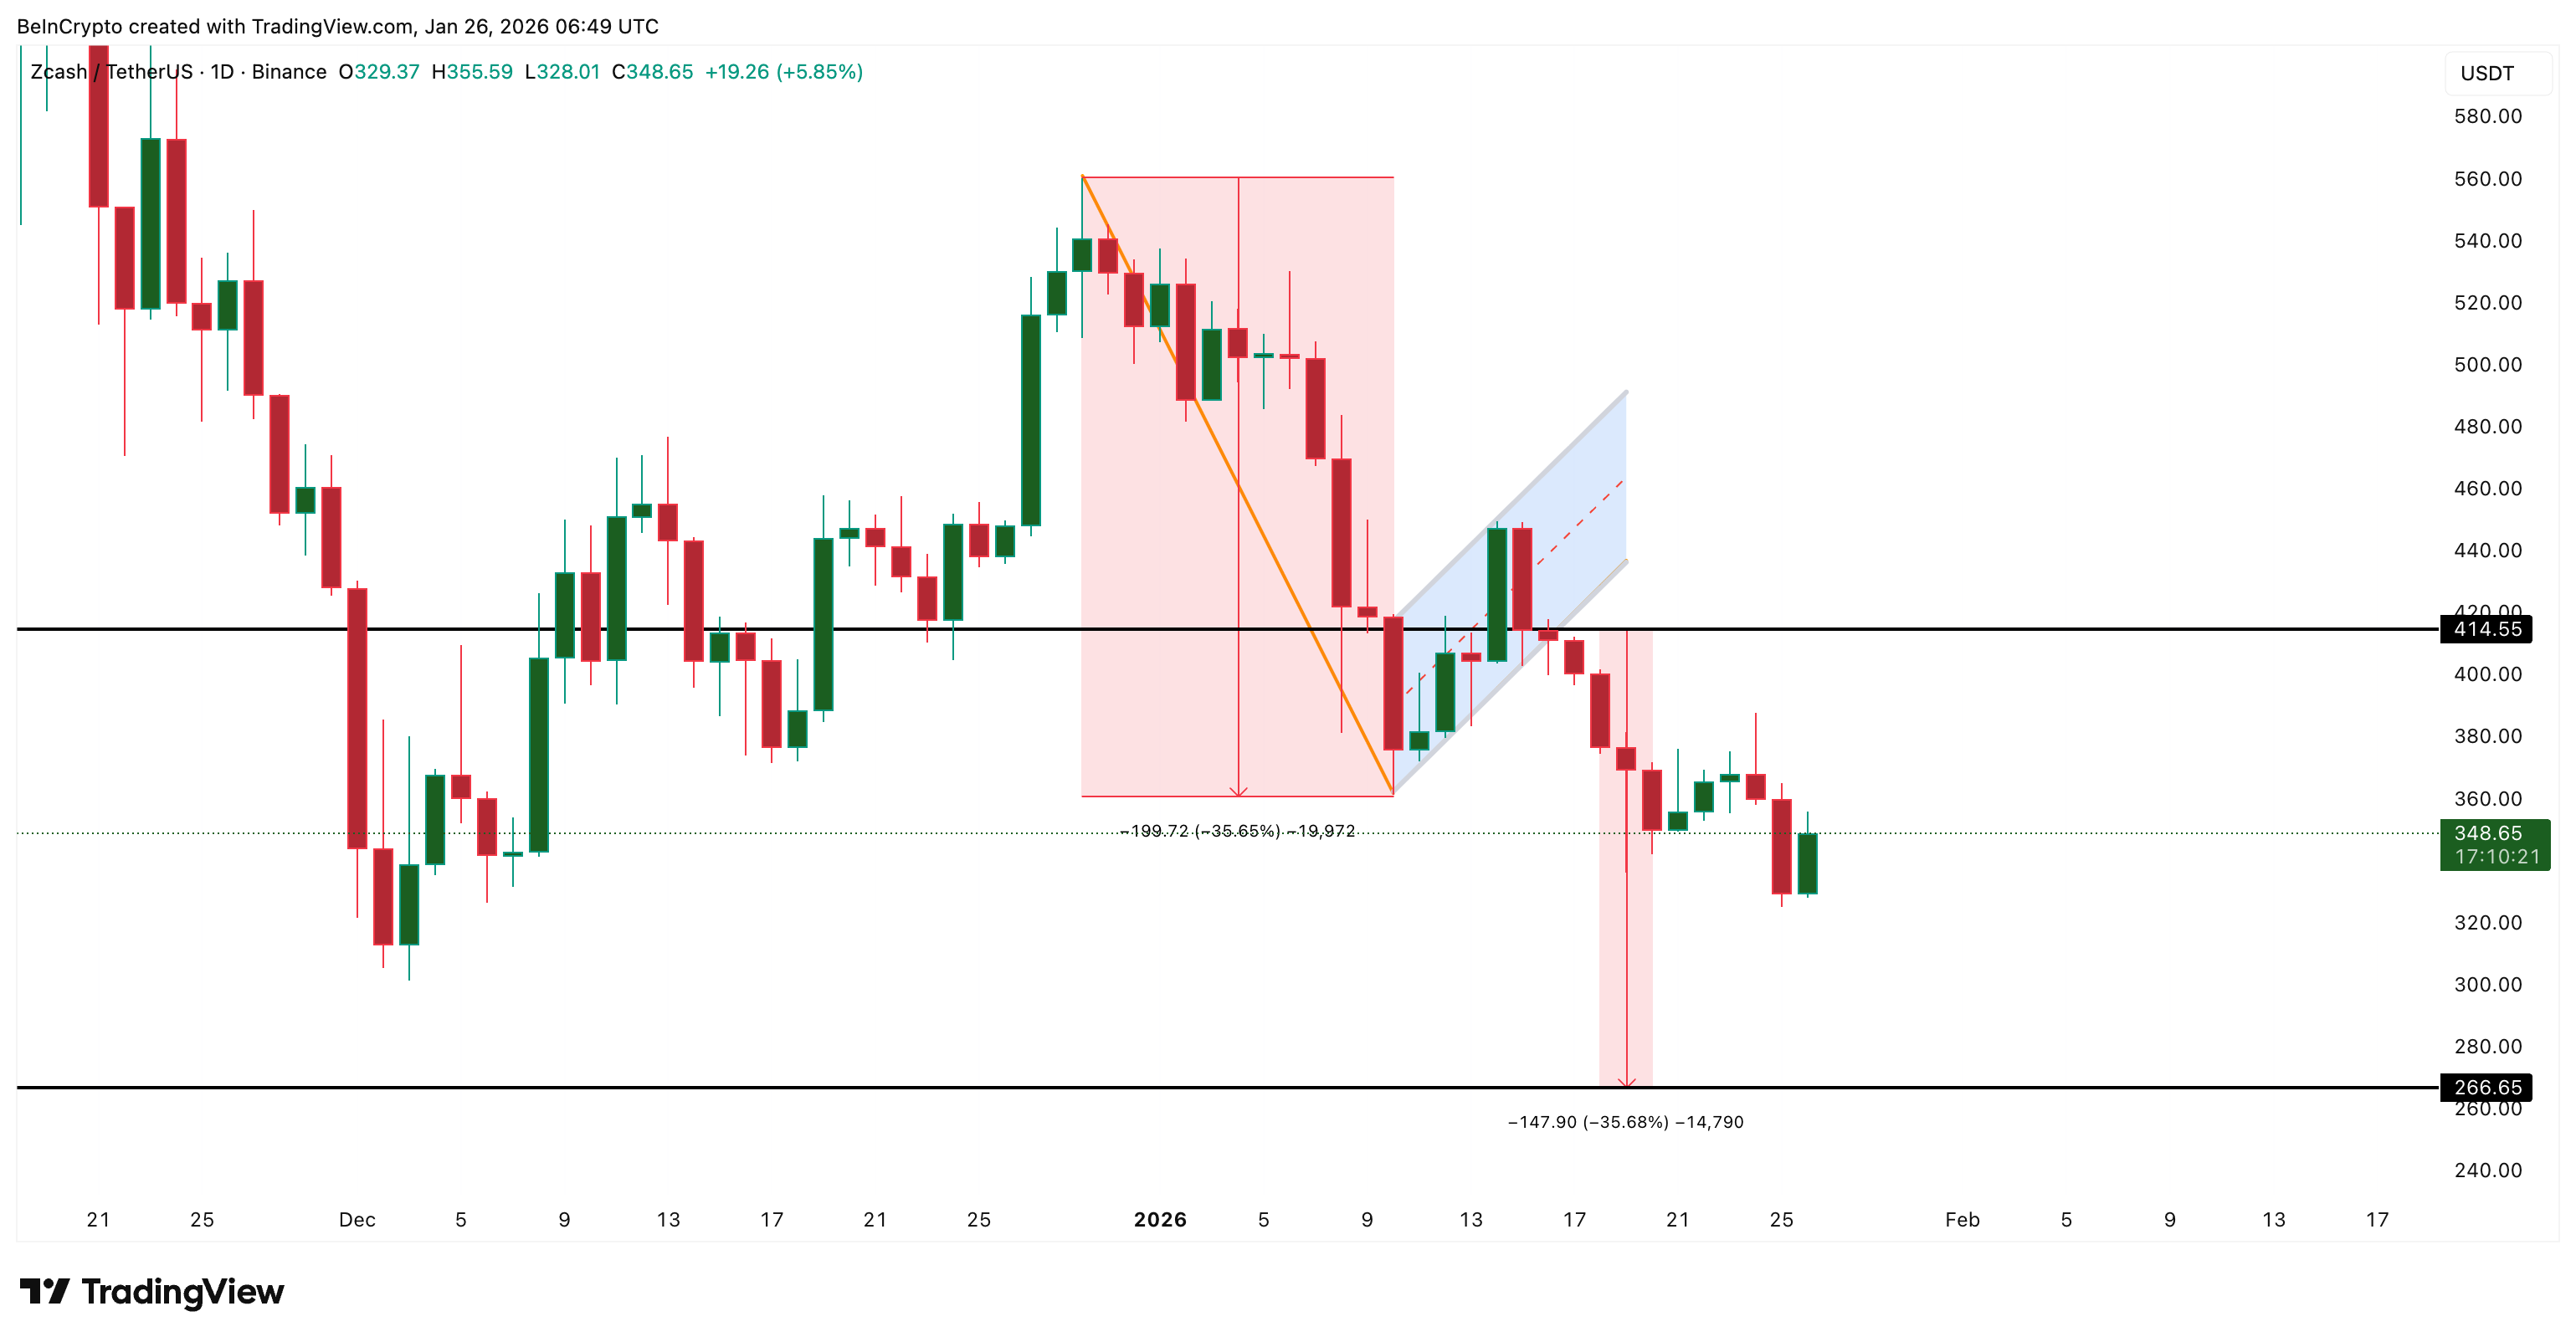
Zcash’s daily chart shows that the bear-flag breakdown began on January 16, when the price fell below the $414 zone. This move marked a loss of the prior consolidation range and confirmed a bearish continuation structure.
Based on the height of the prior range, the pole of the bear-flag and the breakdown projection, the structure points toward a downside target near $266. That implies a potential decline of roughly 35% from the breakdown area.
Want more token insights like this? Sign up for Editor Harsh Notariya’s Daily Crypto Newsletter here.
This is no longer a theoretical risk. The ZEC price has already moved in line with the projection, indicating that sellers remain in control of the broader trend.
However, structure alone does not explain why the price has not collapsed faster. For that, we need to look at momentum and capital flow.
Large Holders Step In, But Retail Conviction Stays Weak
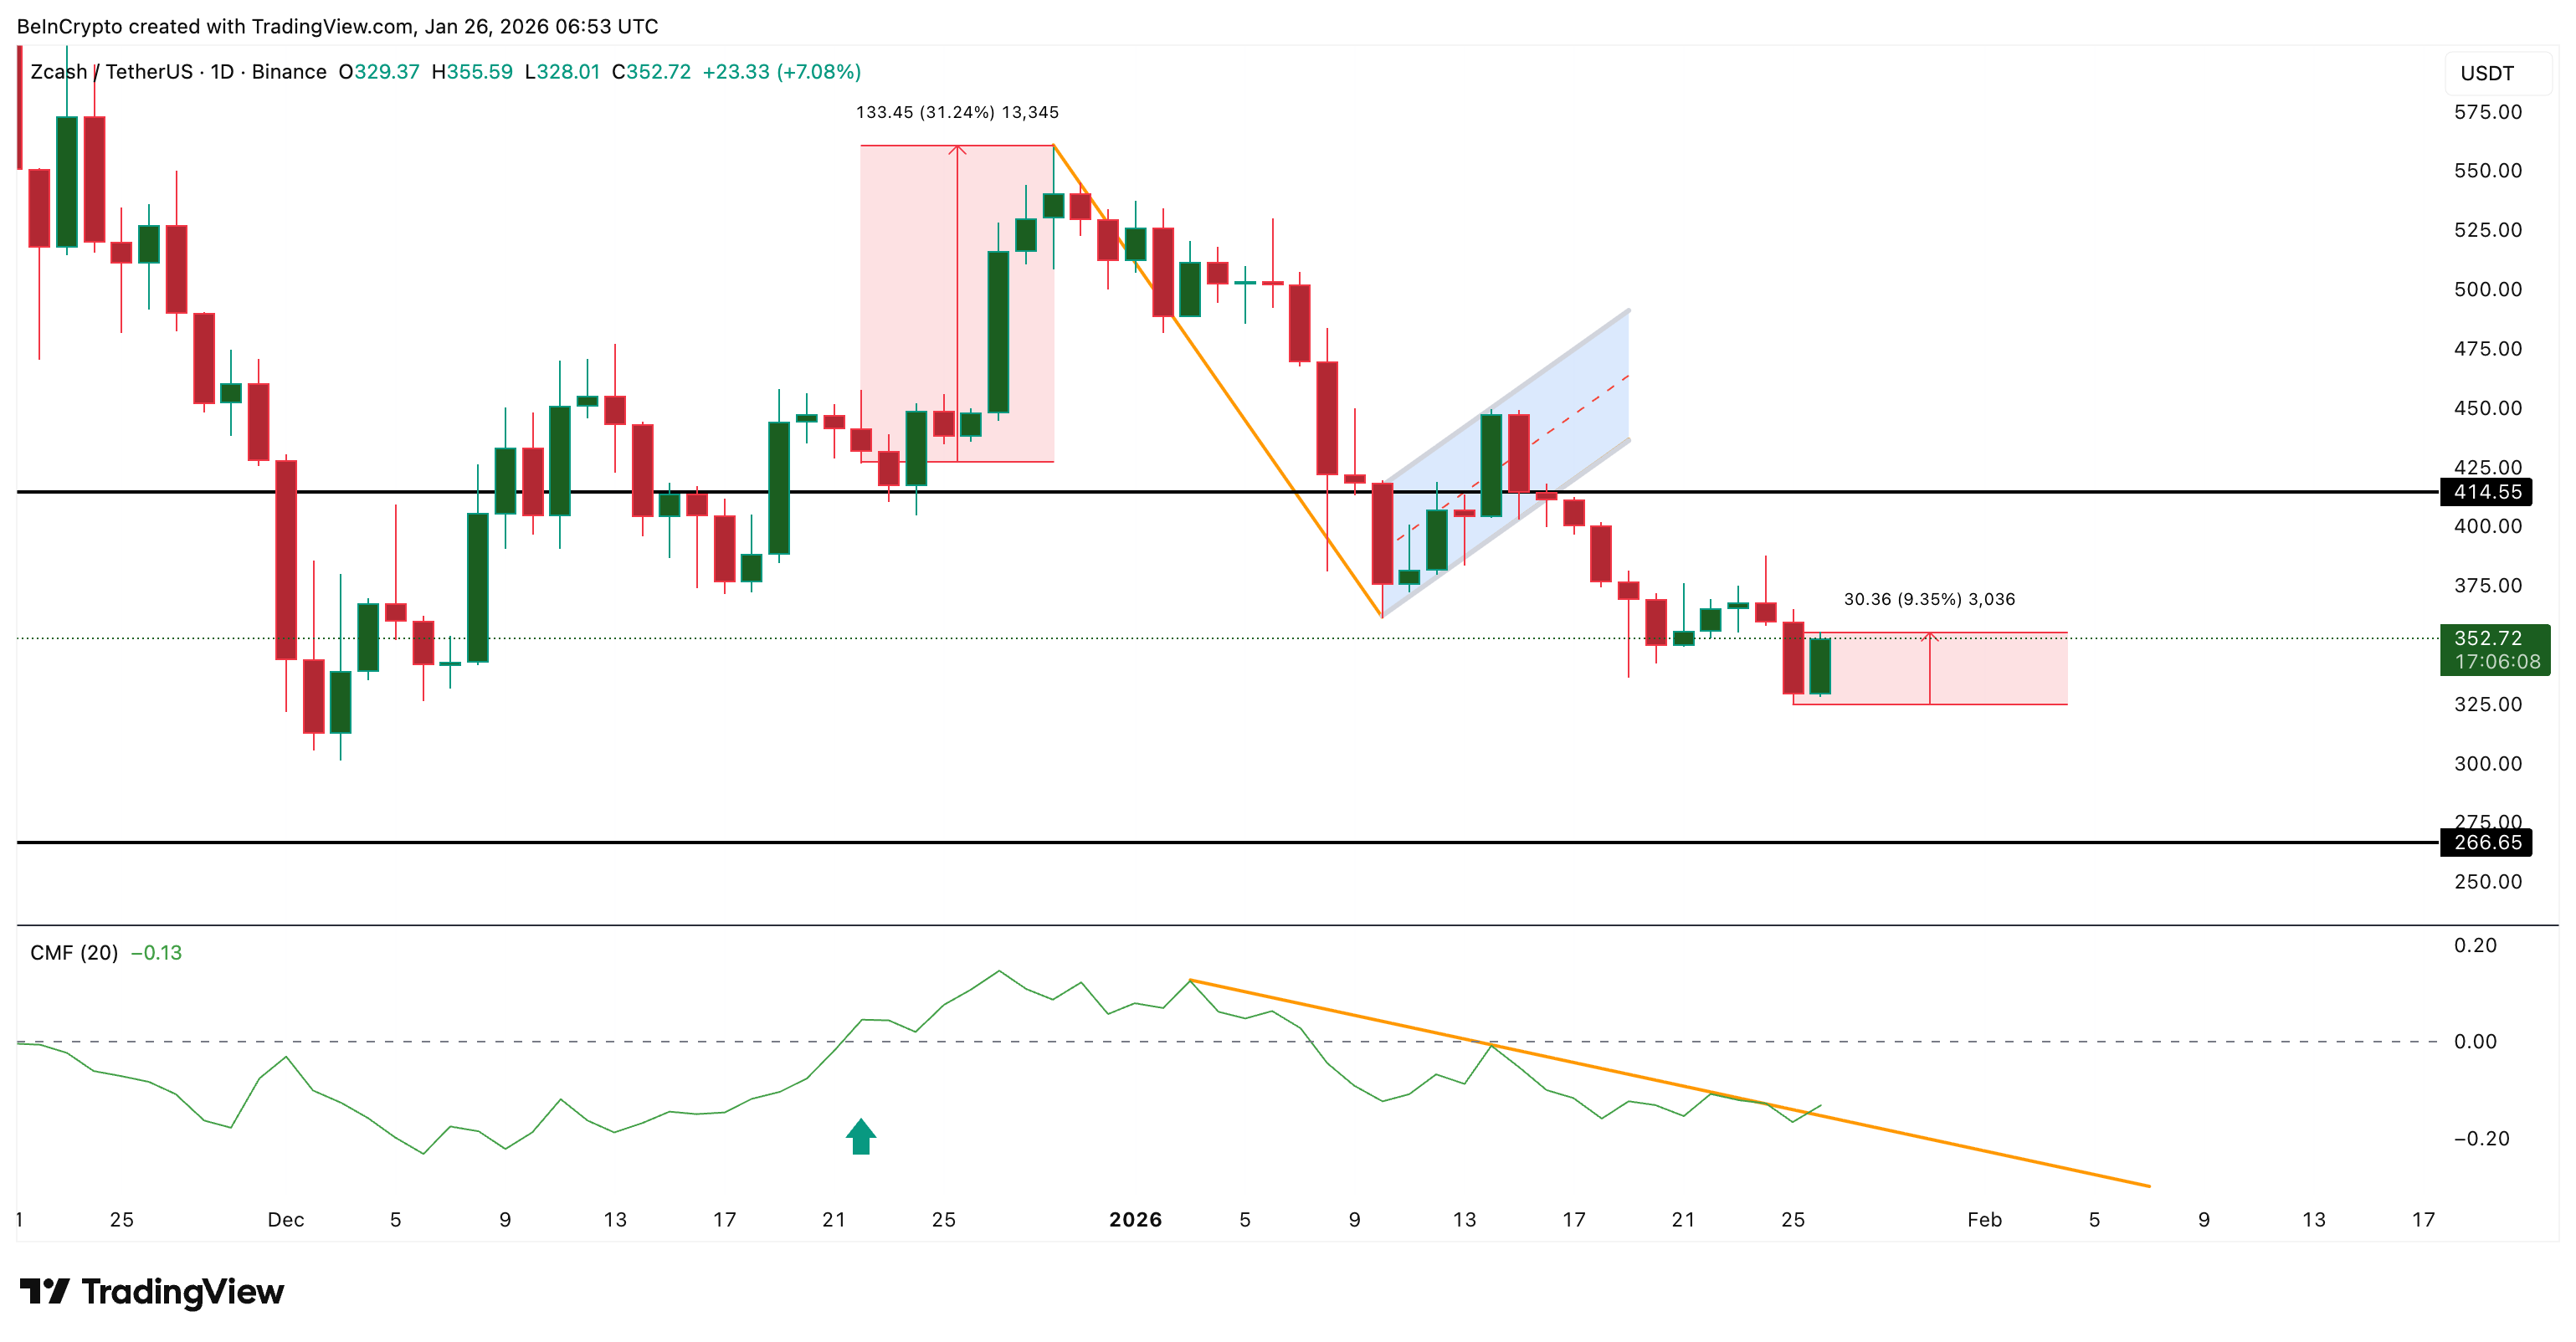
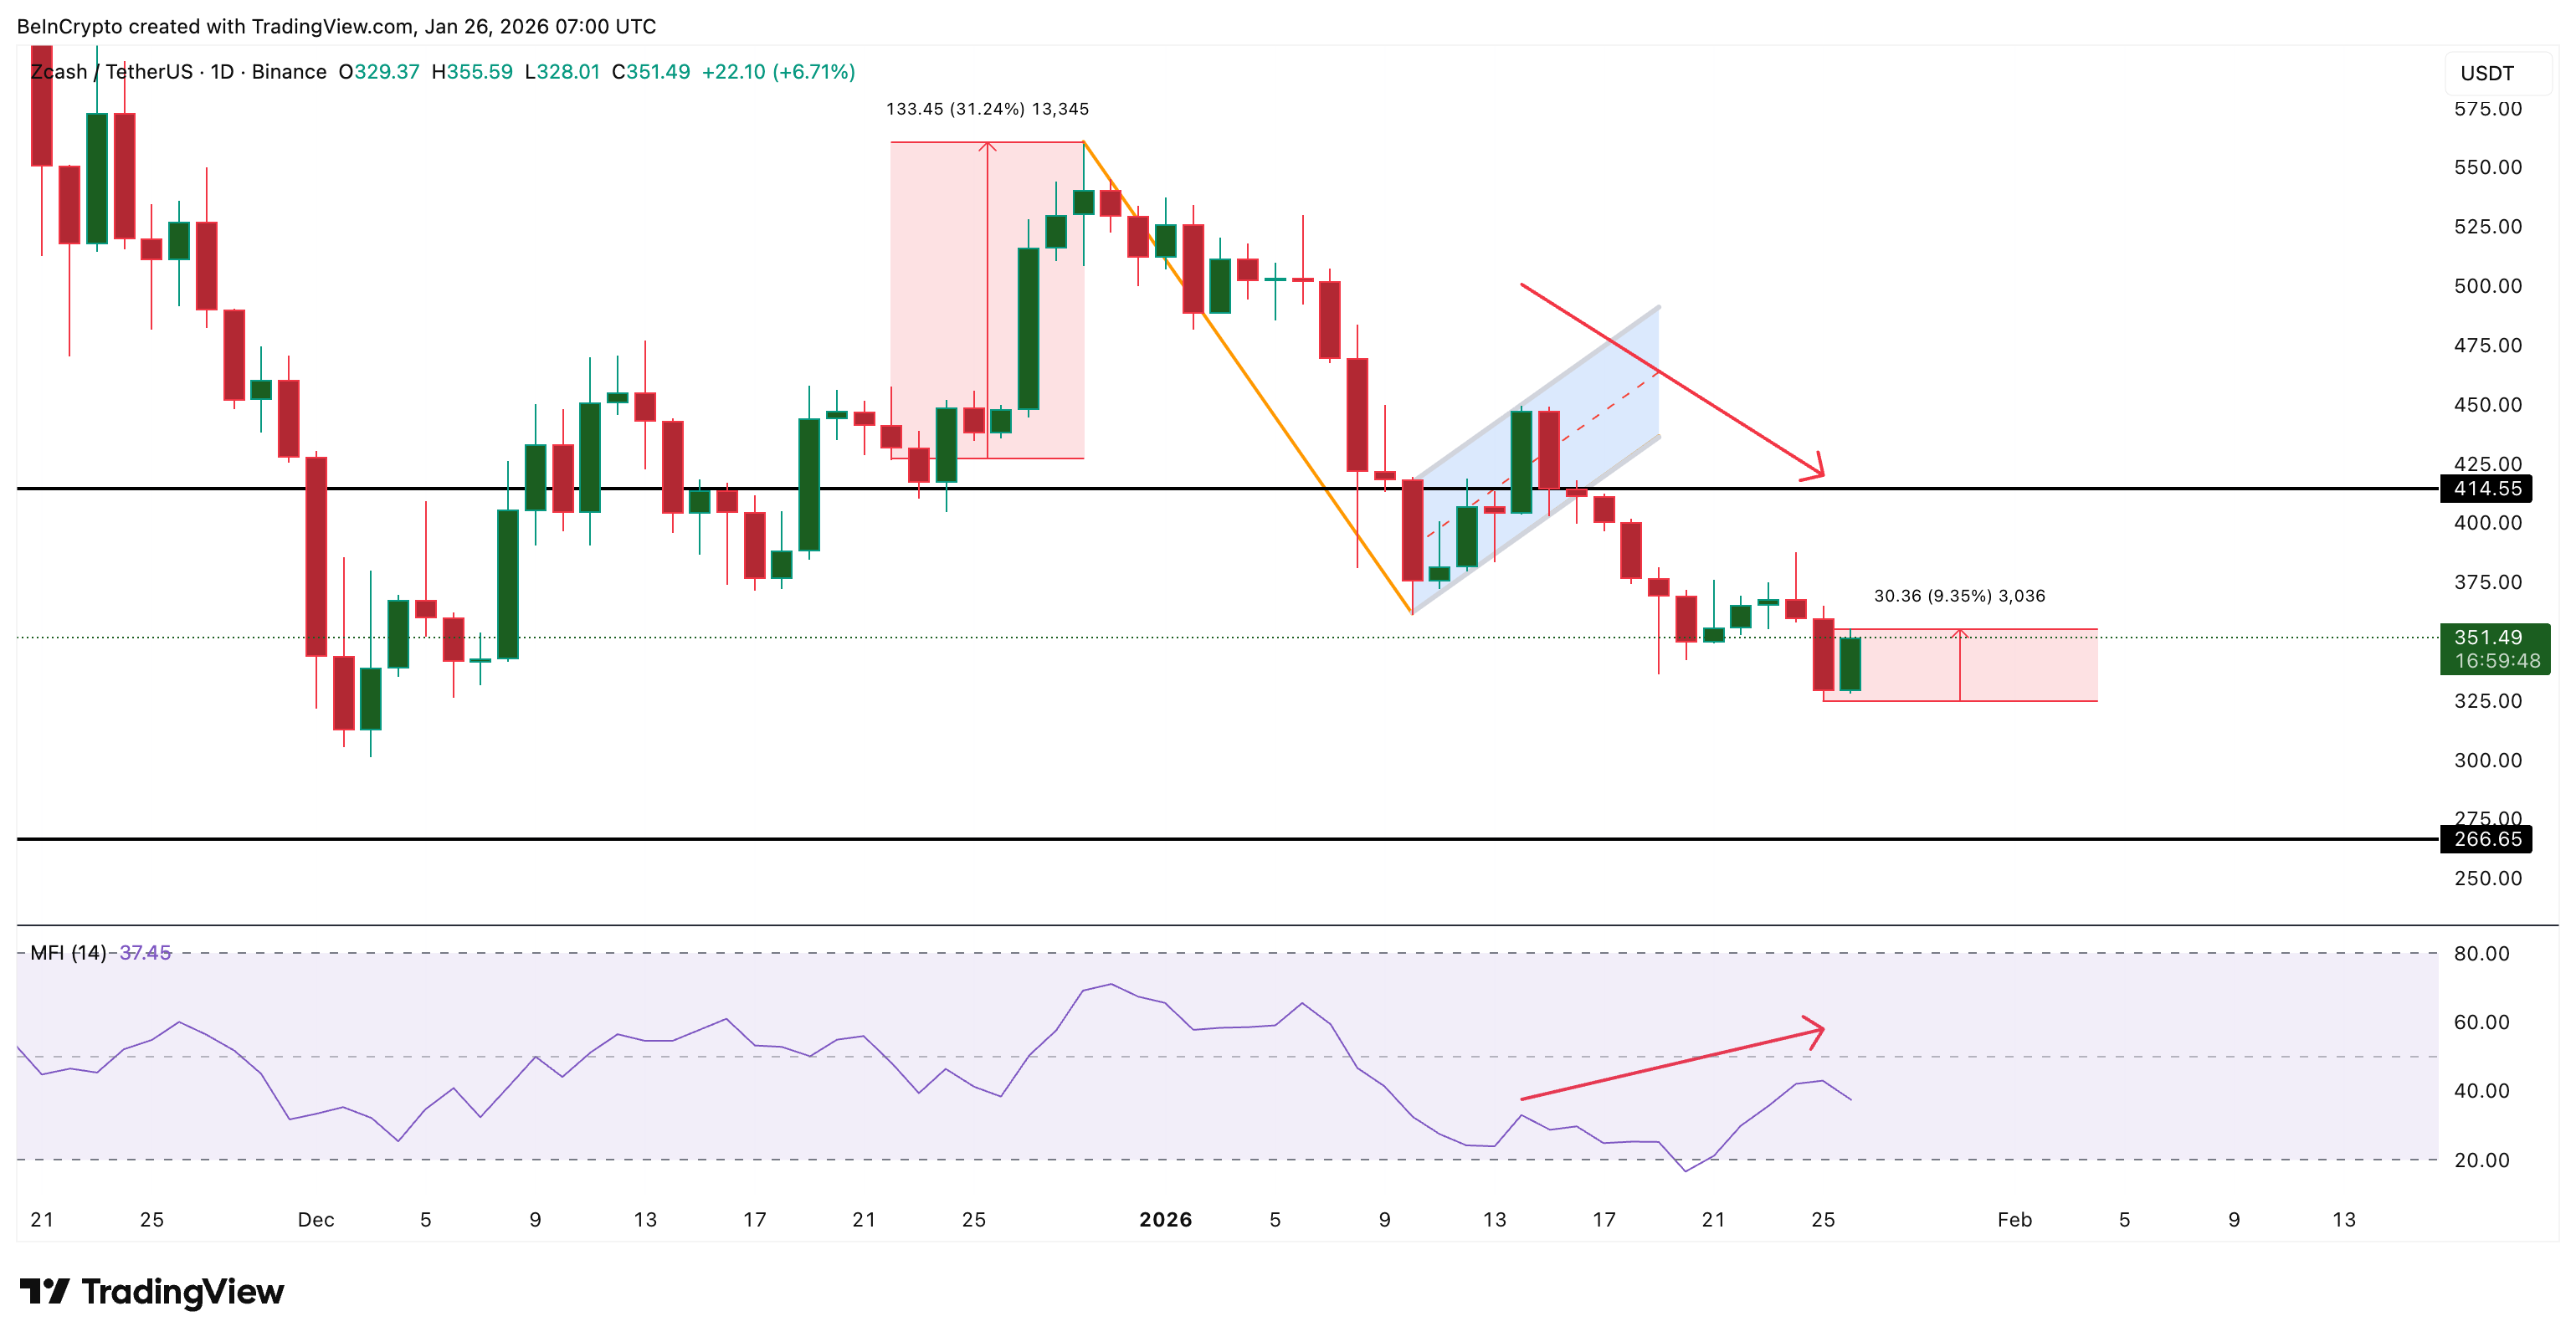
Despite the bearish structure, Zcash has seen a short-term rebound of roughly 9% from the January 25 low. This bounce aligns closely with changes in the Chaikin Money Flow, or CMF.
CMF measures whether large capital is flowing into or out of an asset by combining price and volume. When CMF rises, it suggests buying pressure is increasing. When it falls below zero, it signals net outflows.
Recently, ZEC’s CMF broke above a descending trendline that had capped it for weeks. This shift helped fuel the short-term rebound. However, CMF is still below the zero line. That means buying pressure exists, but it is not yet strong enough to reverse the broader trend.
A similar CMF break above zero previously led to a rally of around 31%. Therefore, to nullify the breakdown path, CMF’s zero reclaim is critical.
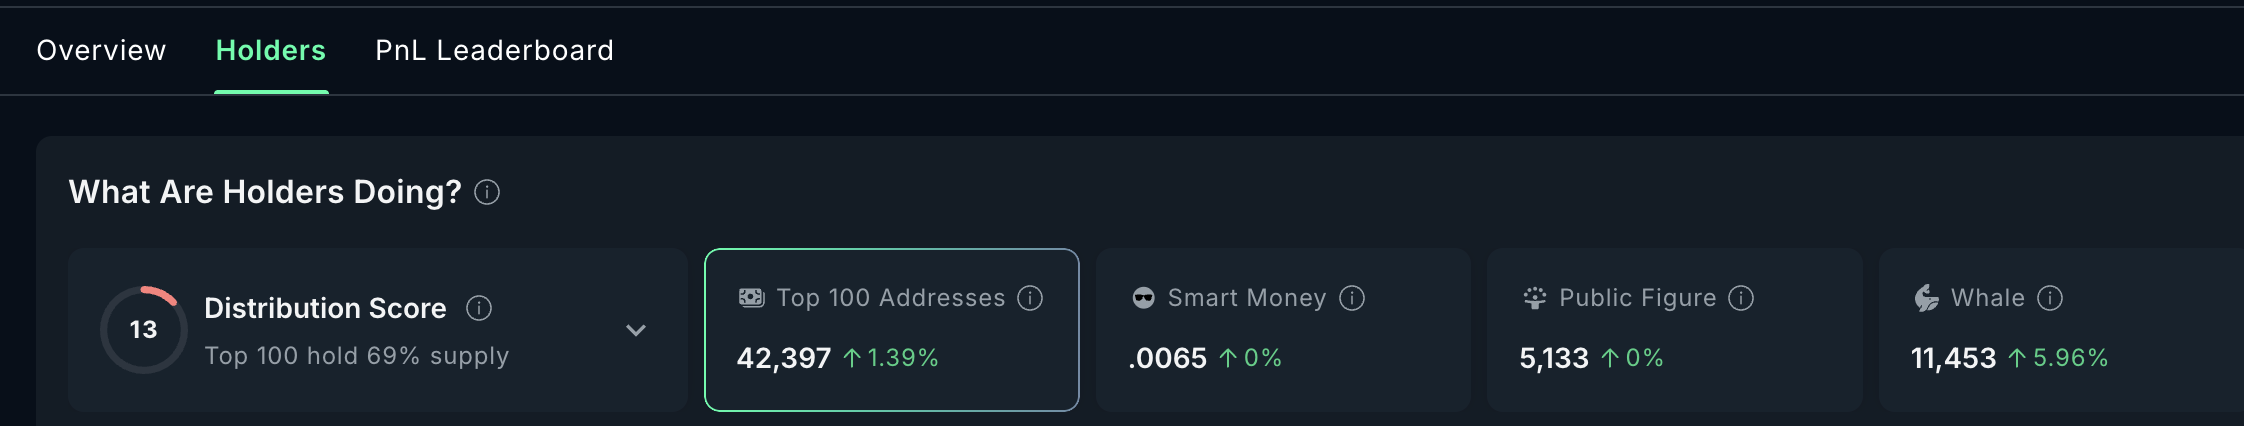
On-chain holder data adds more nuance. Over the past 24 hours, whale and mega-whale addresses increased their holdings by roughly 5.96% and 1.39%, respectively. This accumulation likely explains why CMF is improving. Large holders appear willing to buy into weakness.
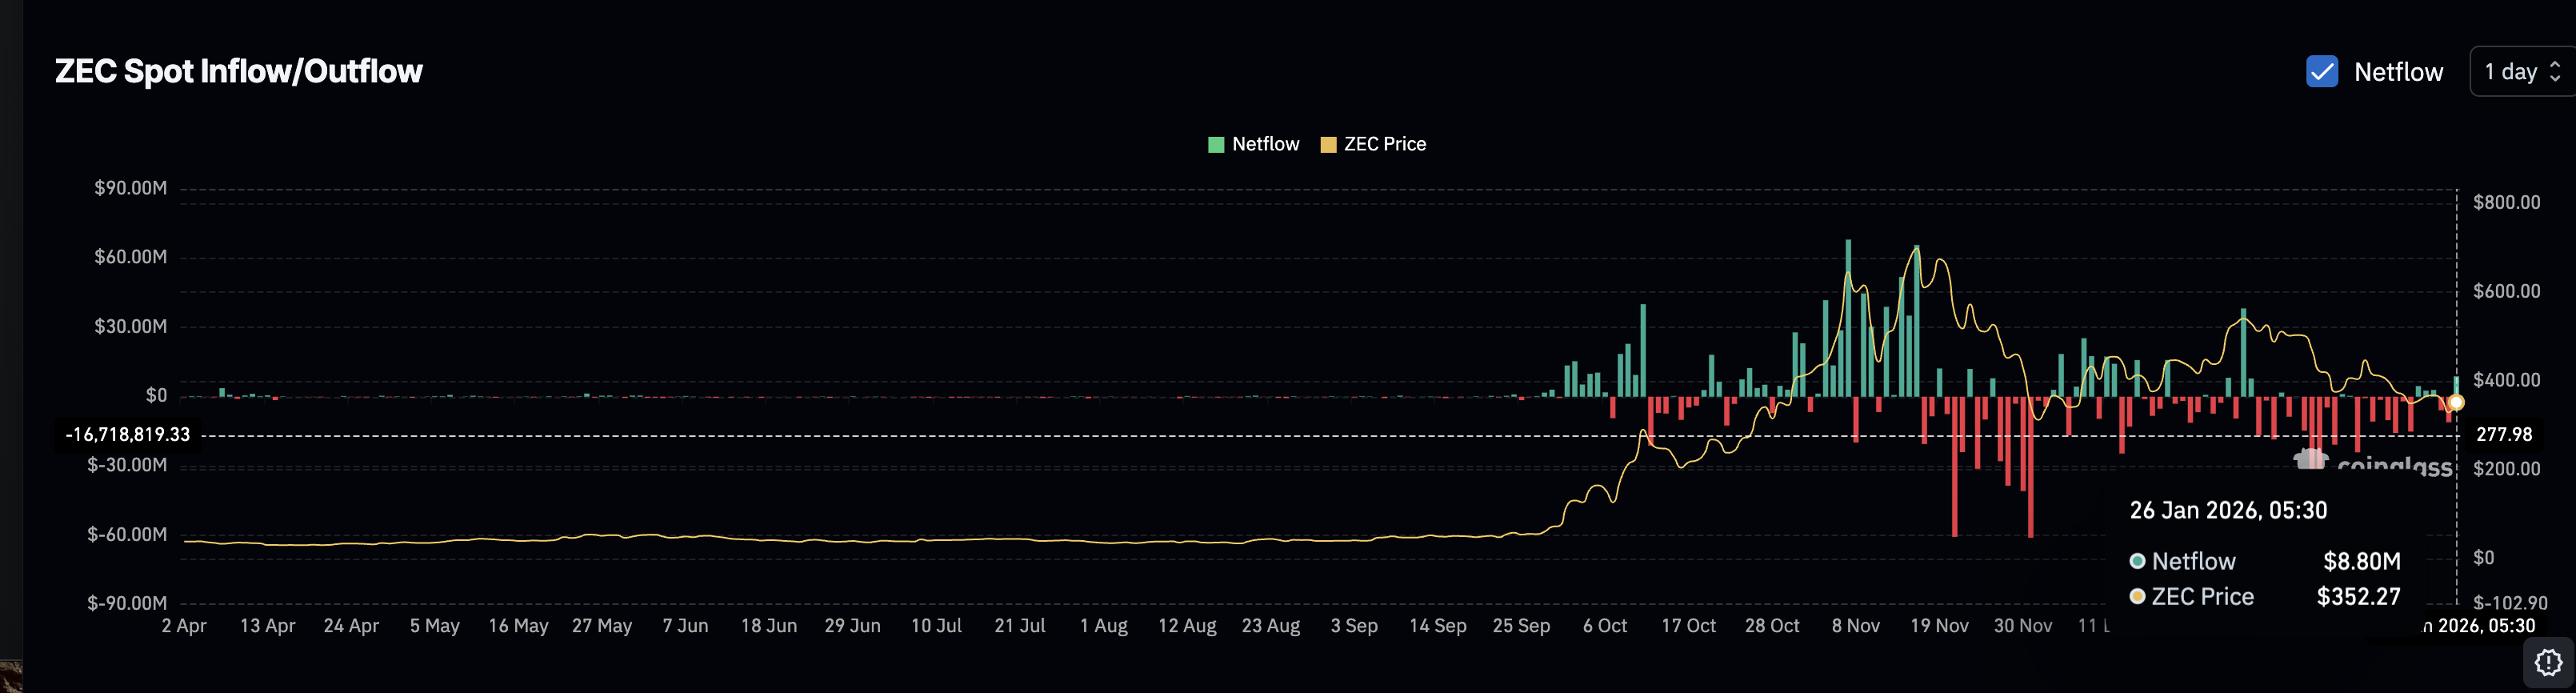
Retail behavior looks very different. Spot flow data shows that after a brief period of outflows, net inflows have returned during the rebound. In simple terms, when the price bounced nearly 9% from yesterday’s low, selling pressure increased to almost $9 million. That suggests many participants, possibly retail, are using bounces to reduce exposure rather than add to it.
This split explains the mixed signals. Whales are supporting the ZEC price at the margin, while retail remains cautious and opportunistic on rallies.
MFI Shows Dip Buying Still Exists, But Zcash Price Structure Sets the Rules
The Money Flow Index, or MFI, helps clarify this contradiction. MFI tracks buying and selling pressure using both price and volume.
Between January 14 and January 25, the ZEC price trended lower, but the MFI trended higher. This bullish divergence shows that dip buying has been present even as the price declined. It helps explain why ZEC has not seen a straight-line breakdown despite the bearish structure. Based on previous charts and metrics, ‘Dip Buying’ is possibly due to the whales.
Still, dip buying momentum alone cannot override structure forever. The price levels now matter more than indicators.
On the downside, the $326 area is critical. This level aligns with a major Fibonacci retracement and has acted as a temporary floor. A clean break below $326 would likely accelerate the move toward $266, the main breakdown target. If selling pressure intensifies, even $250 could come into view.
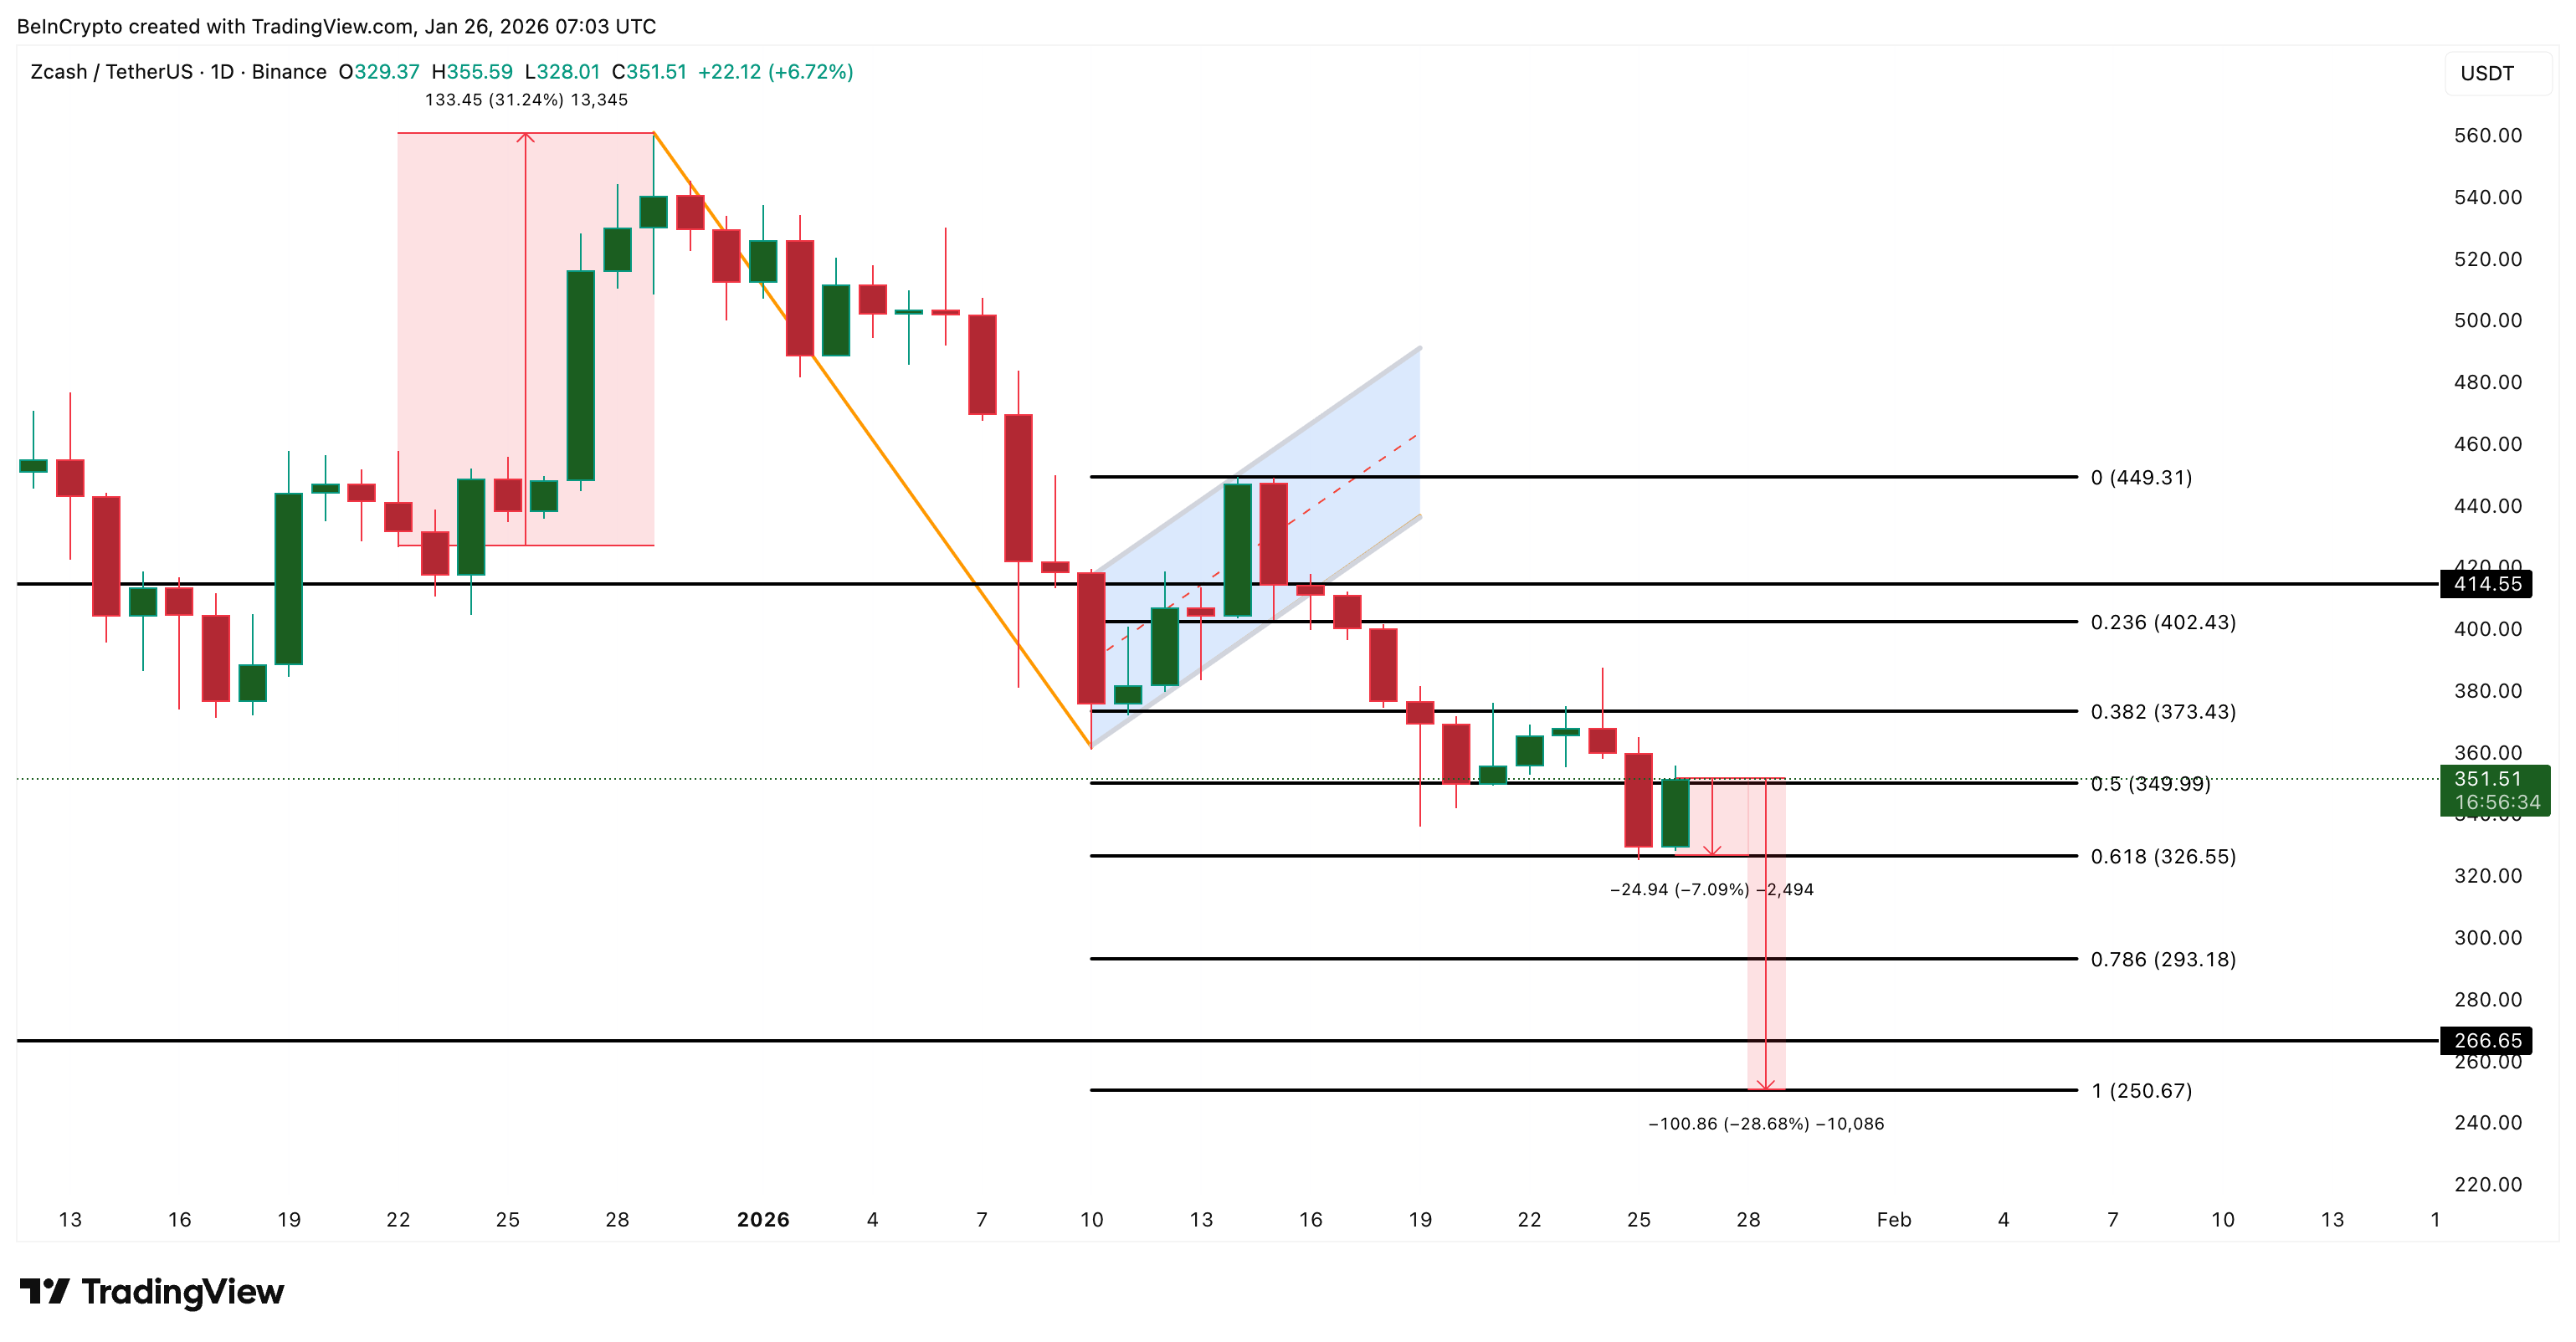
On the upside, the Zcash price must first reclaim $402.
That level marks former support and near-term resistance. Above that, $449 becomes the key zone. A move above $449 would invalidate much of the bearish structure and signal that the breakdown path is losing relevance.
The post Zcash Price on a 35% Breakdown Path? Yet One Group Remains Optimistic appeared first on BeInCrypto.