
Bitcoin is down just over 1% in the past 24 hours, but the bigger story is not the daily move. Over the weekend, the Bitcoin price came dangerously close to confirming a bearish breakdown before staging a short-term rebound.
A technical signal had been building for days, and on-chain data now shows that selling pressure is easing. Still, major risks remain. Whether Bitcoin stabilizes or slides toward $78,000 now depends on how the BTC price reacts at several key levels.
Rebound Emerges as Selling Pressure Fades Near Breakdown Zone
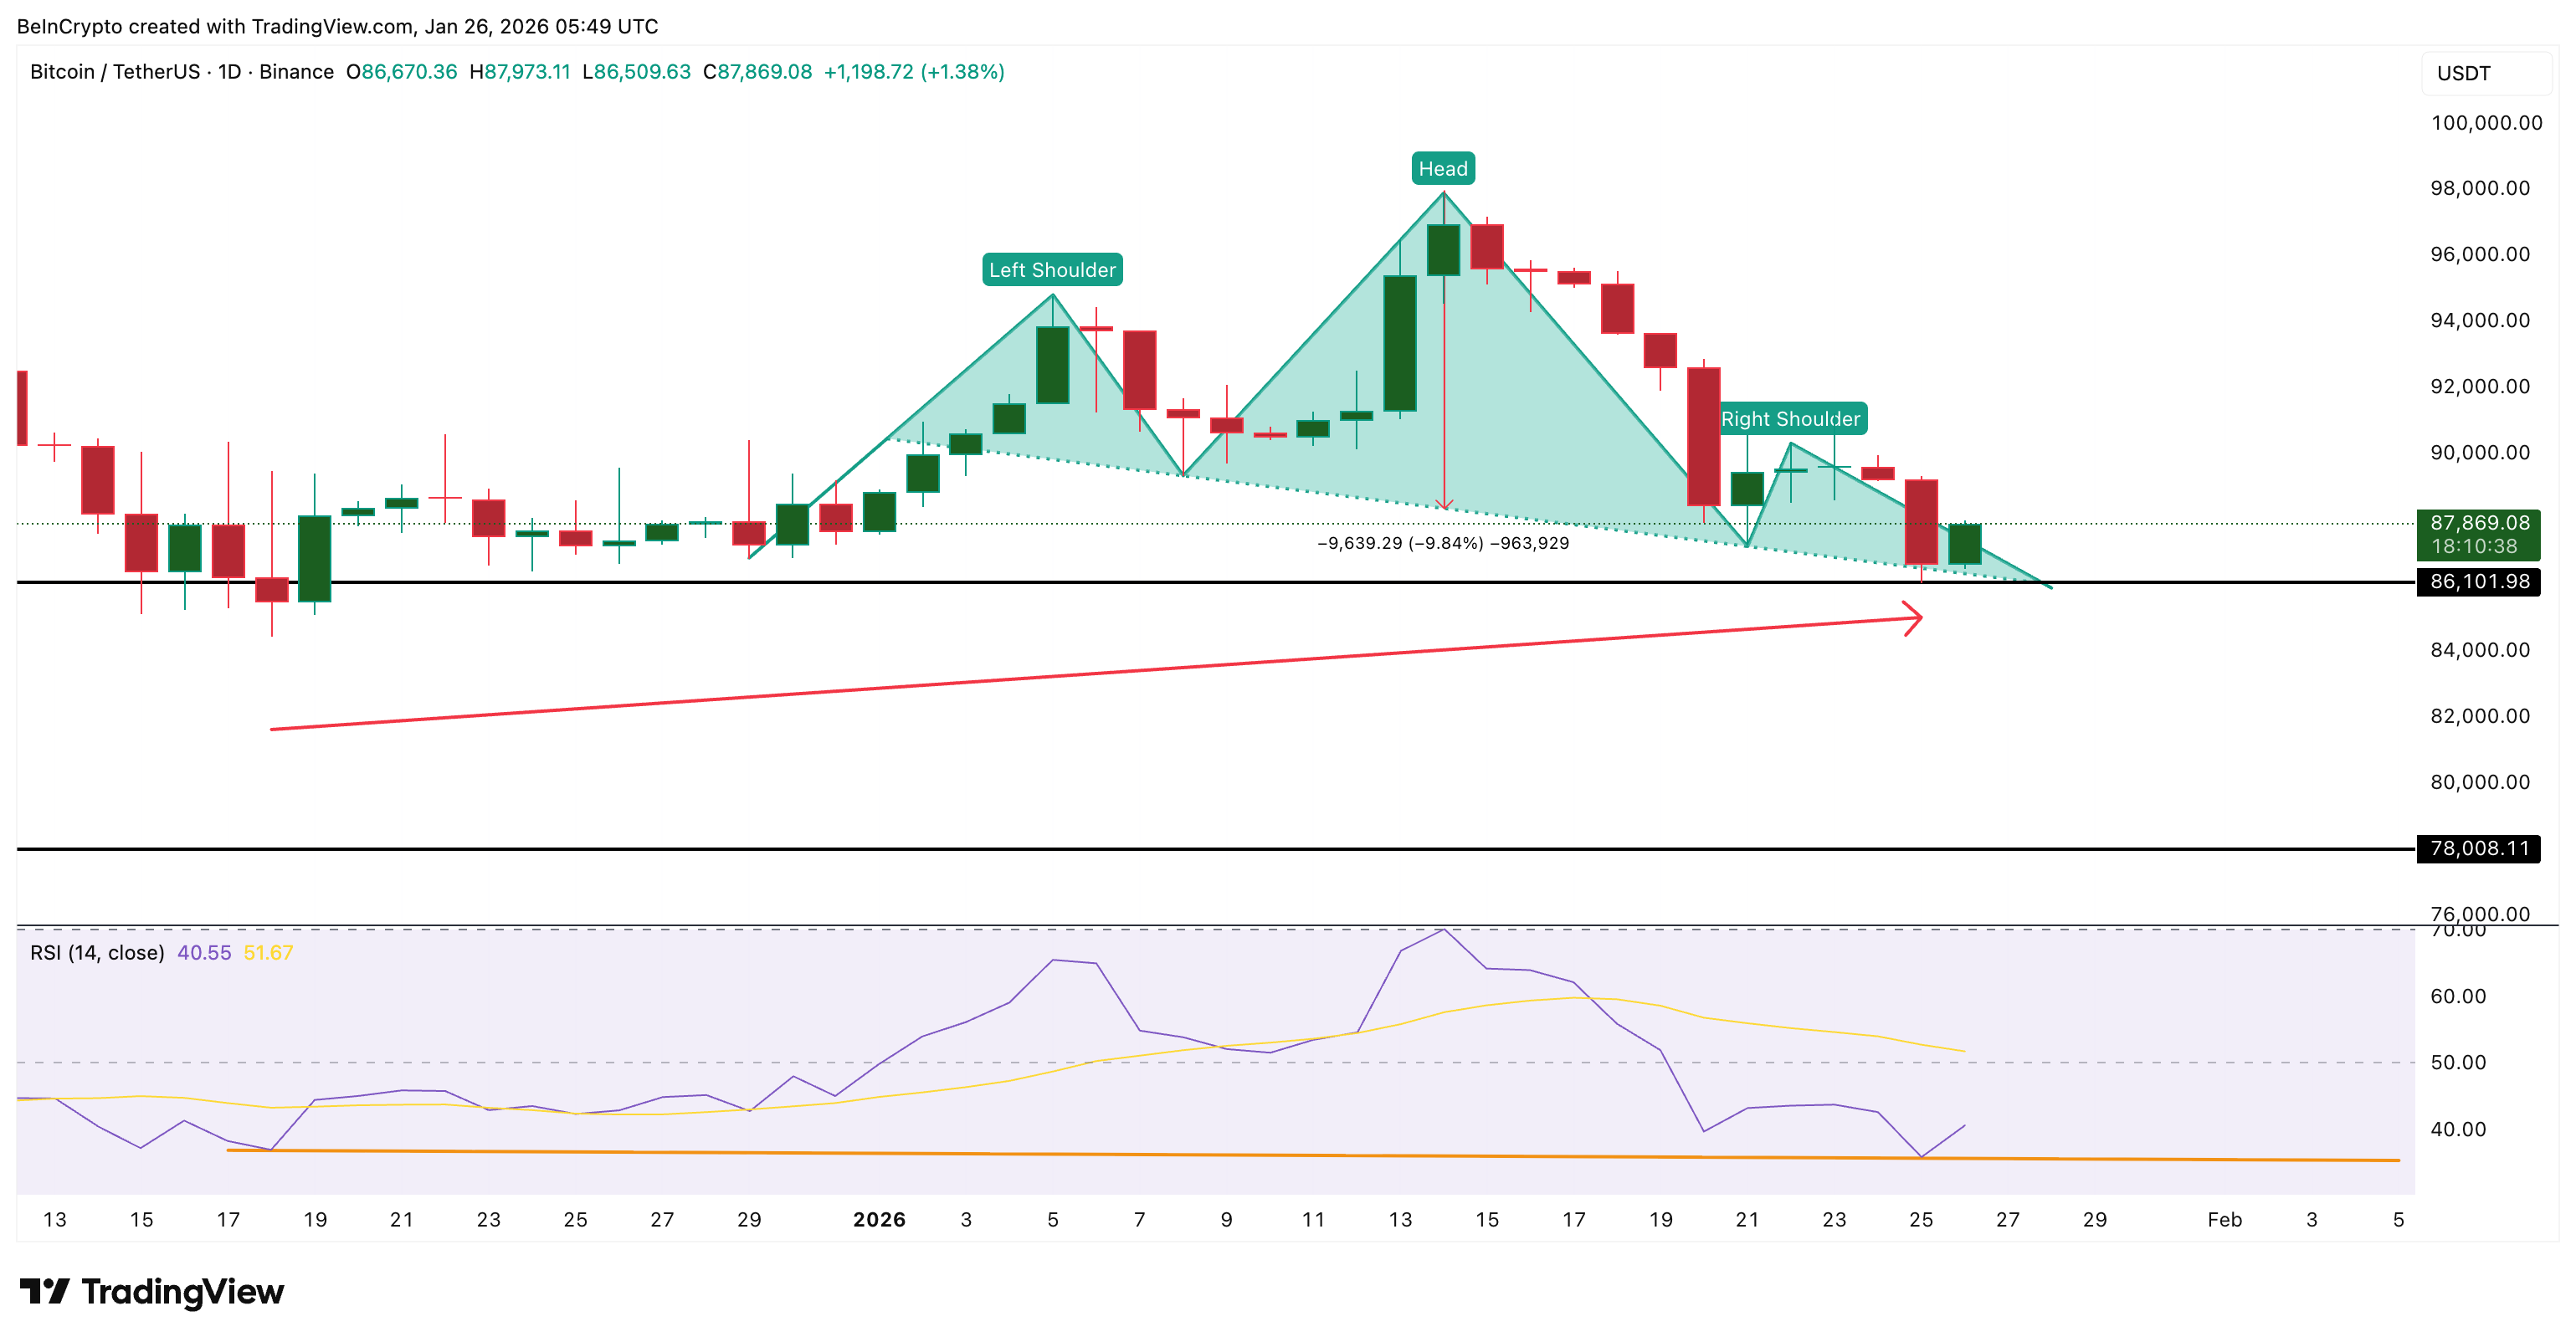
Bitcoin is still trading inside a head-and-shoulders pattern on the daily chart. This pattern often signals a bearish reversal once the price breaks below the neckline.
For Bitcoin, that neckline sits near the $86,100 zone. On January 25, BTC briefly dipped into this area before rebounding. A clean daily close below this zone would activate a projected downside move of roughly 10%.
The rebound, however, was supported by a key momentum signal.
Between December 18 and January 25, Bitcoin’s price formed a higher low while the Relative Strength Index, or RSI, formed a lower low. RSI measures momentum by comparing recent gains to losses. When price holds up while RSI weakens, it often signals that selling pressure is slowing. This is known as a hidden bullish divergence and typically precedes short-term rebounds rather than trend reversals.
Want more token insights like this? Sign up for Editor Harsh Notariya’s Daily Crypto Newsletter here.
On-chain data confirms this cooling sell pressure.
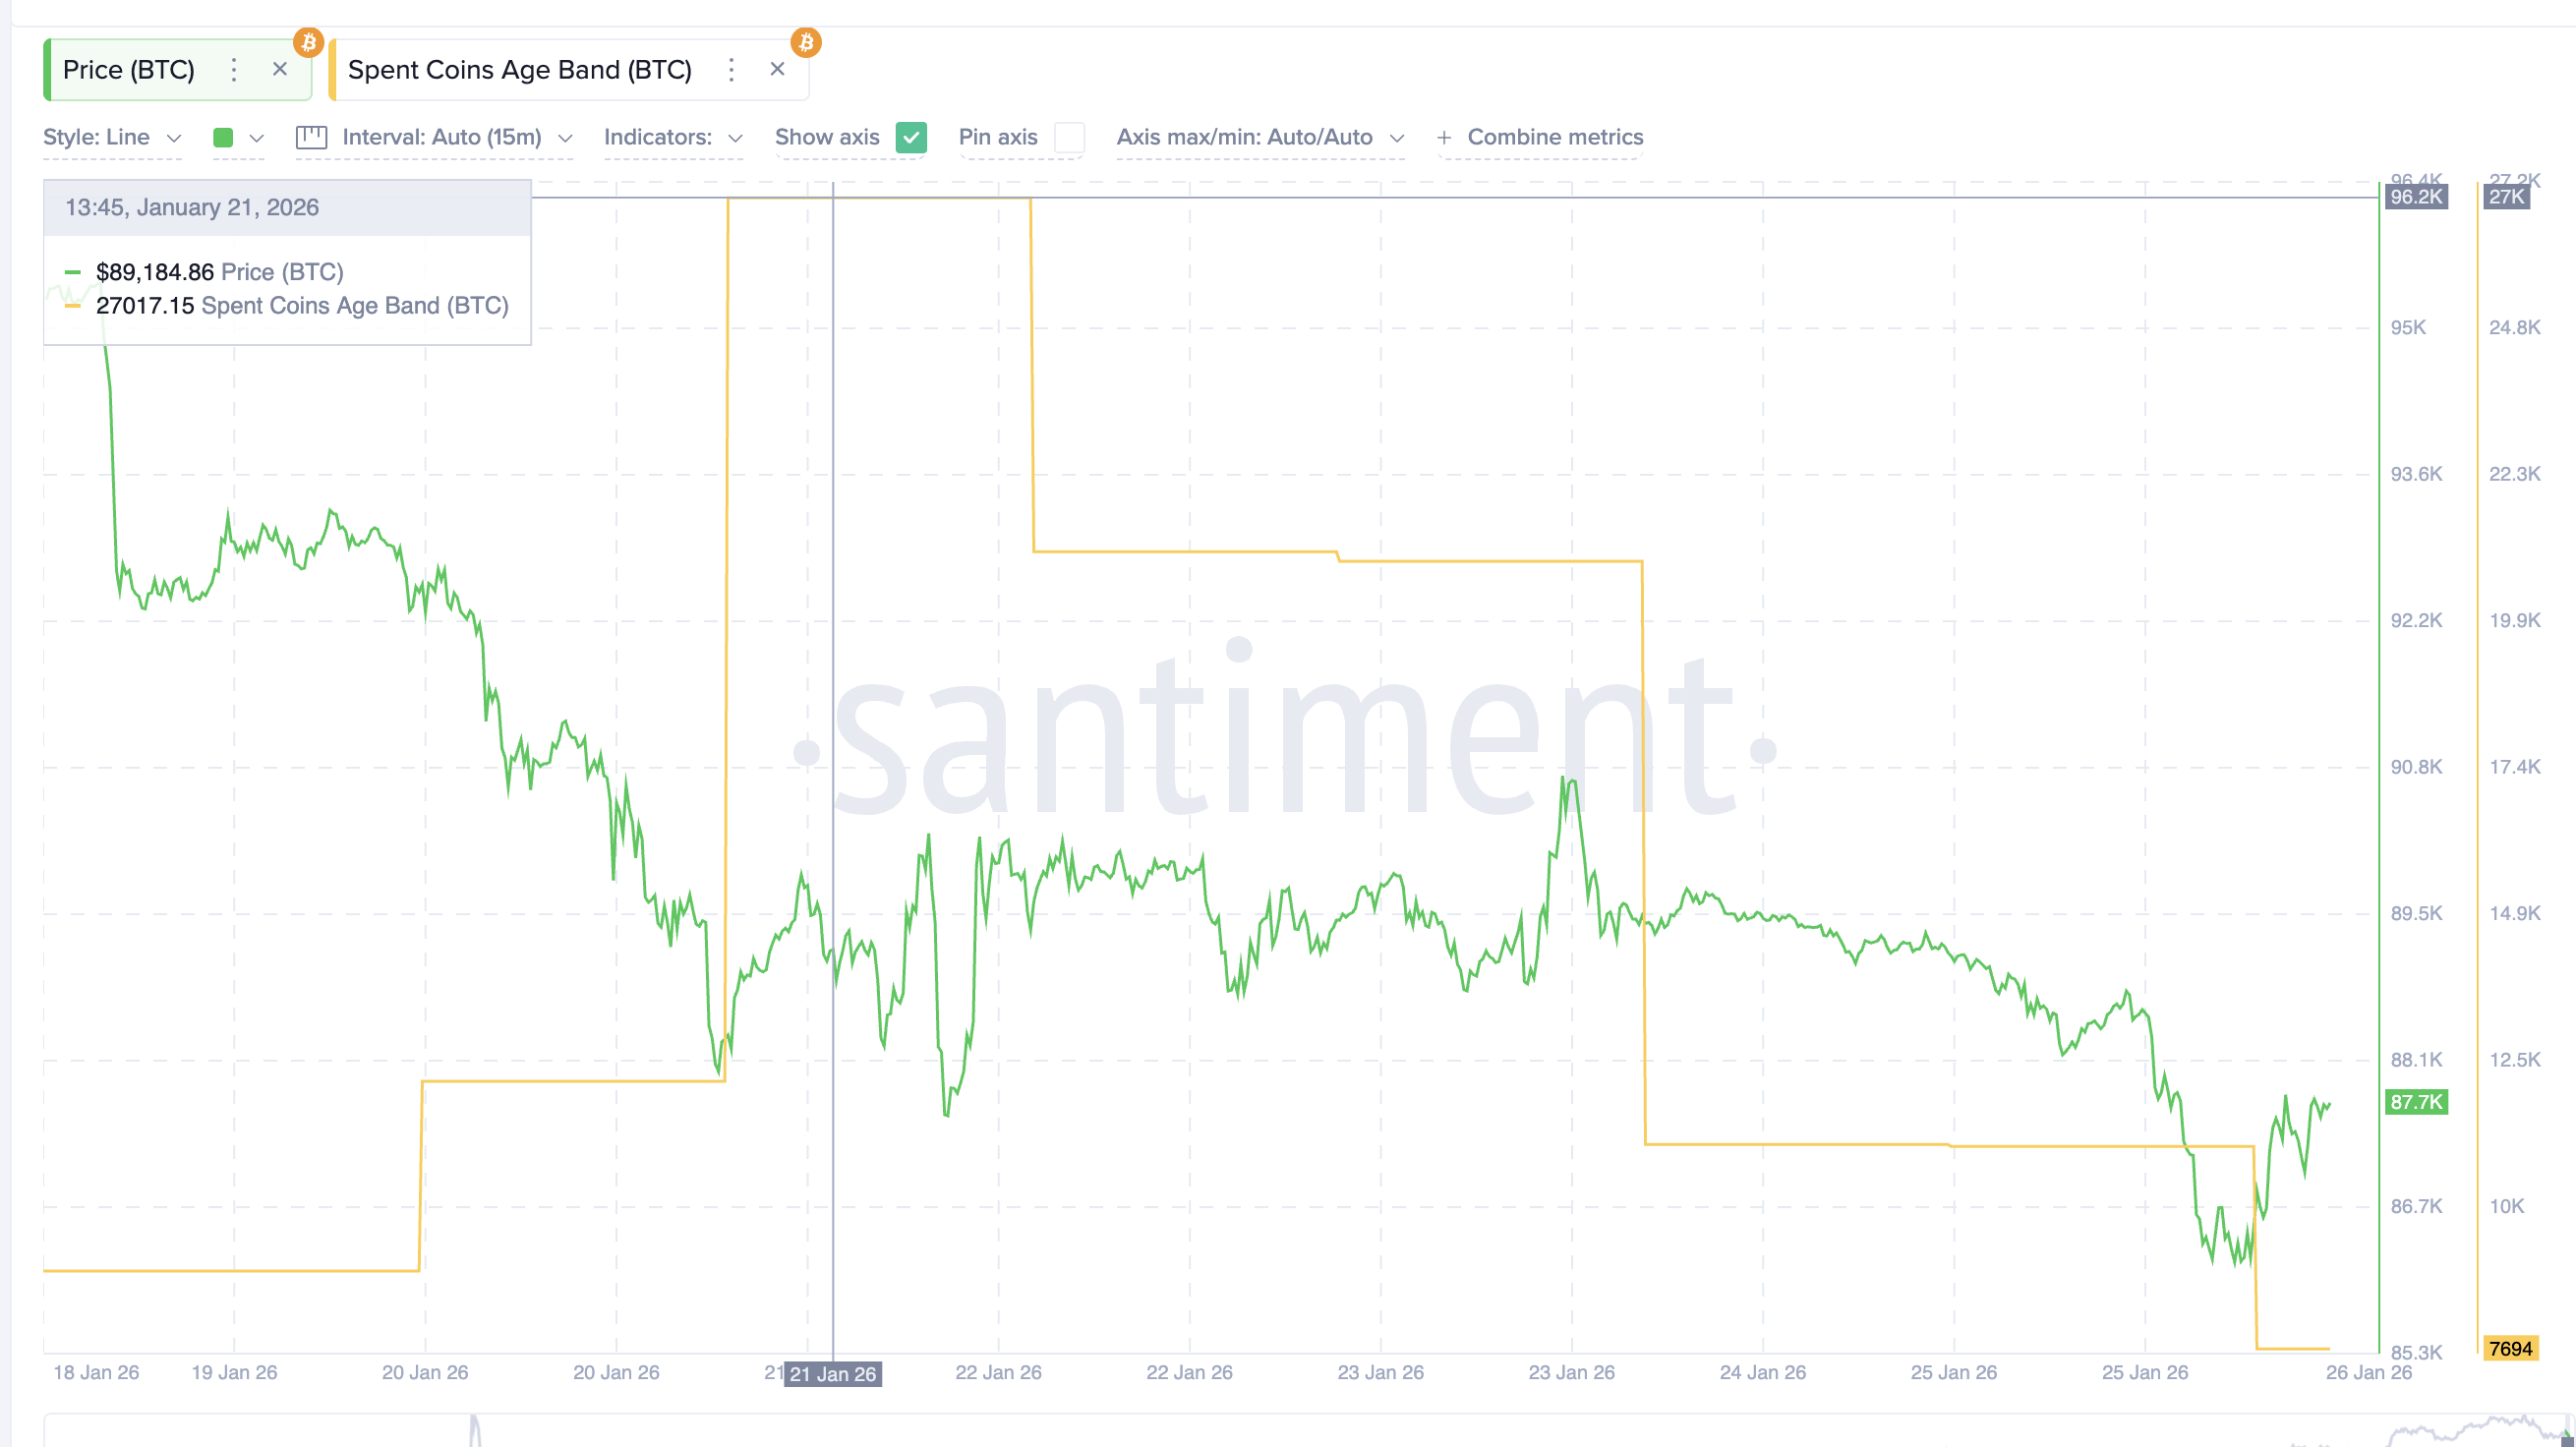
The Spent Coins Age Band, which tracks how many coins of all holding ages are being moved on-chain, has dropped sharply. Coin movement fell from roughly 27,000 to almost 7,690, a decline of about 72%. When fewer coins move, it usually means fewer holders are selling. This aligns closely with the RSI signal and explains why the Bitcoin price bounced rather than breaking down immediately.
But easing sell pressure alone does not guarantee safety for this Bitcoin price prediction. That leads directly to the next risk layer.
ETF Outflows and Paper Profits Show Downside Risk Has Not Cleared
While sellers appear to be tiring, buyers are not stepping in with conviction.
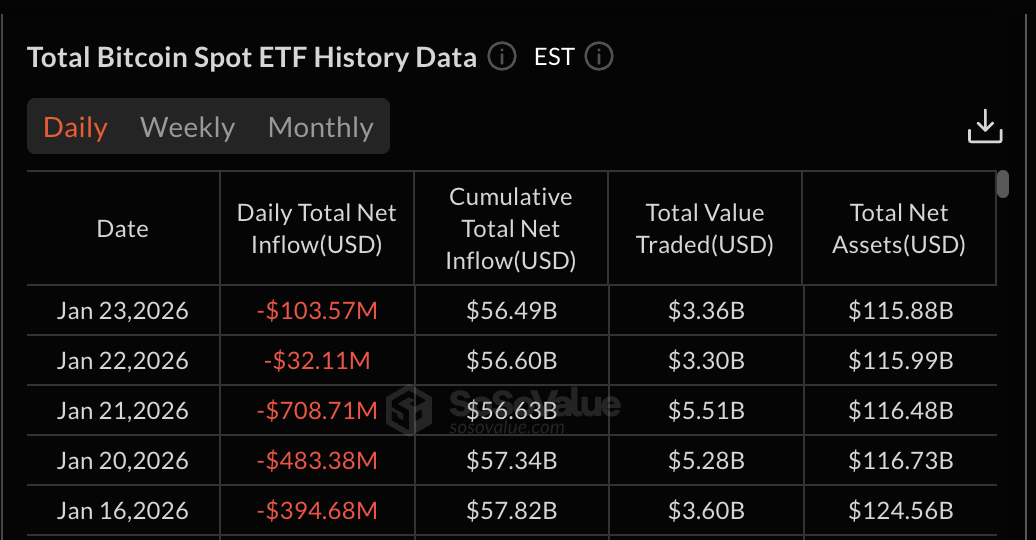
Bitcoin spot ETFs have recorded daily net outflows for multiple consecutive sessions. Persistent outflows suggest institutional demand remains weak. Historically, rebounds that occur without ETF support tend to stall rather than expand into sustained rallies.
Profit dynamics also remain unfavorable.
The Net Unrealized Profit/Loss (NUPL) metric measures how much profit or loss holders are sitting on, on average. A higher reading means more holders are in profit and may be tempted to sell. Bitcoin’s NUPL currently sits near 0.35, still way above the capitulation zone.
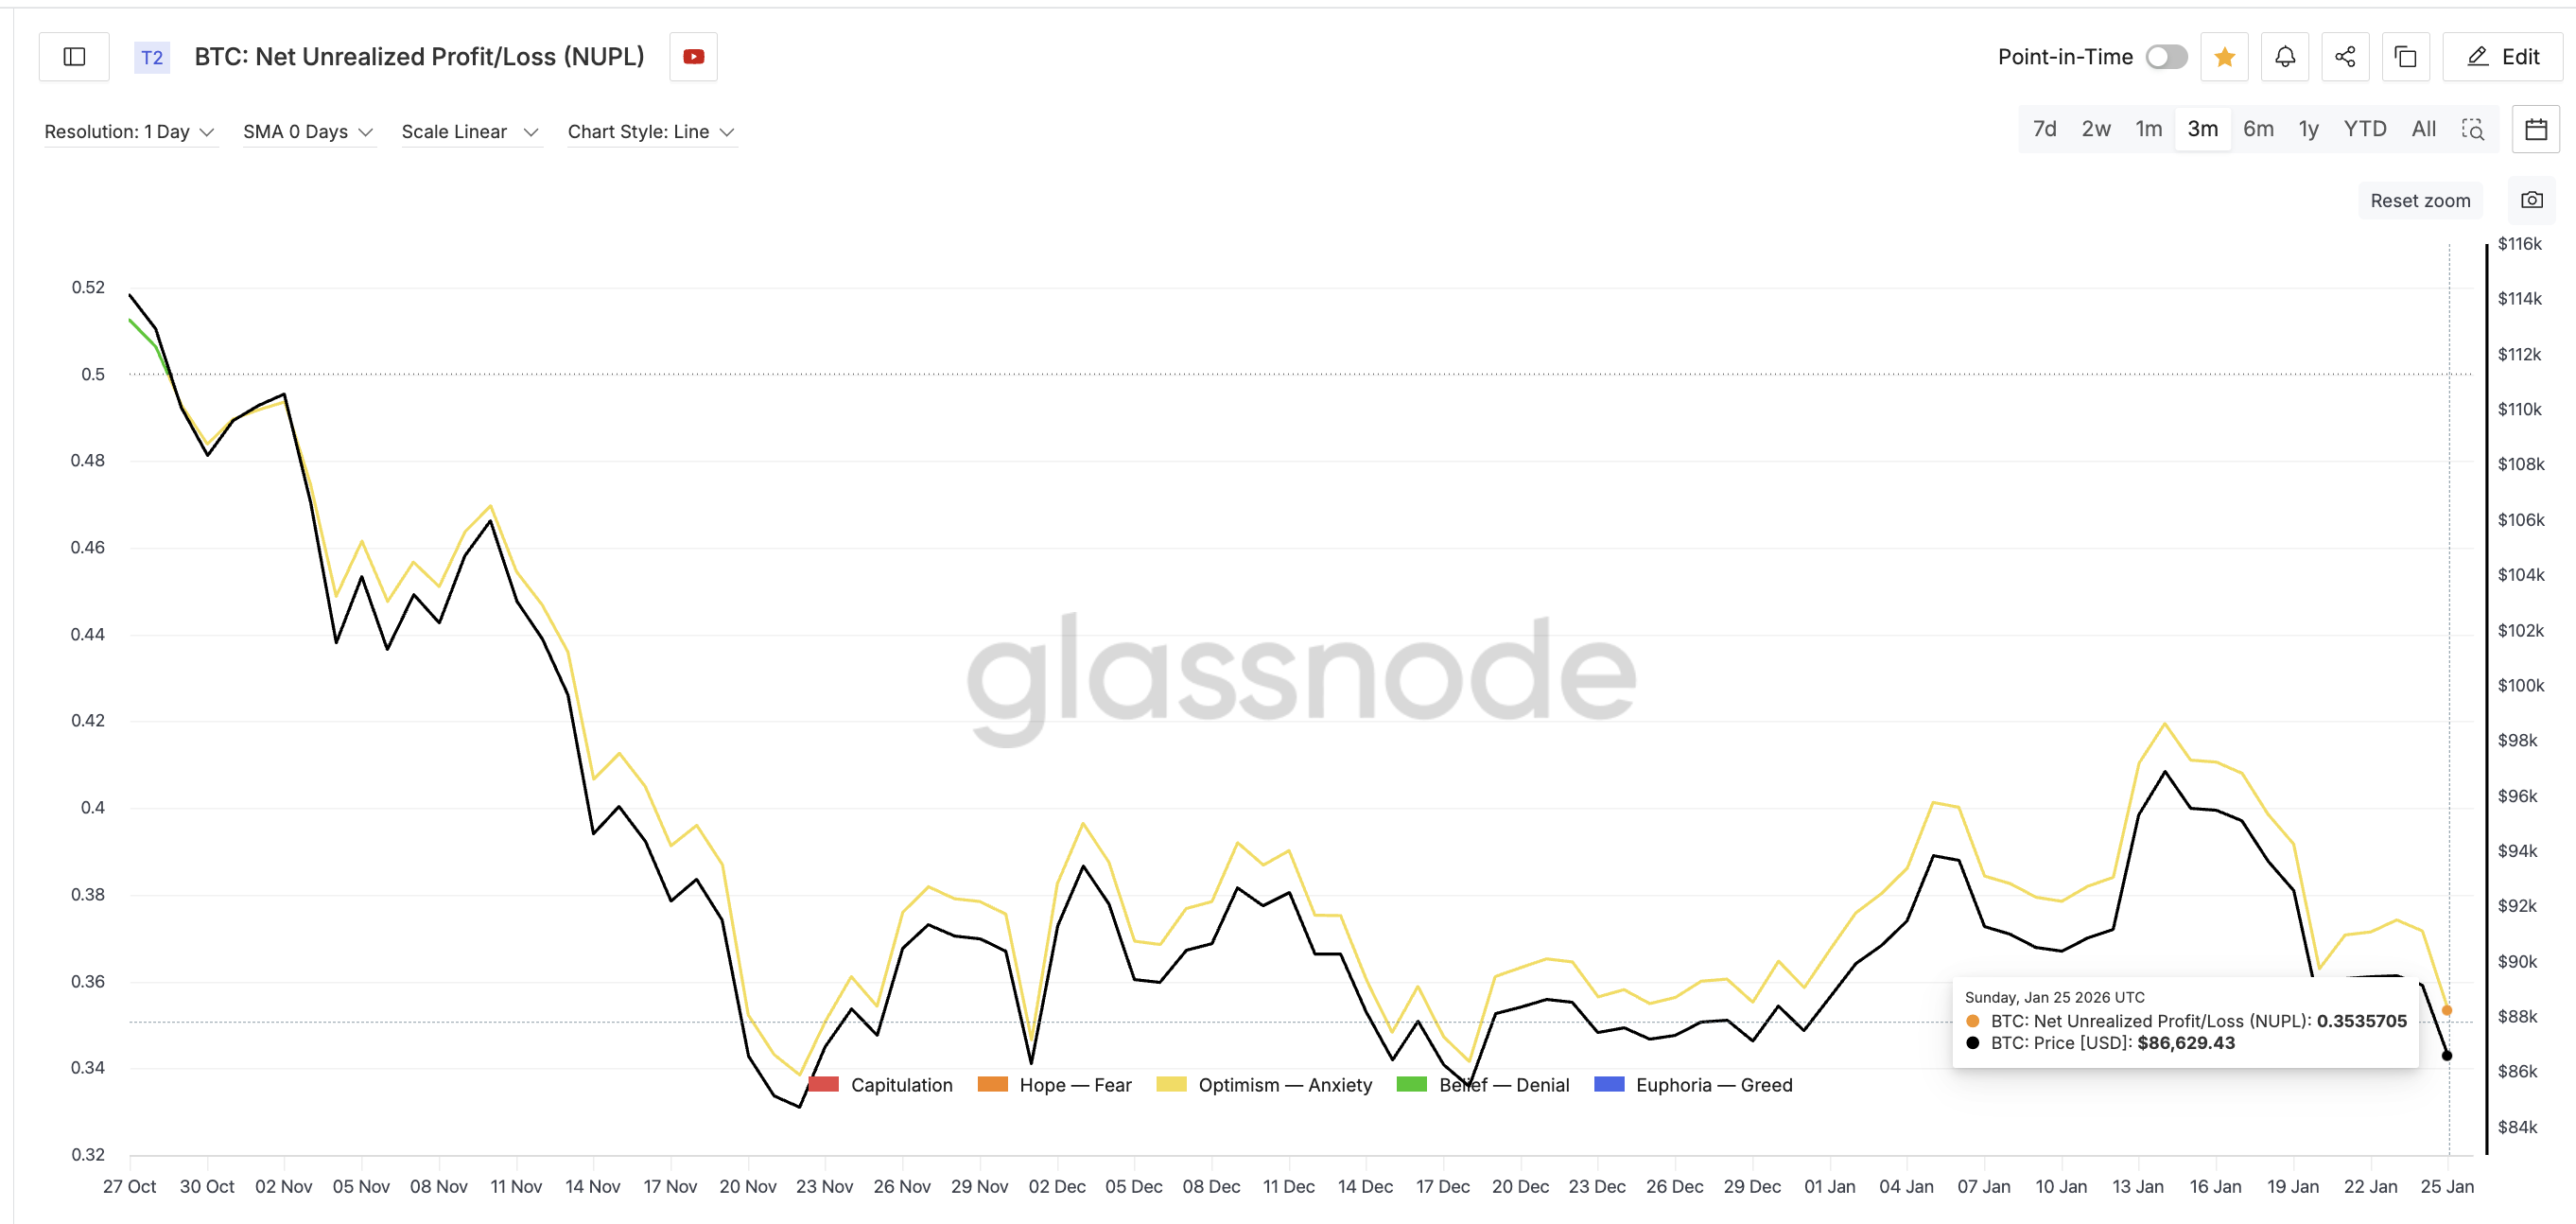
Previous local bottoms formed when NUPL fell closer to 0.33–0.34, notably in late November and mid-December. Since NUPL is still above those levels, it suggests some profit-taking pressure may remain before a durable bottom forms.
Crypto analytics firm Alphractal also highlights the NUPL concern for BTC:
In simple terms, sellers may be slowing down, but they are not done. This makes the next resistance zones especially important.
Cost-Basis Walls Explain The Bitcoin Price Prediction
To understand how far this BTC price rebound can go, cost-basis data provides clarity.
A cost-basis heatmap shows price levels where large amounts of Bitcoin were previously bought. These zones often act as resistance because holders sell when the BTC price returns to their break-even levels.
The strongest overhead wall sits between $90,168 and $90,591, with a heavy concentration around $90,550, a level highlighted on the price chart. This is the first major barrier the rebound must clear.
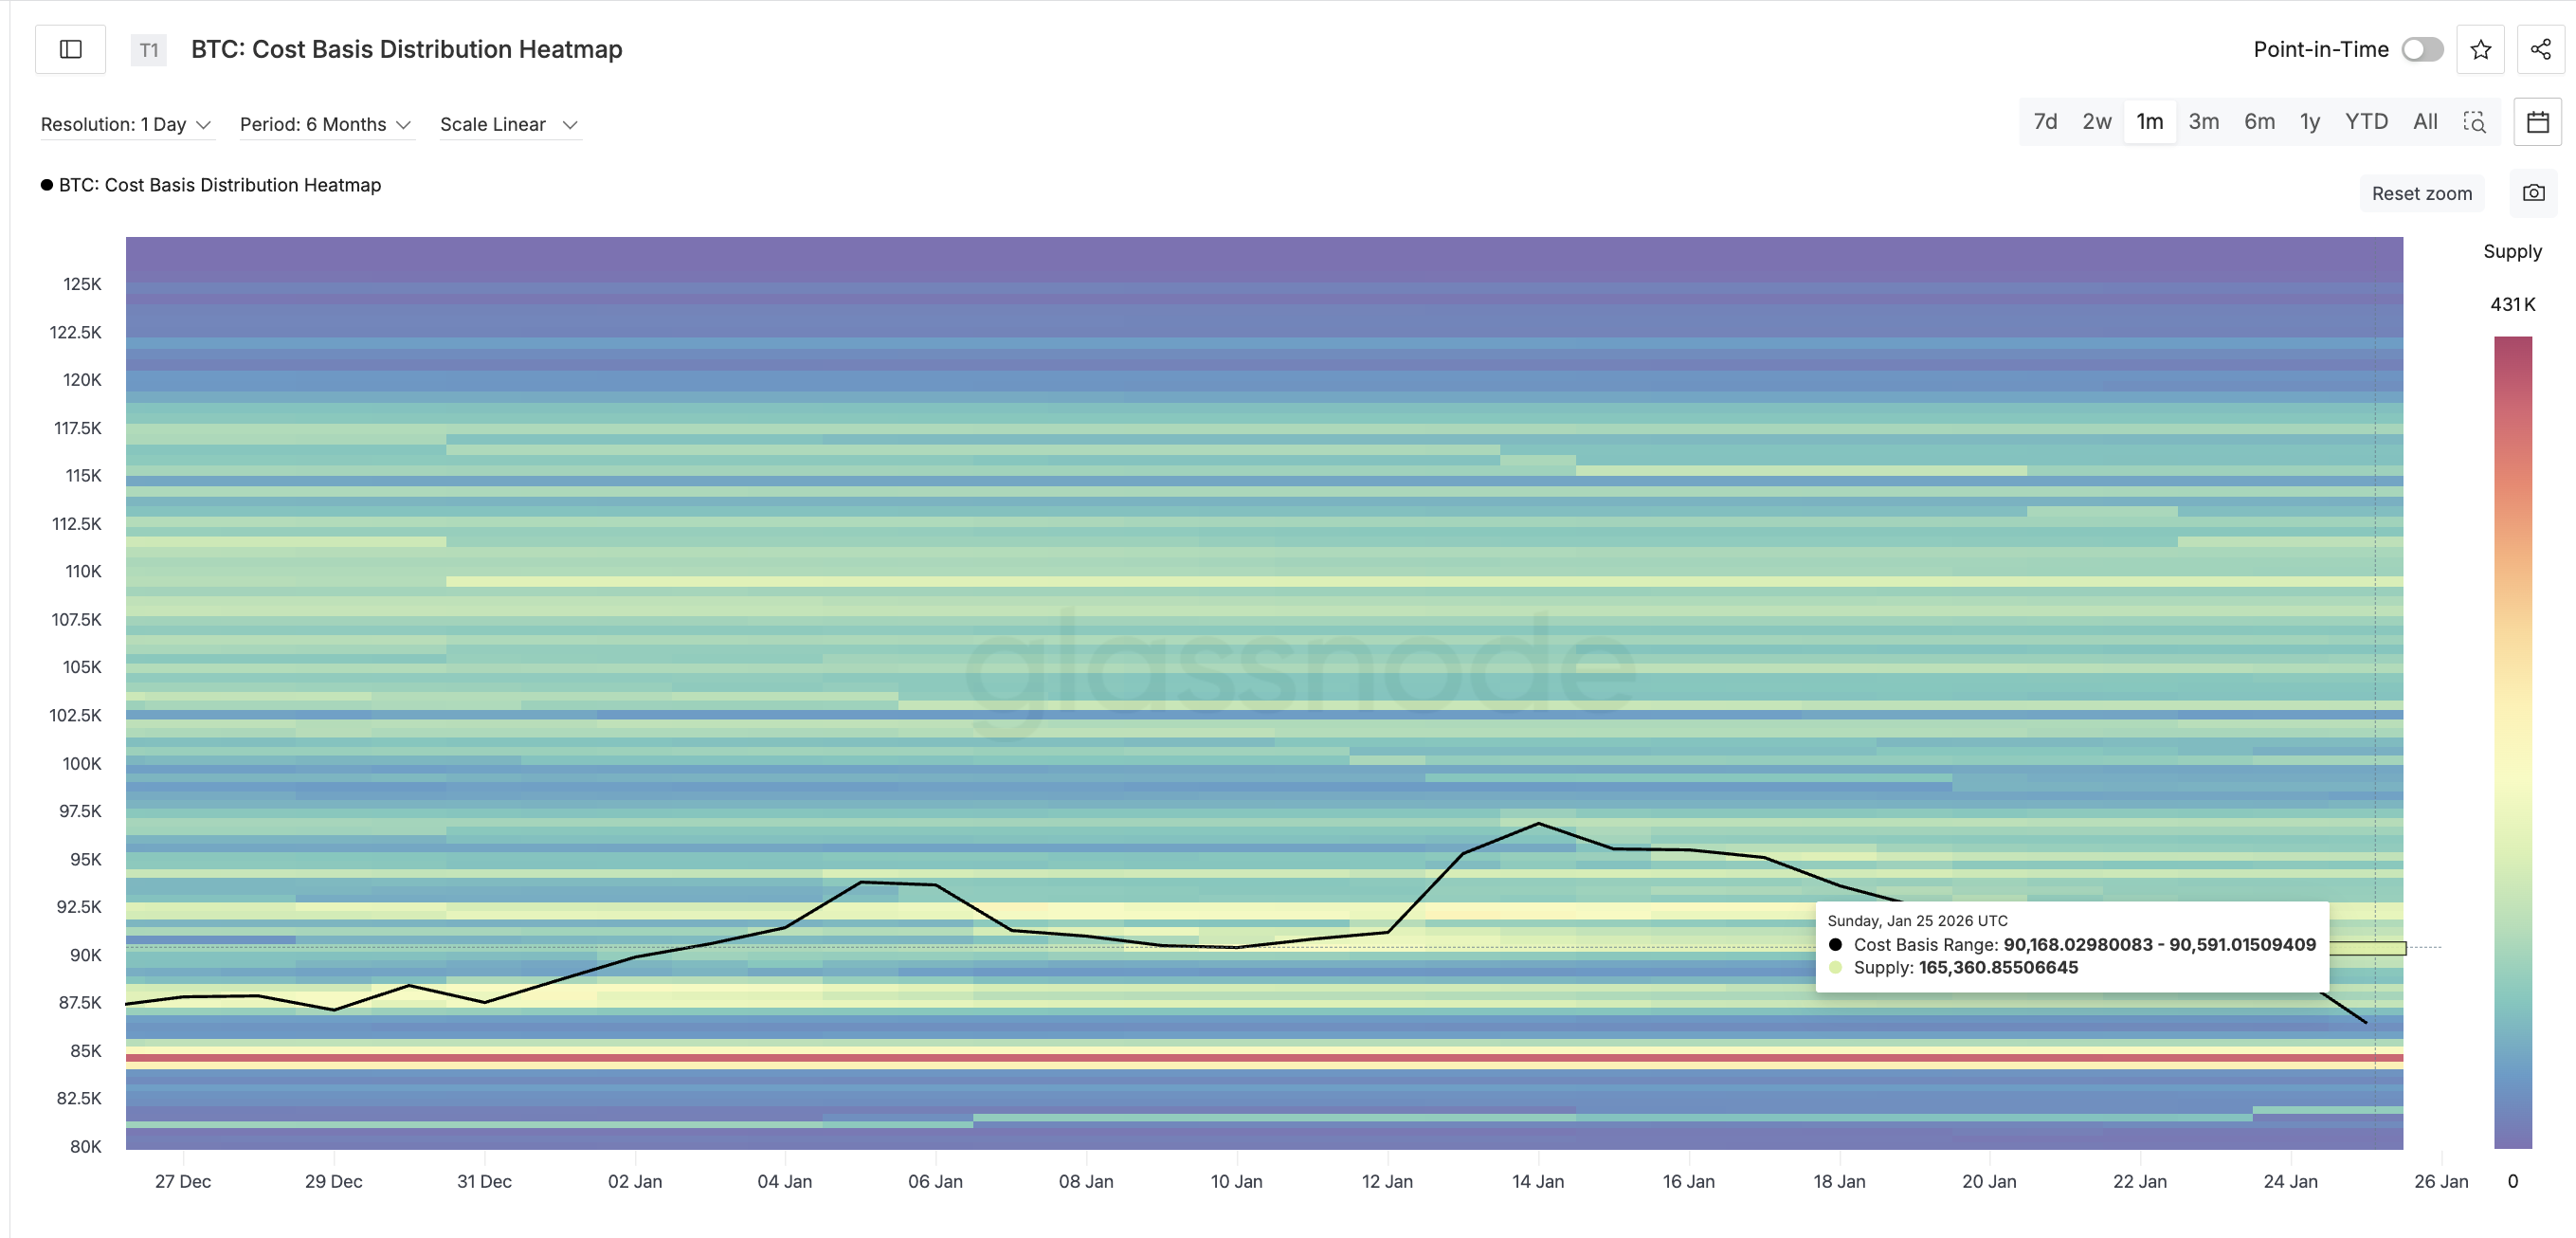
If Bitcoin moves above $90,550, the next critical level is $91,210. A reclaim of this level would break the right shoulder of the head-and-shoulders pattern (previously highlighted) and significantly weaken the bearish setup.
However, the broader structure only turns neutral if Bitcoin can reclaim the $97,930 region. Until then, the pattern remains vulnerable.
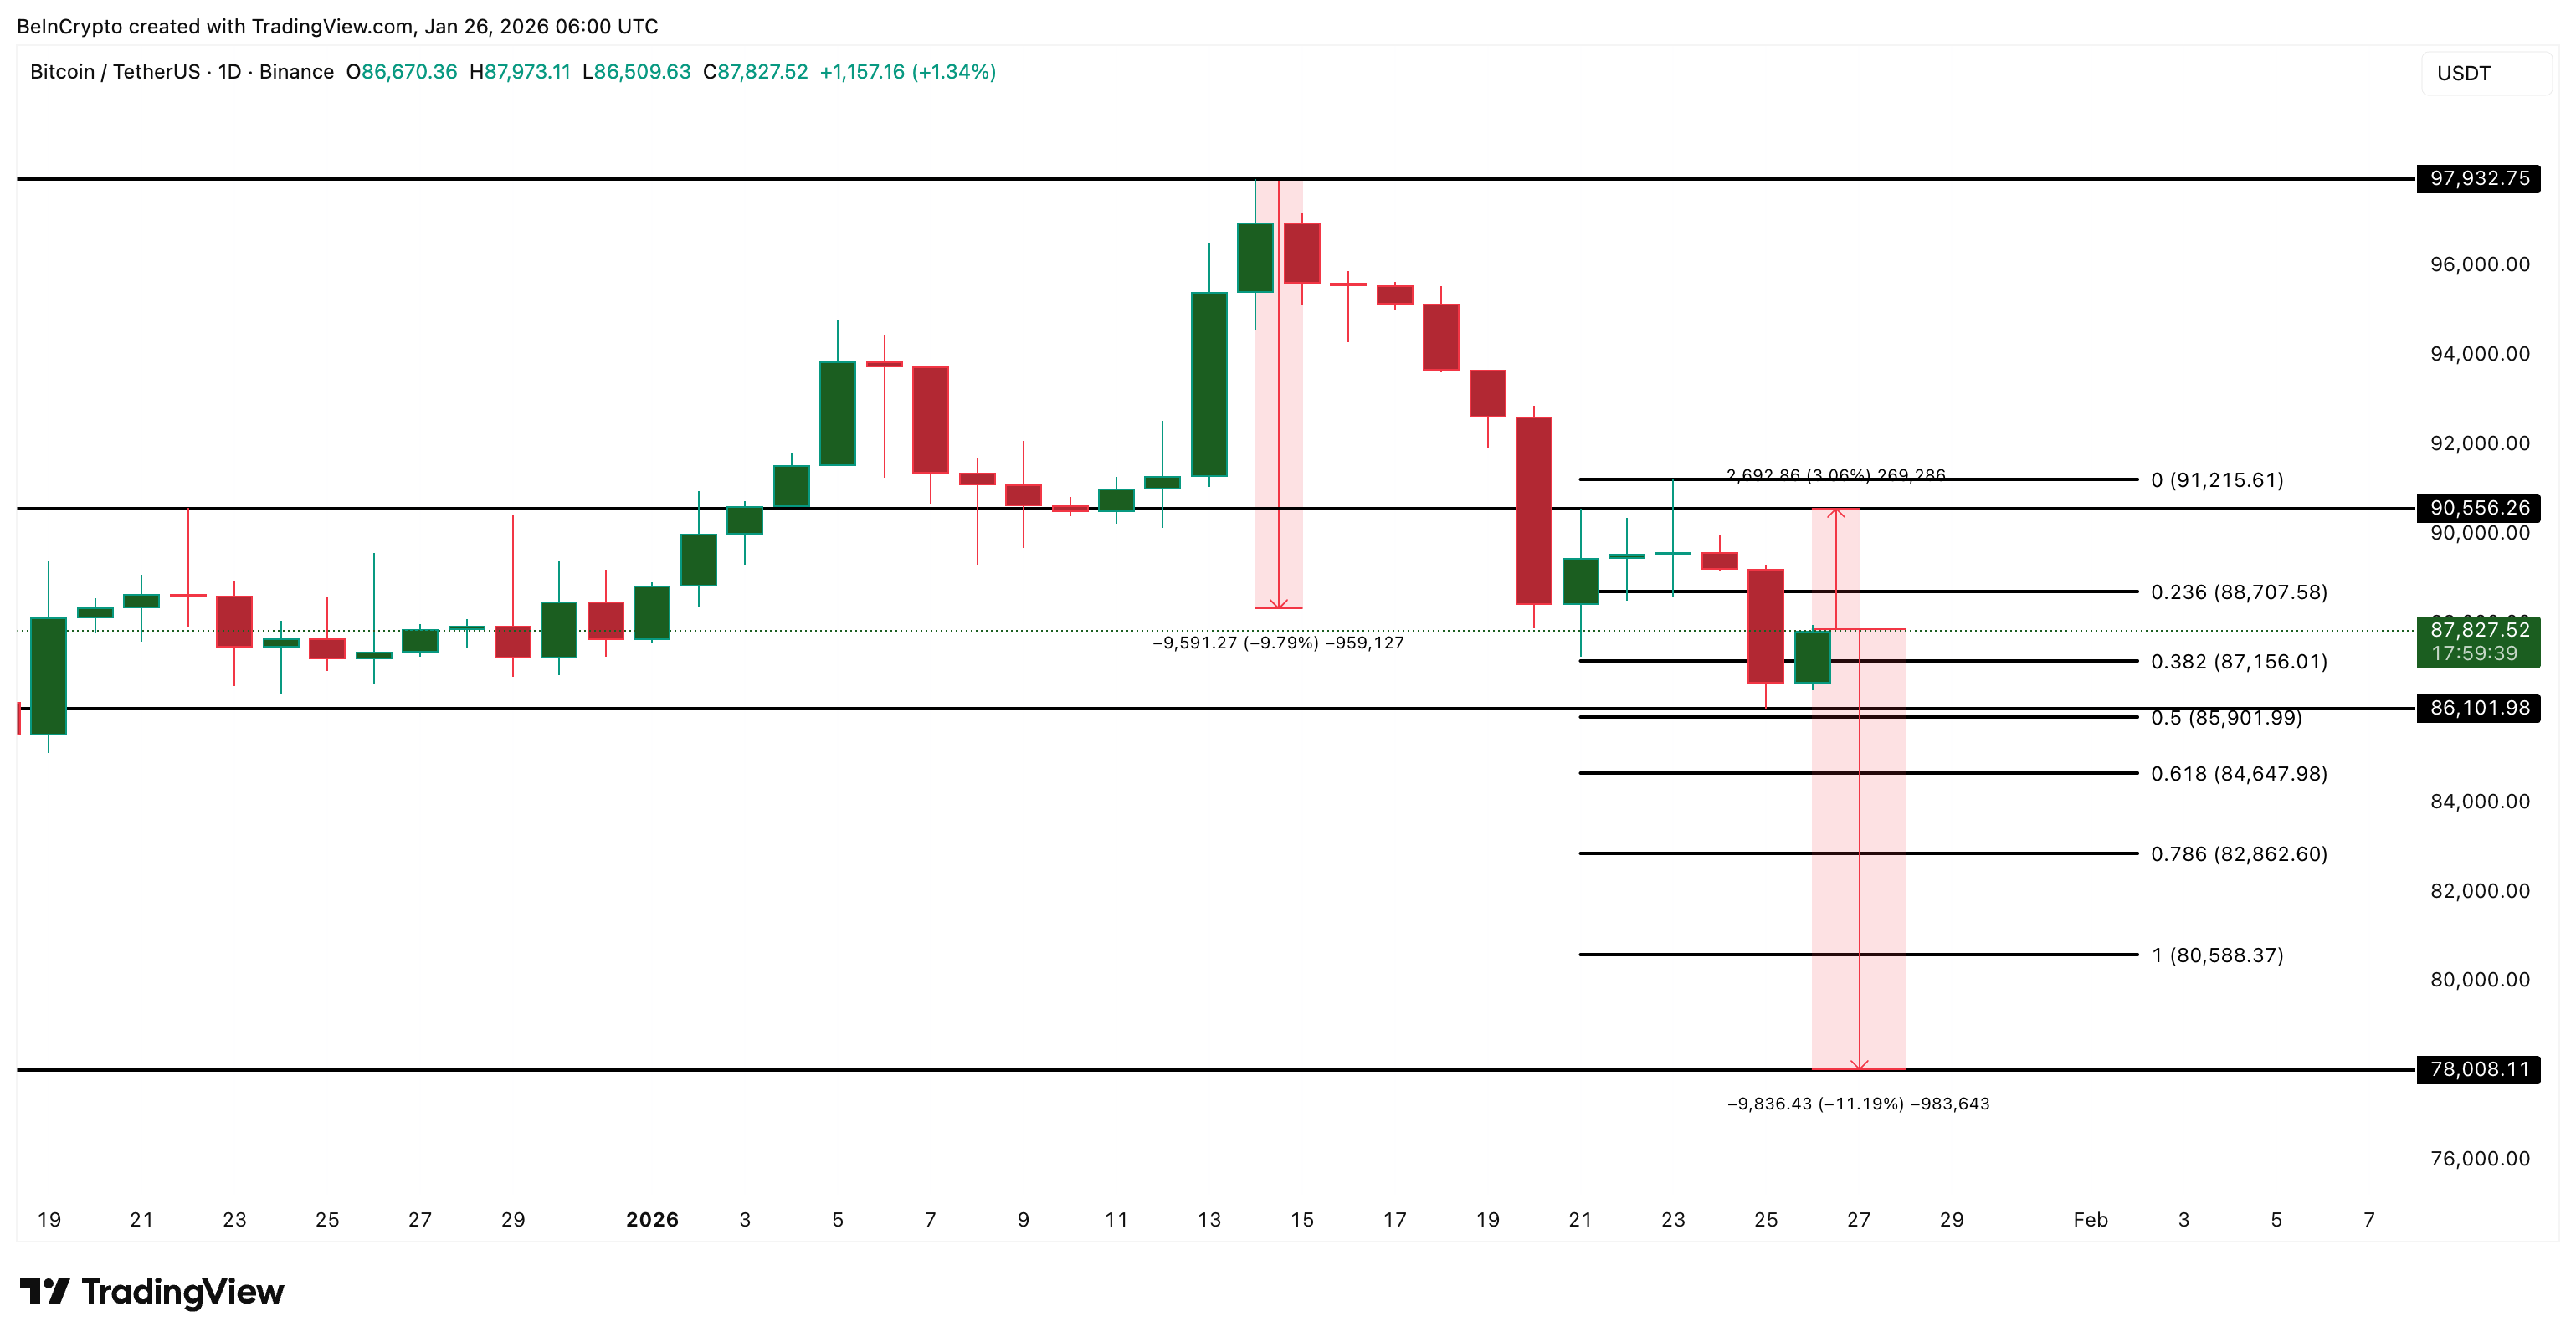
On the downside, the Bitcoin price prediction risk remains clear. A daily close below $86,100–$85,900 would confirm the breakdown and reopen the path toward $78,000, aligning with the pattern’s full downside projection. That’s 10% from the neckline and over 11% from the current BTC price level.
The post Bitcoin Price Prediction Still Warns of $78,000 Risk — But Tiring Sellers Spark Bounce Hope appeared first on BeInCrypto.