
Solana (SOL) is trading at $87.29, down 0.31% on the day, as sellers continue to realize losses for the seventh consecutive week.
On-chain data shows a significant shift in exchange behavior since March 17. Holders who had been depositing SOL into exchanges for weeks are now withdrawing coins.
Solana Holders Continue To Face Losses
Net Realized Profit/Loss data from Glassnode shows consistent selling at the hands of the investors since February 17. Solana holders have been offloading their SOL at a loss throughout this period.
The only exception came around March 15 to 17, when SOL briefly climbed toward $97. Two small green bars appeared, showing brief profit-taking at the local high.
Want more token insights like this? Sign up for Editor Harsh Notariya’s Daily Crypto Newsletter here.
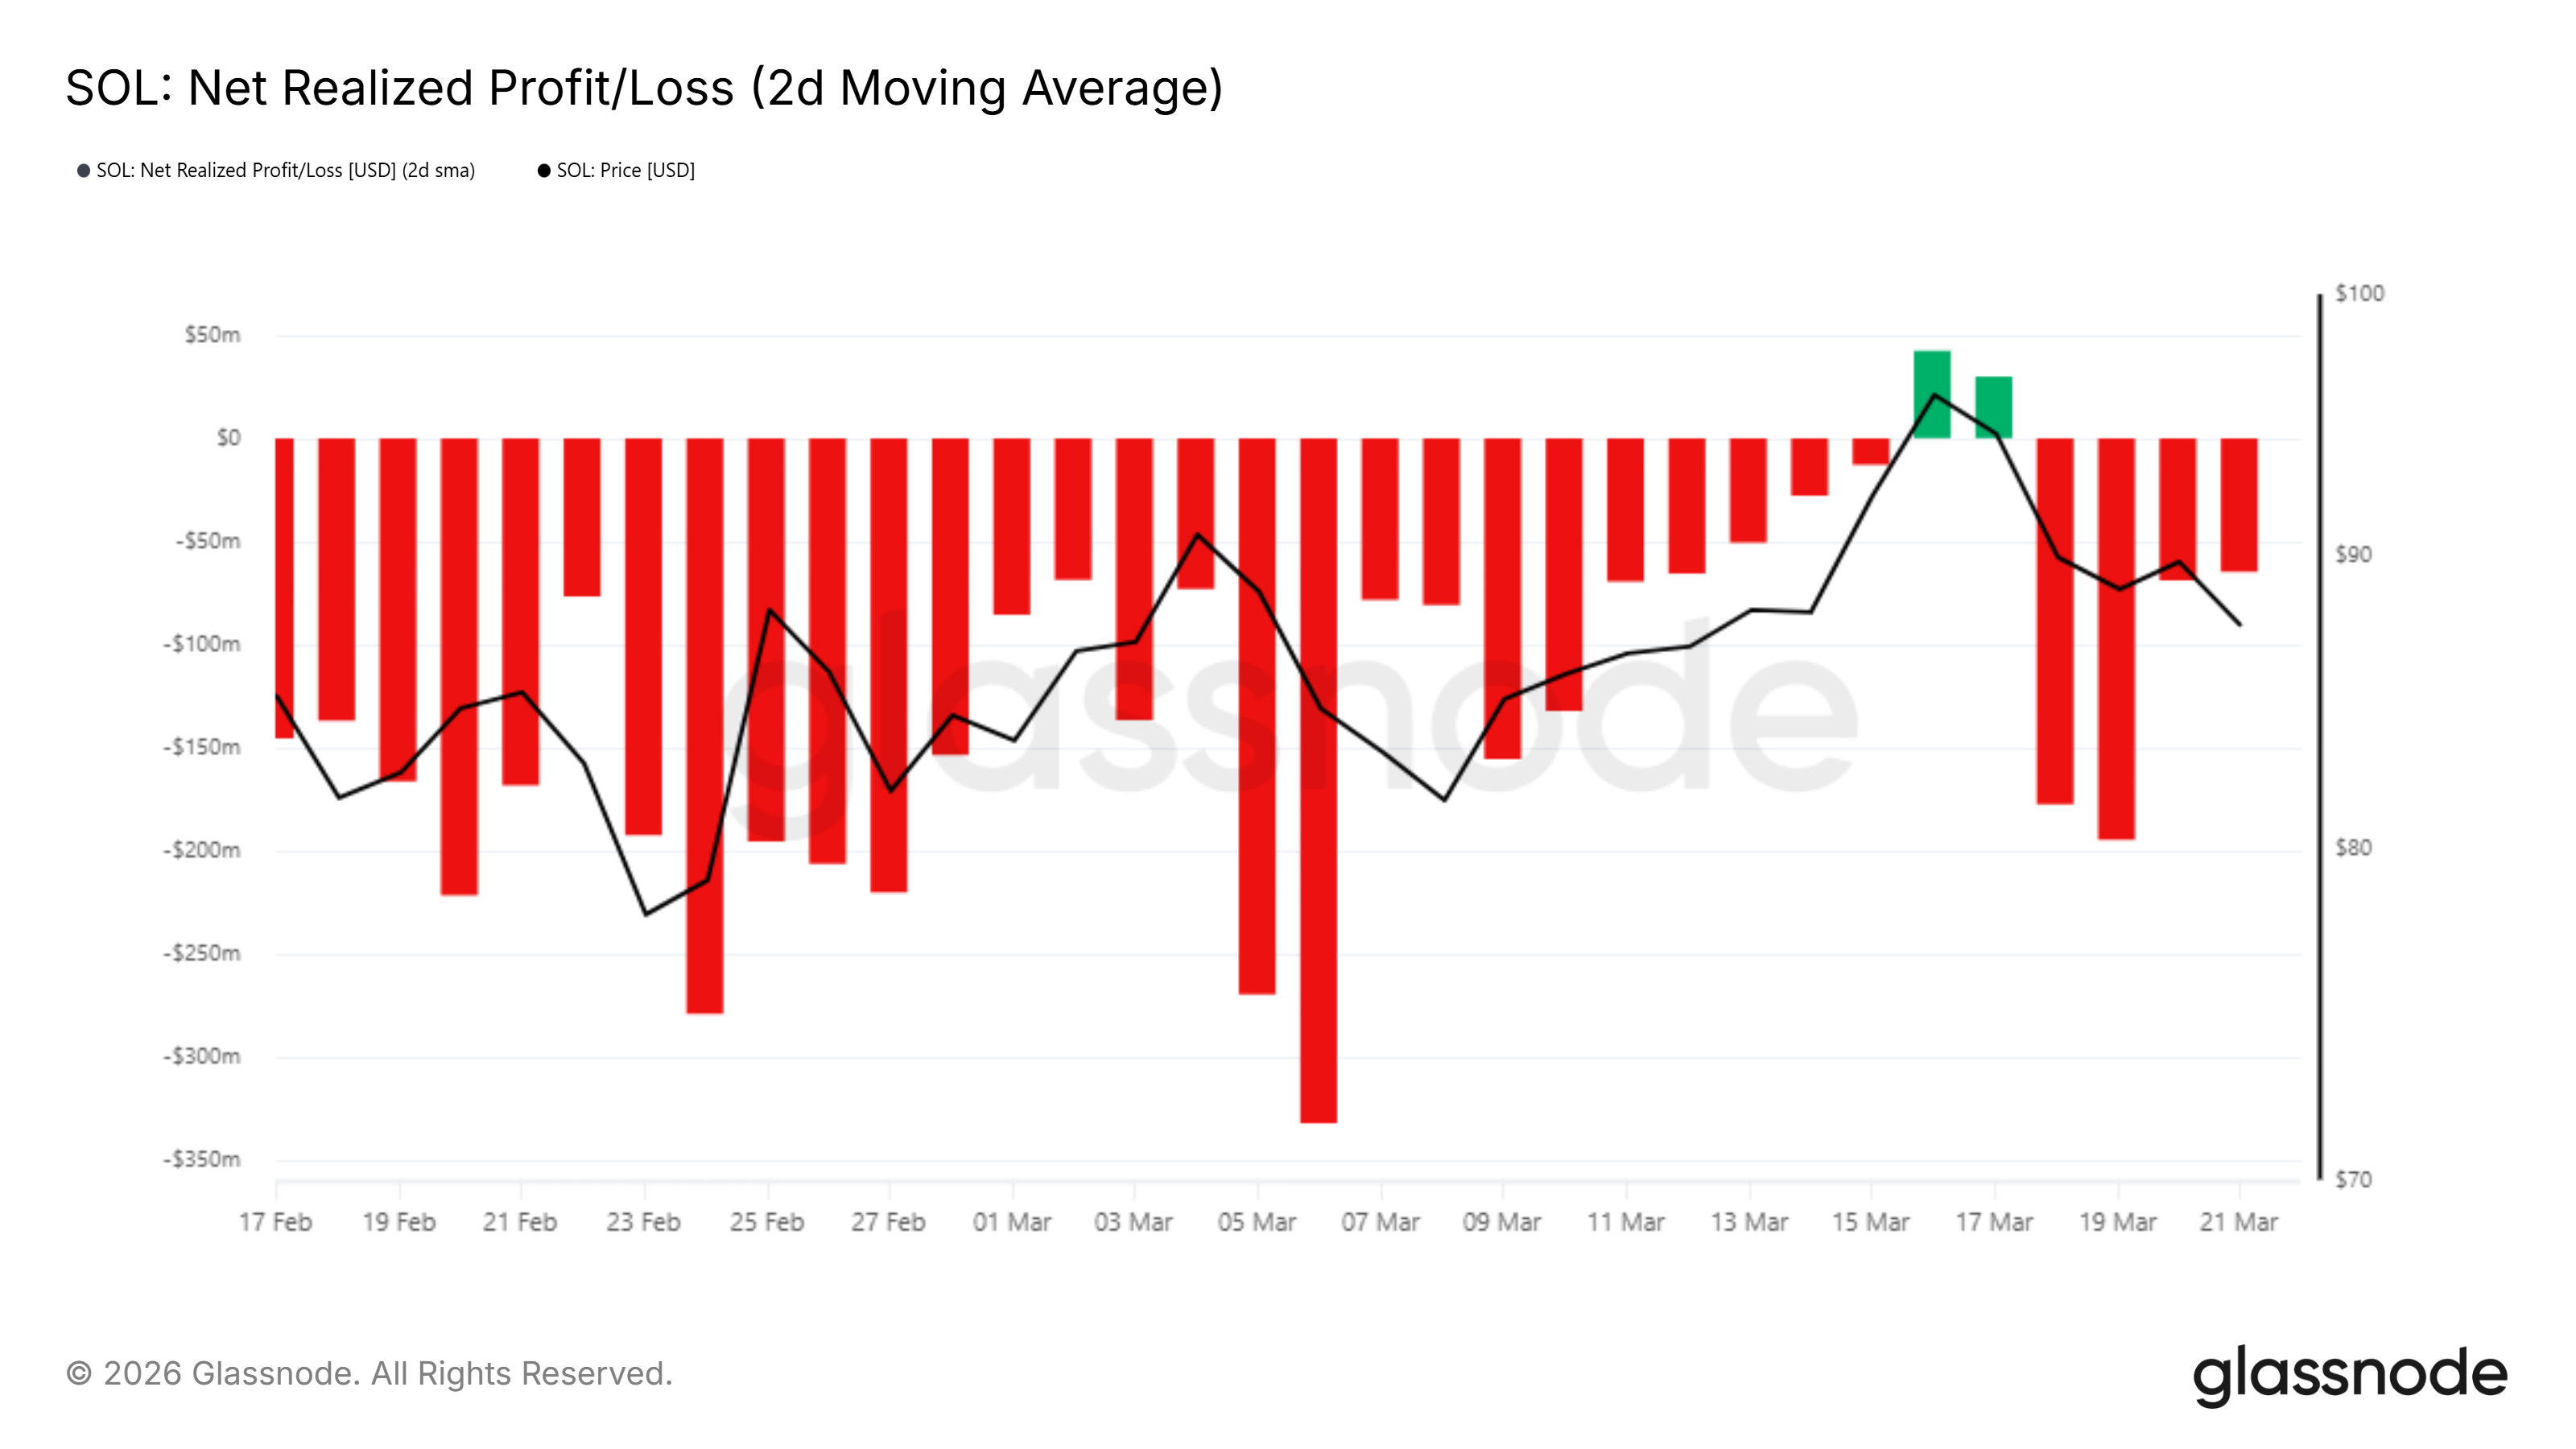
Since then, losses have resumed. The most recent bars sit around -$30 million to -$50 million per day. For selling pressure to ease, Solana price would need to sustain above the cost basis of recent buyers — likely above $92.19.
Solana Buying Takes Precedence
Despite the bearish realized loss picture, exchange flow data tells a different story. From mid-February through mid-March, holders sent millions of SOL to exchanges each day. Inflows peaked near 2.75 million SOL around March 5.
That trend reversed sharply after March 17. Daily outflows have reached 700,000 SOL, a clear sign that depositing activity has stalled. Holders are now withdrawing coins instead of positioning to sell.
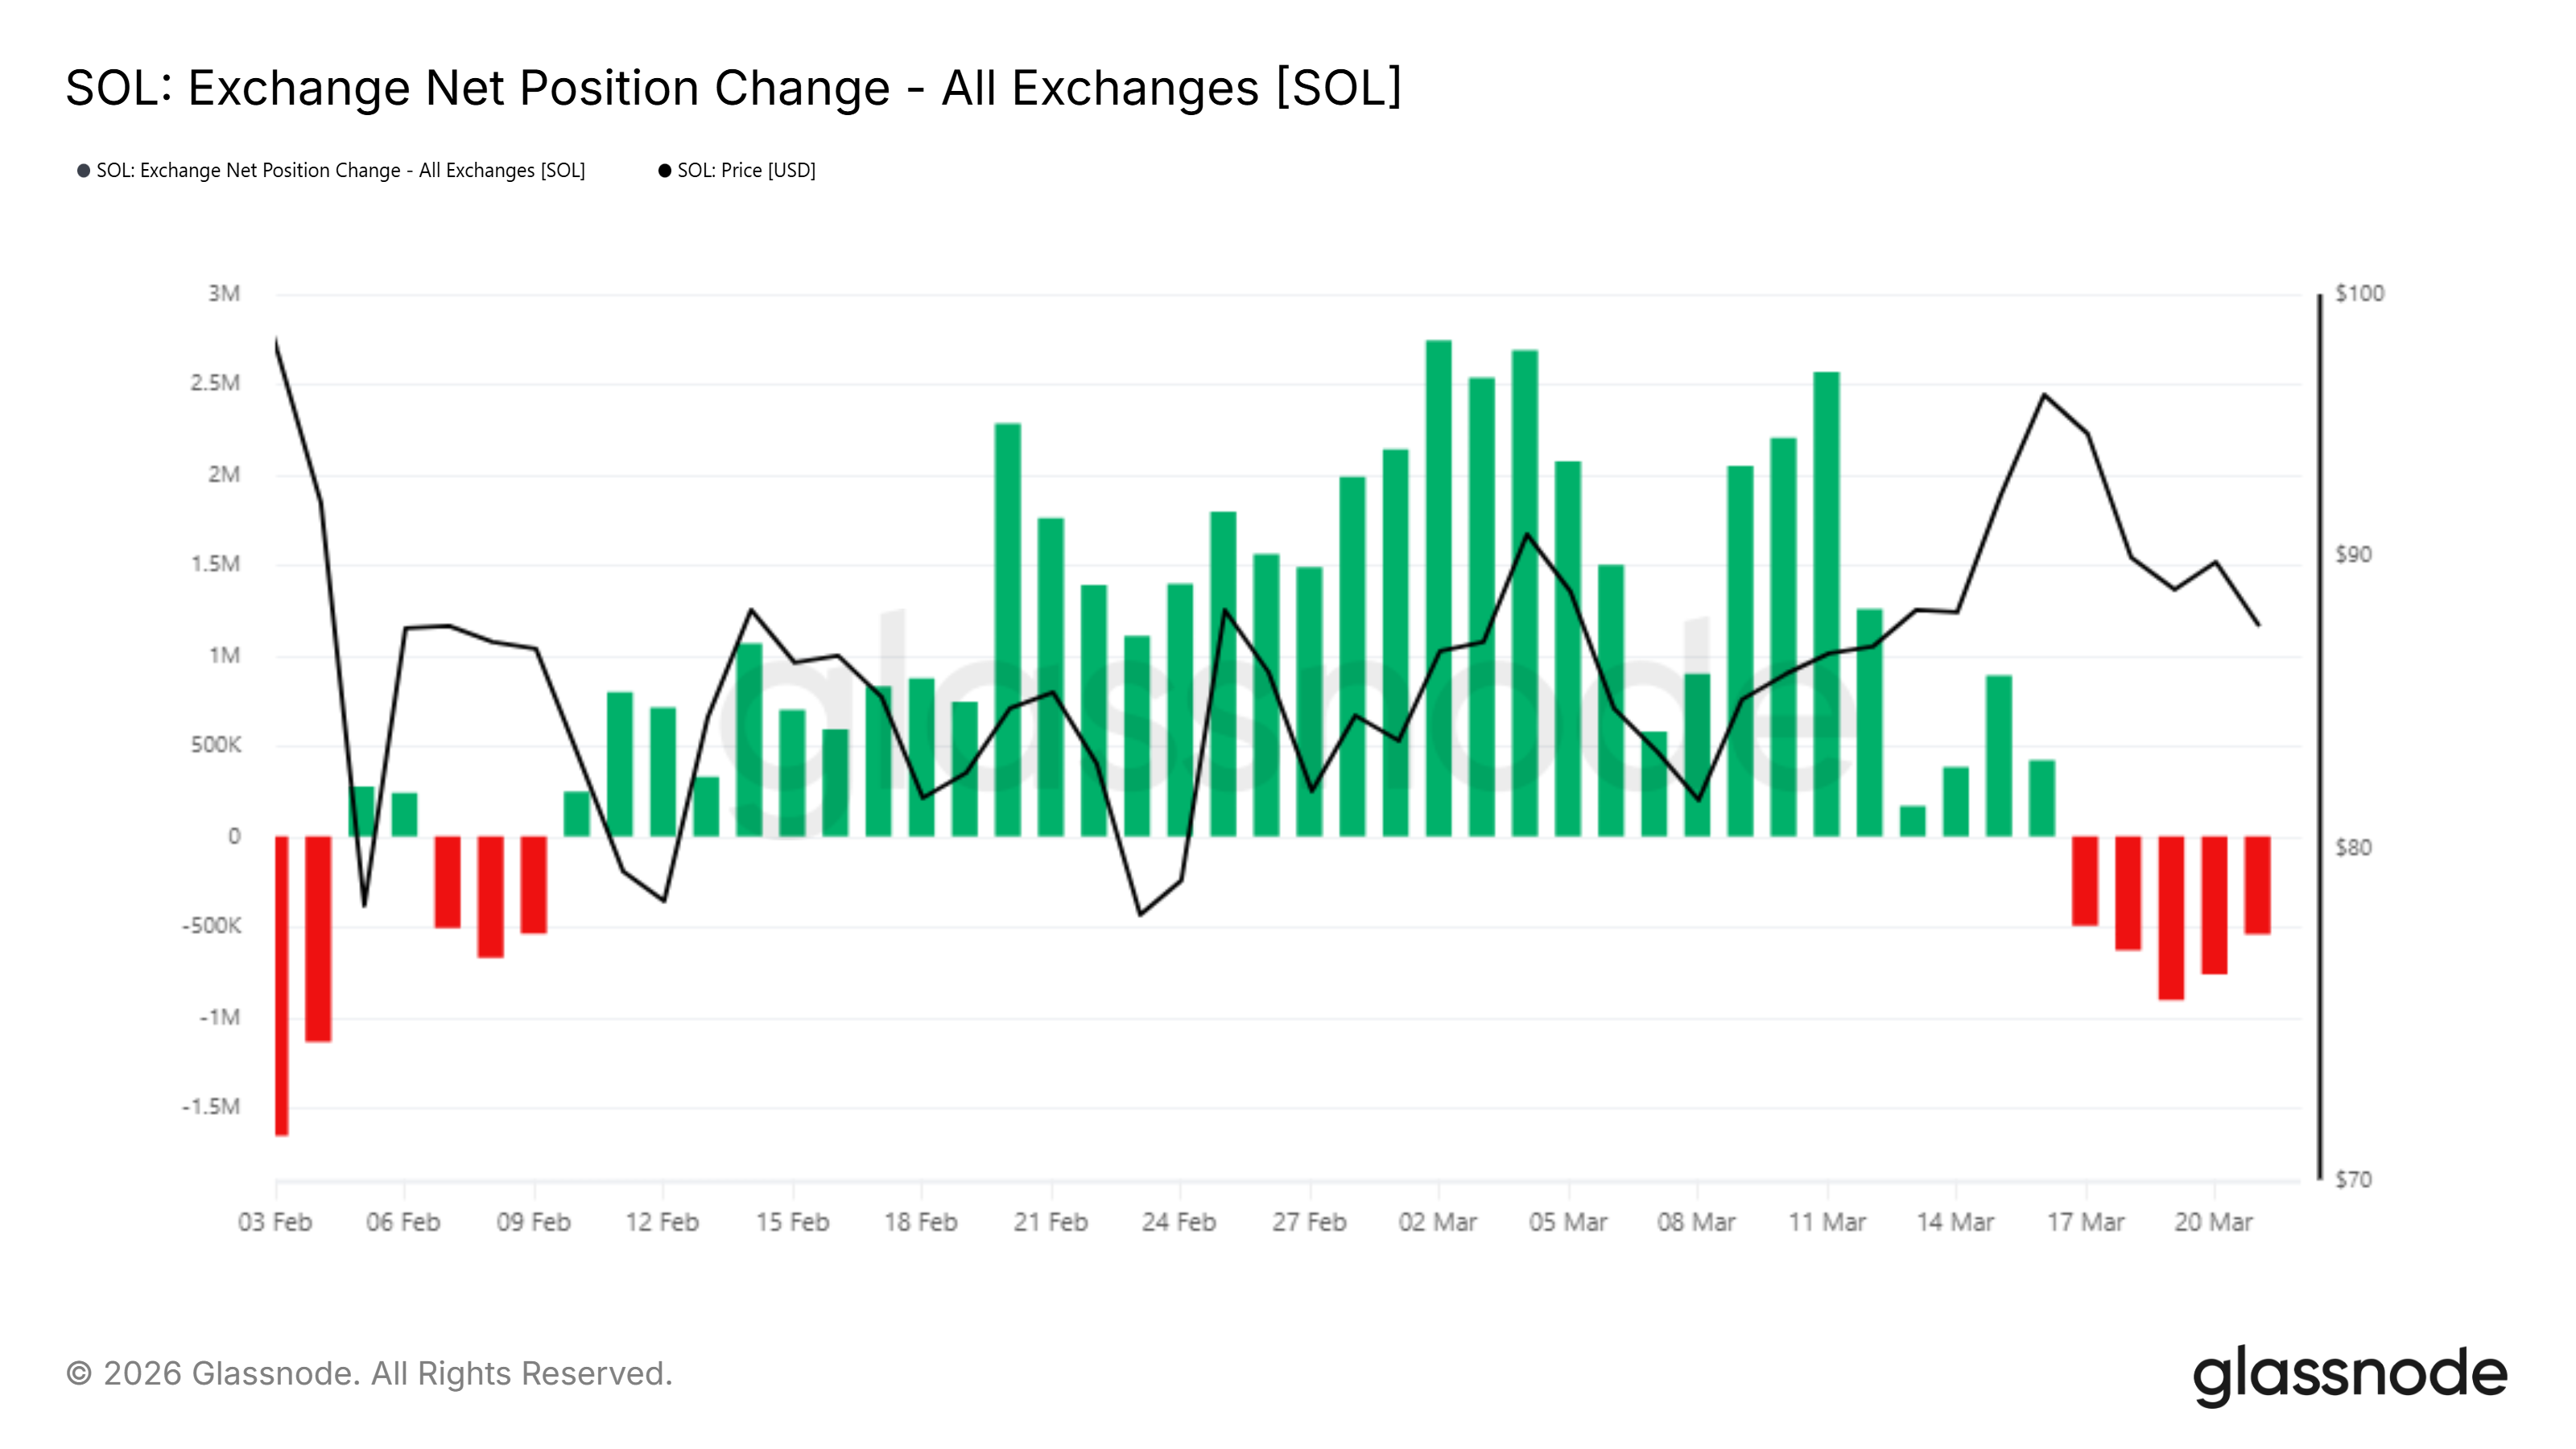
This shift matters. Sustained outflows reduce available supply on exchanges. However, the reversal is still fresh. It has not yet translated into a price recovery.
SOL Price Slips Below $90
The daily chart shows SOL testing a key support cluster between $88.02 and $88.54. An ascending trendline from the March lows runs through this zone, adding structural weight to the level.
Solana price is currently at $87.29, sitting just below the trendline support. The EMA has flattened near $88.54, now acting as overhead resistance.
A daily close below $88.02 would expose the next major floor at $81.60, roughly 6.5% lower. The measured move from the recent $97 high to $88 projects a similar downside if support gives way.
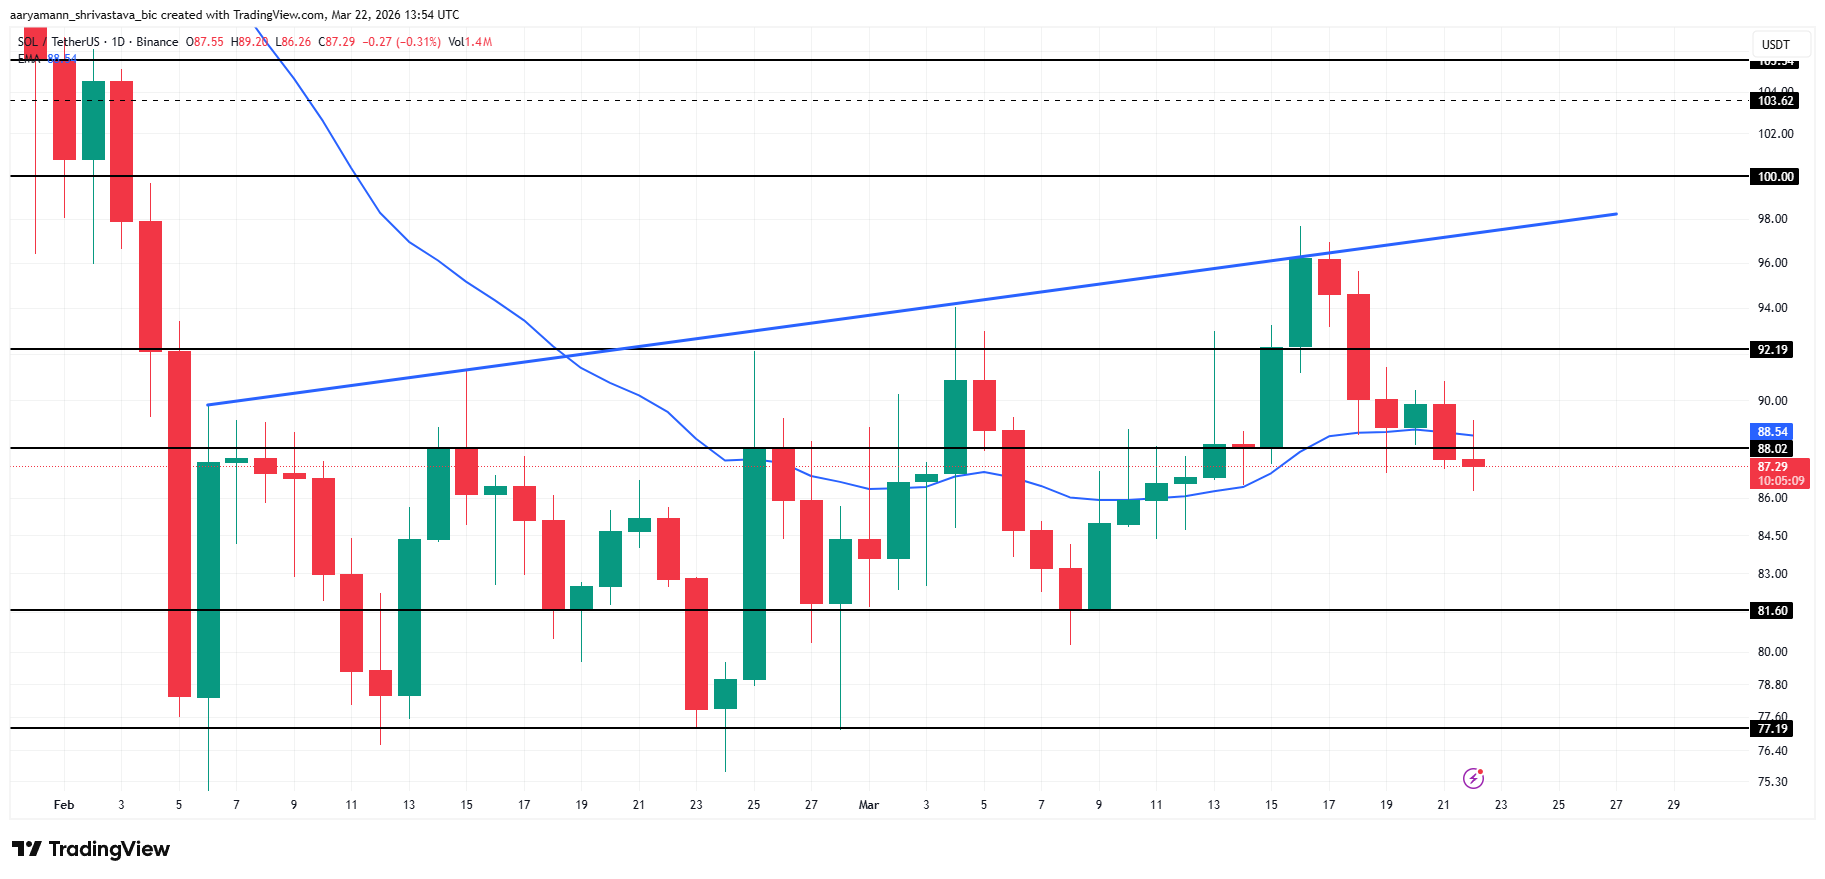
To the upside, $92.19 is the first meaningful resistance. A recovery above that level would shift short-term momentum back to buyers. The exchange outflow data gives bulls a case to make. The realized loss chart says sellers are not done yet.
The post Solana Holders End 4-Week Selling Pressure Despite Losses appeared first on BeInCrypto.