
Polkadot price surged nearly 30% in the past 24 hours, erasing almost a month of losses. The sharp rally surprised traders who expected Bitcoin to lead the move.
However, this time the crypto king played a limited role in DOT’s breakout. While Bitcoin remains a benchmark asset, Polkadot appears to be decoupling from its direct influence.
Polkadot Finds Investors’ Support
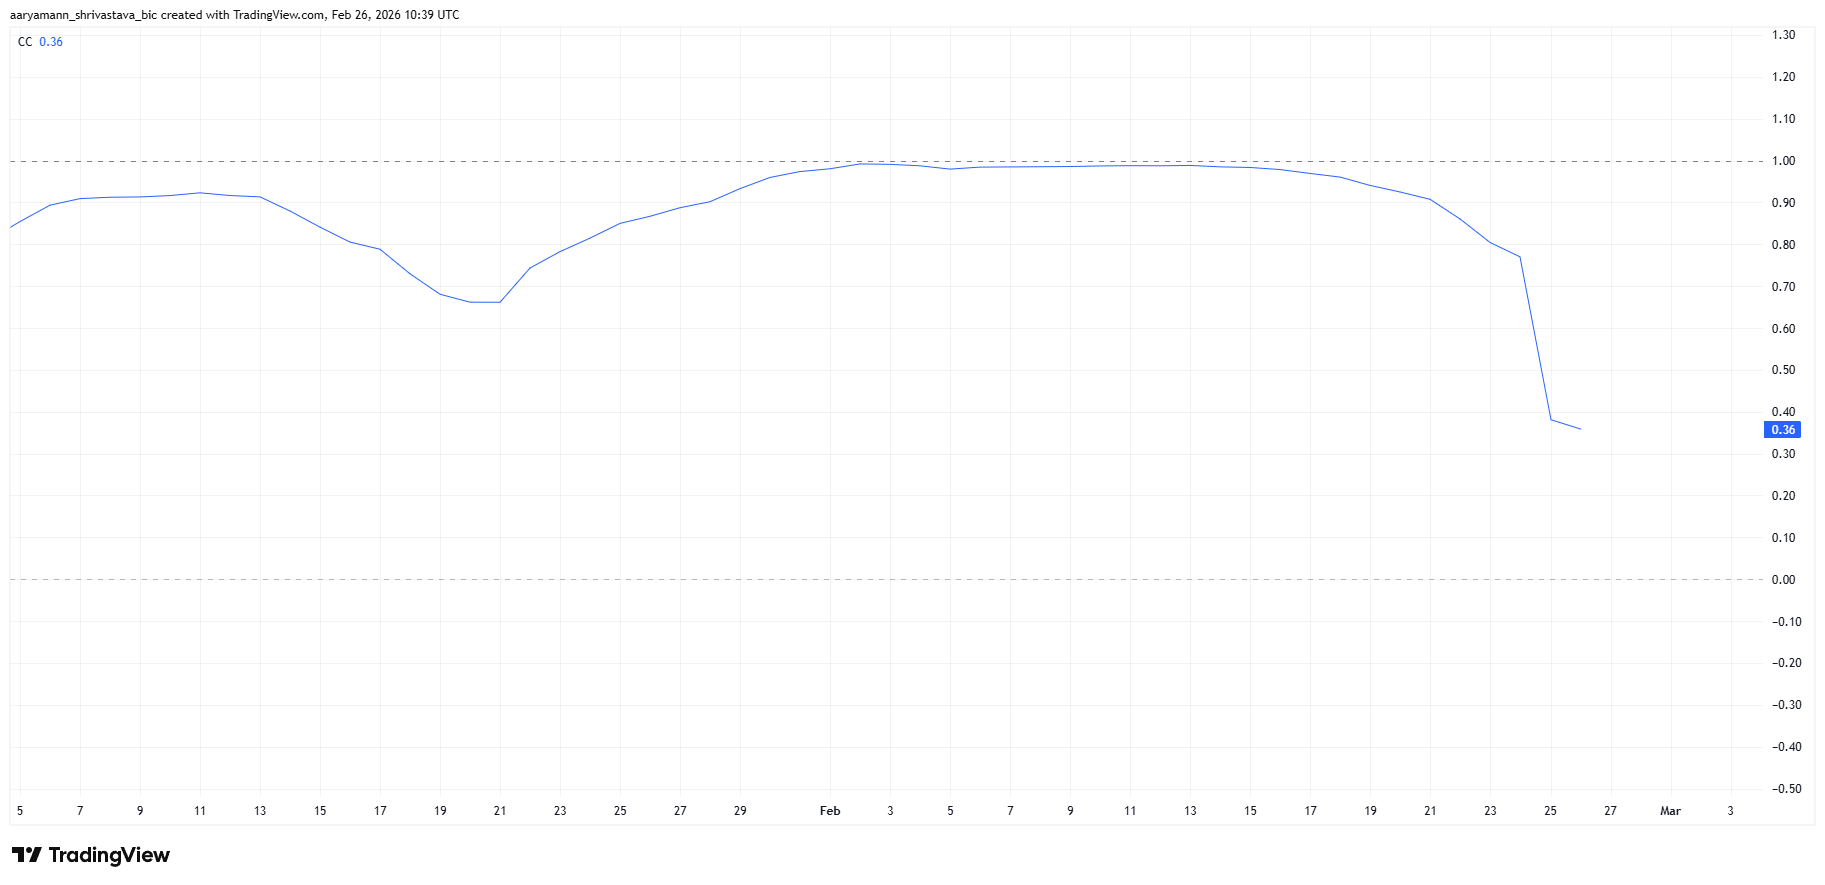
Polkadot’s correlation with Bitcoin has declined in recent weeks. The metric currently stands at 0.36, signaling a weaker relationship between the two assets. Lower correlation suggests DOT is increasingly driven by internal factors rather than broader BTC price swings.
Decoupling can benefit altcoins during periods of Bitcoin consolidation. Reduced dependence allows Polkadot to respond to its own liquidity and demand trends. This structural shift indicates that DOT may be charting an independent recovery path.
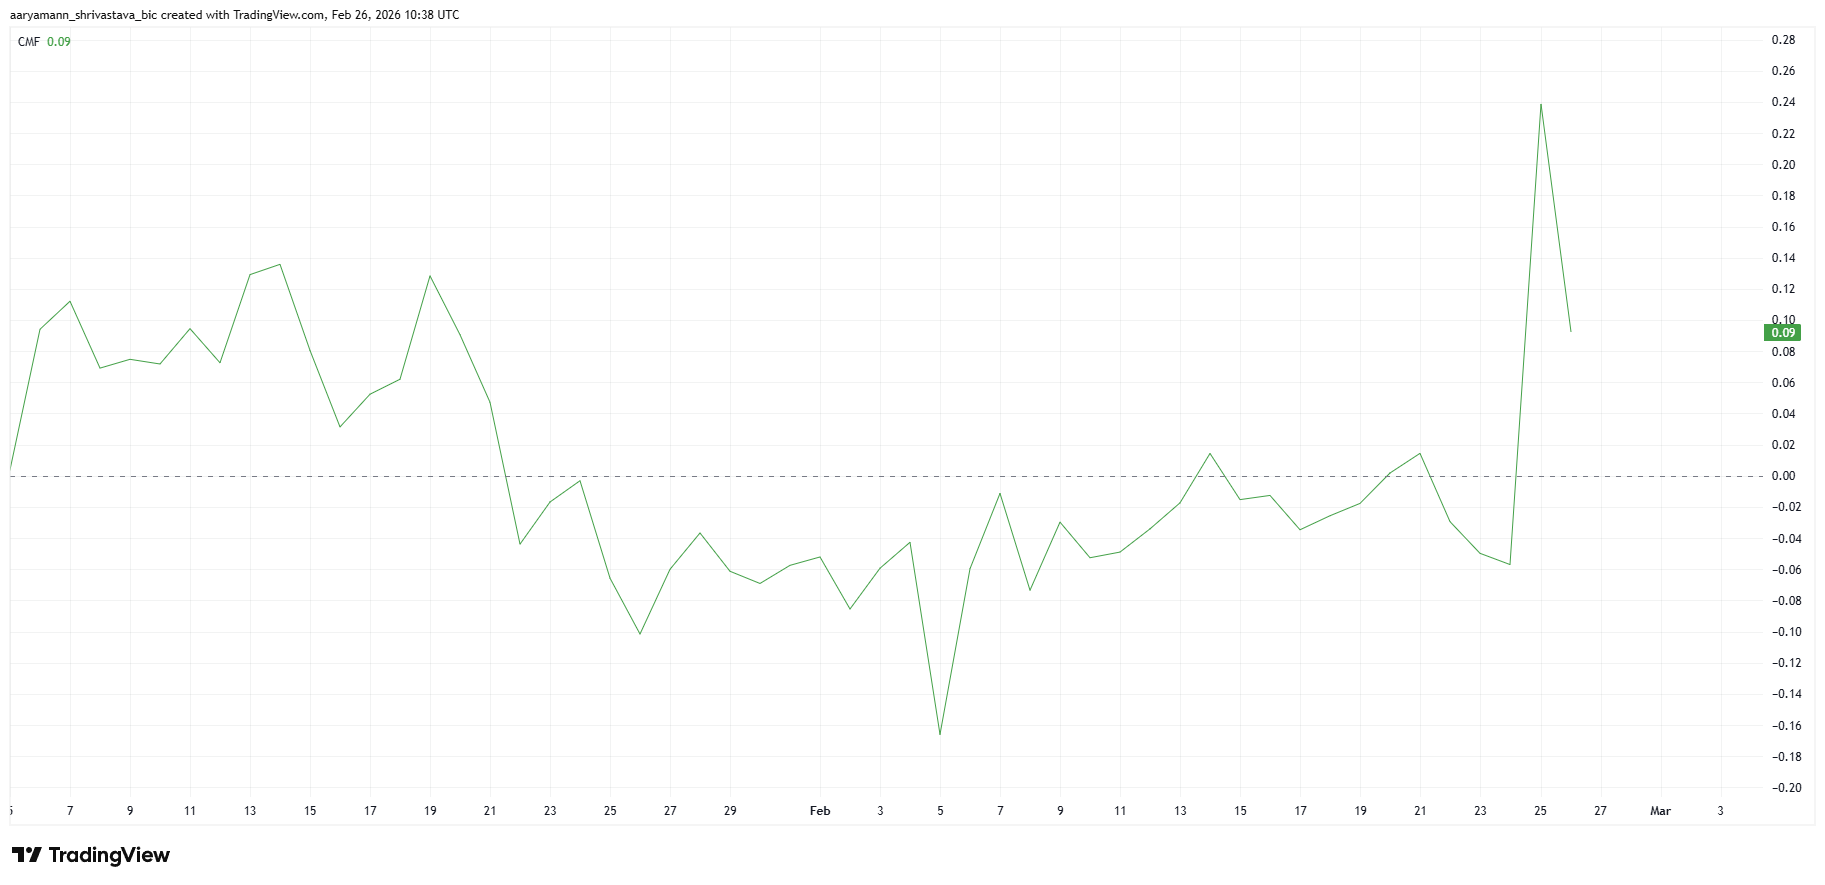
The Chaikin Money Flow indicator supports this interpretation. CMF recorded a sharp uptick during the rally, confirming strong capital inflows into Polkadot. Rising CMF values typically reflect increased buying pressure from larger market participants.
Strong inflows suggest that large holders may have contributed to the price spike. CMF often captures institutional or whale-driven accumulation patterns. Sustained positive readings would reinforce the case for continued upside momentum in DOT price action.
DOT Price Has a Ceiling For Now
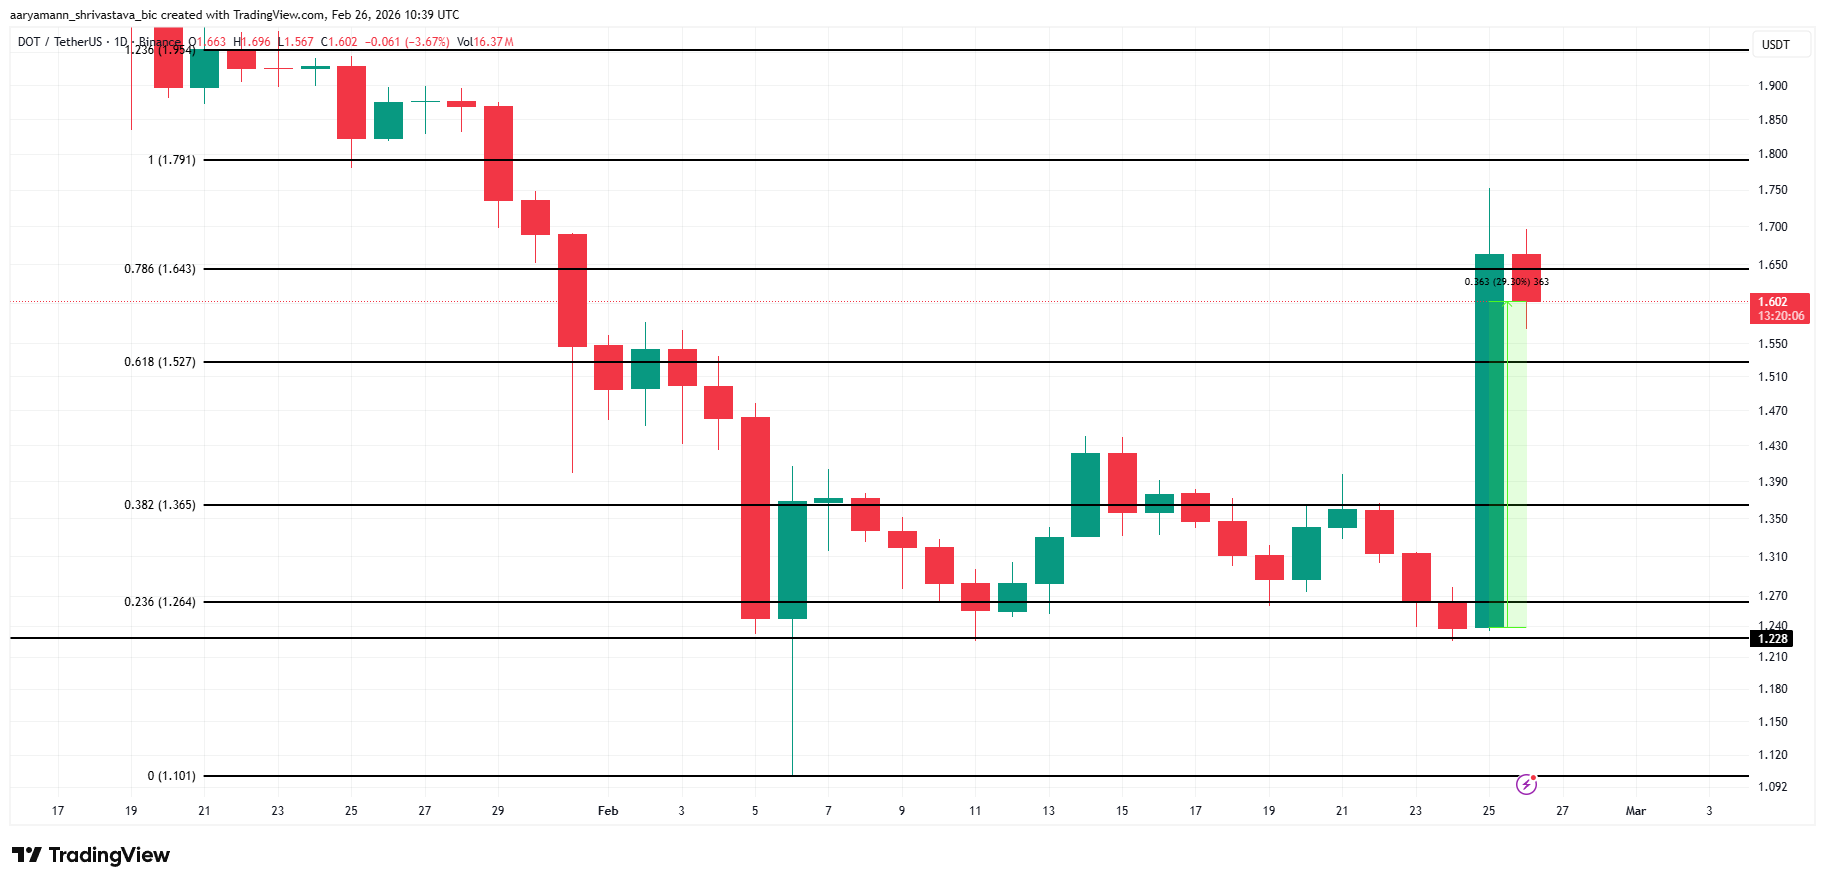
Polkadot price is trading at $1.60 at the time of writing after a near 30% rally. The altcoin briefly tested the $1.70 level but failed to secure $1.64 as confirmed support. This hesitation highlights emerging resistance near current highs.
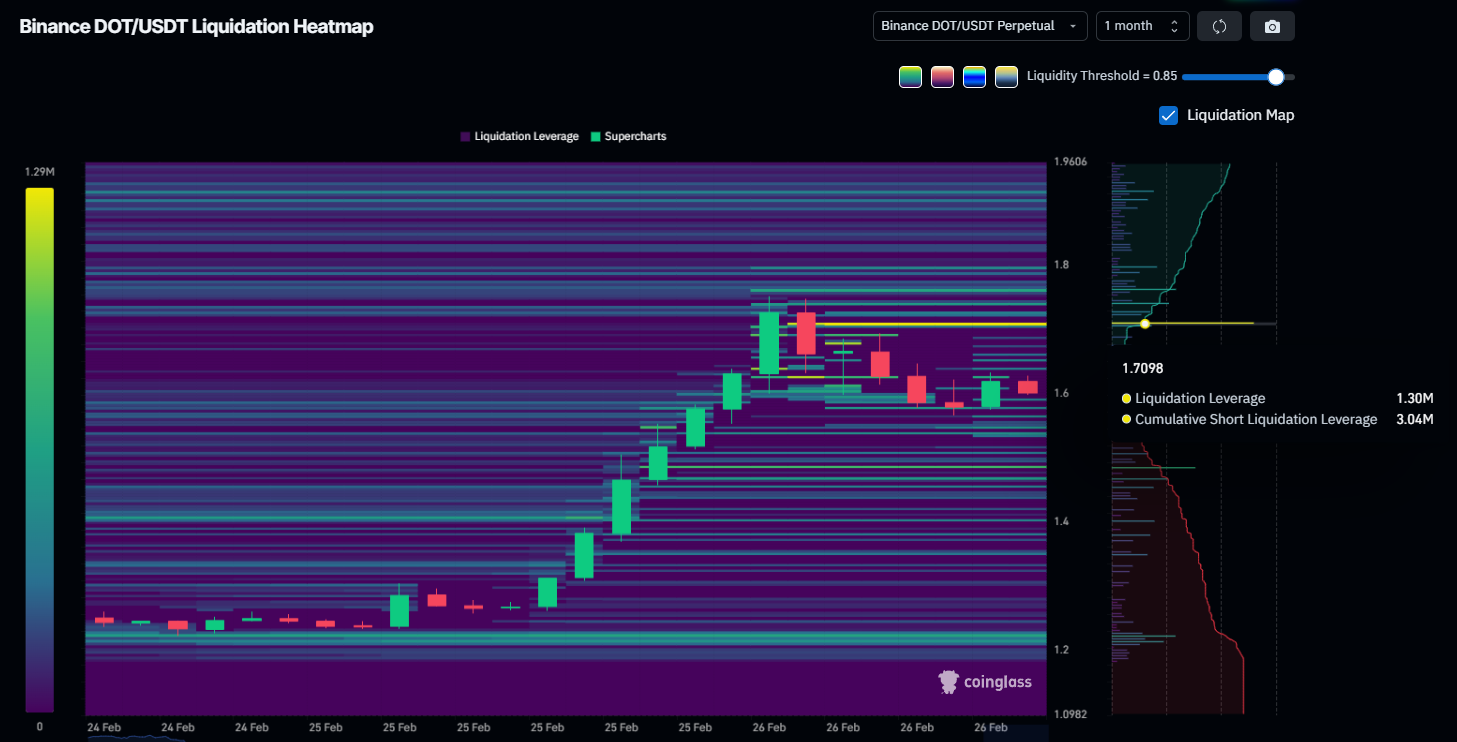
The liquidation heatmap reveals a significant cluster of short positions near $1.70. Approximately $1.30 million in short liquidations are concentrated at this level. A decisive breakout could trigger total short liquidations worth $3.04 million. Such forced buying may accelerate price gains.
If bullish momentum persists, DOT could extend toward $1.79 in the near term. However, upside depends on sustained capital inflows. Should buying pressure fade, DOT may retest the $1.52 support, aligned with the 61.8% Fibonacci level. Losing that bull market support floor would invalidate the short-term bullish thesis.
The post Polkadot (DOT) Price Rallies 30% Thanks to Bitcoin – But Not for the Obvious Reason appeared first on BeInCrypto.