
PIPPIN has suffered a devastating 66% crash, but the collapse was not sudden. The decline represents a breakdown that had been forming over several months.
The severity of the move, however, has triggered serious concern about PIPPIN’s near-term recovery prospects.
The Decline Was The Result Of PIPPIN Traders’ Actions
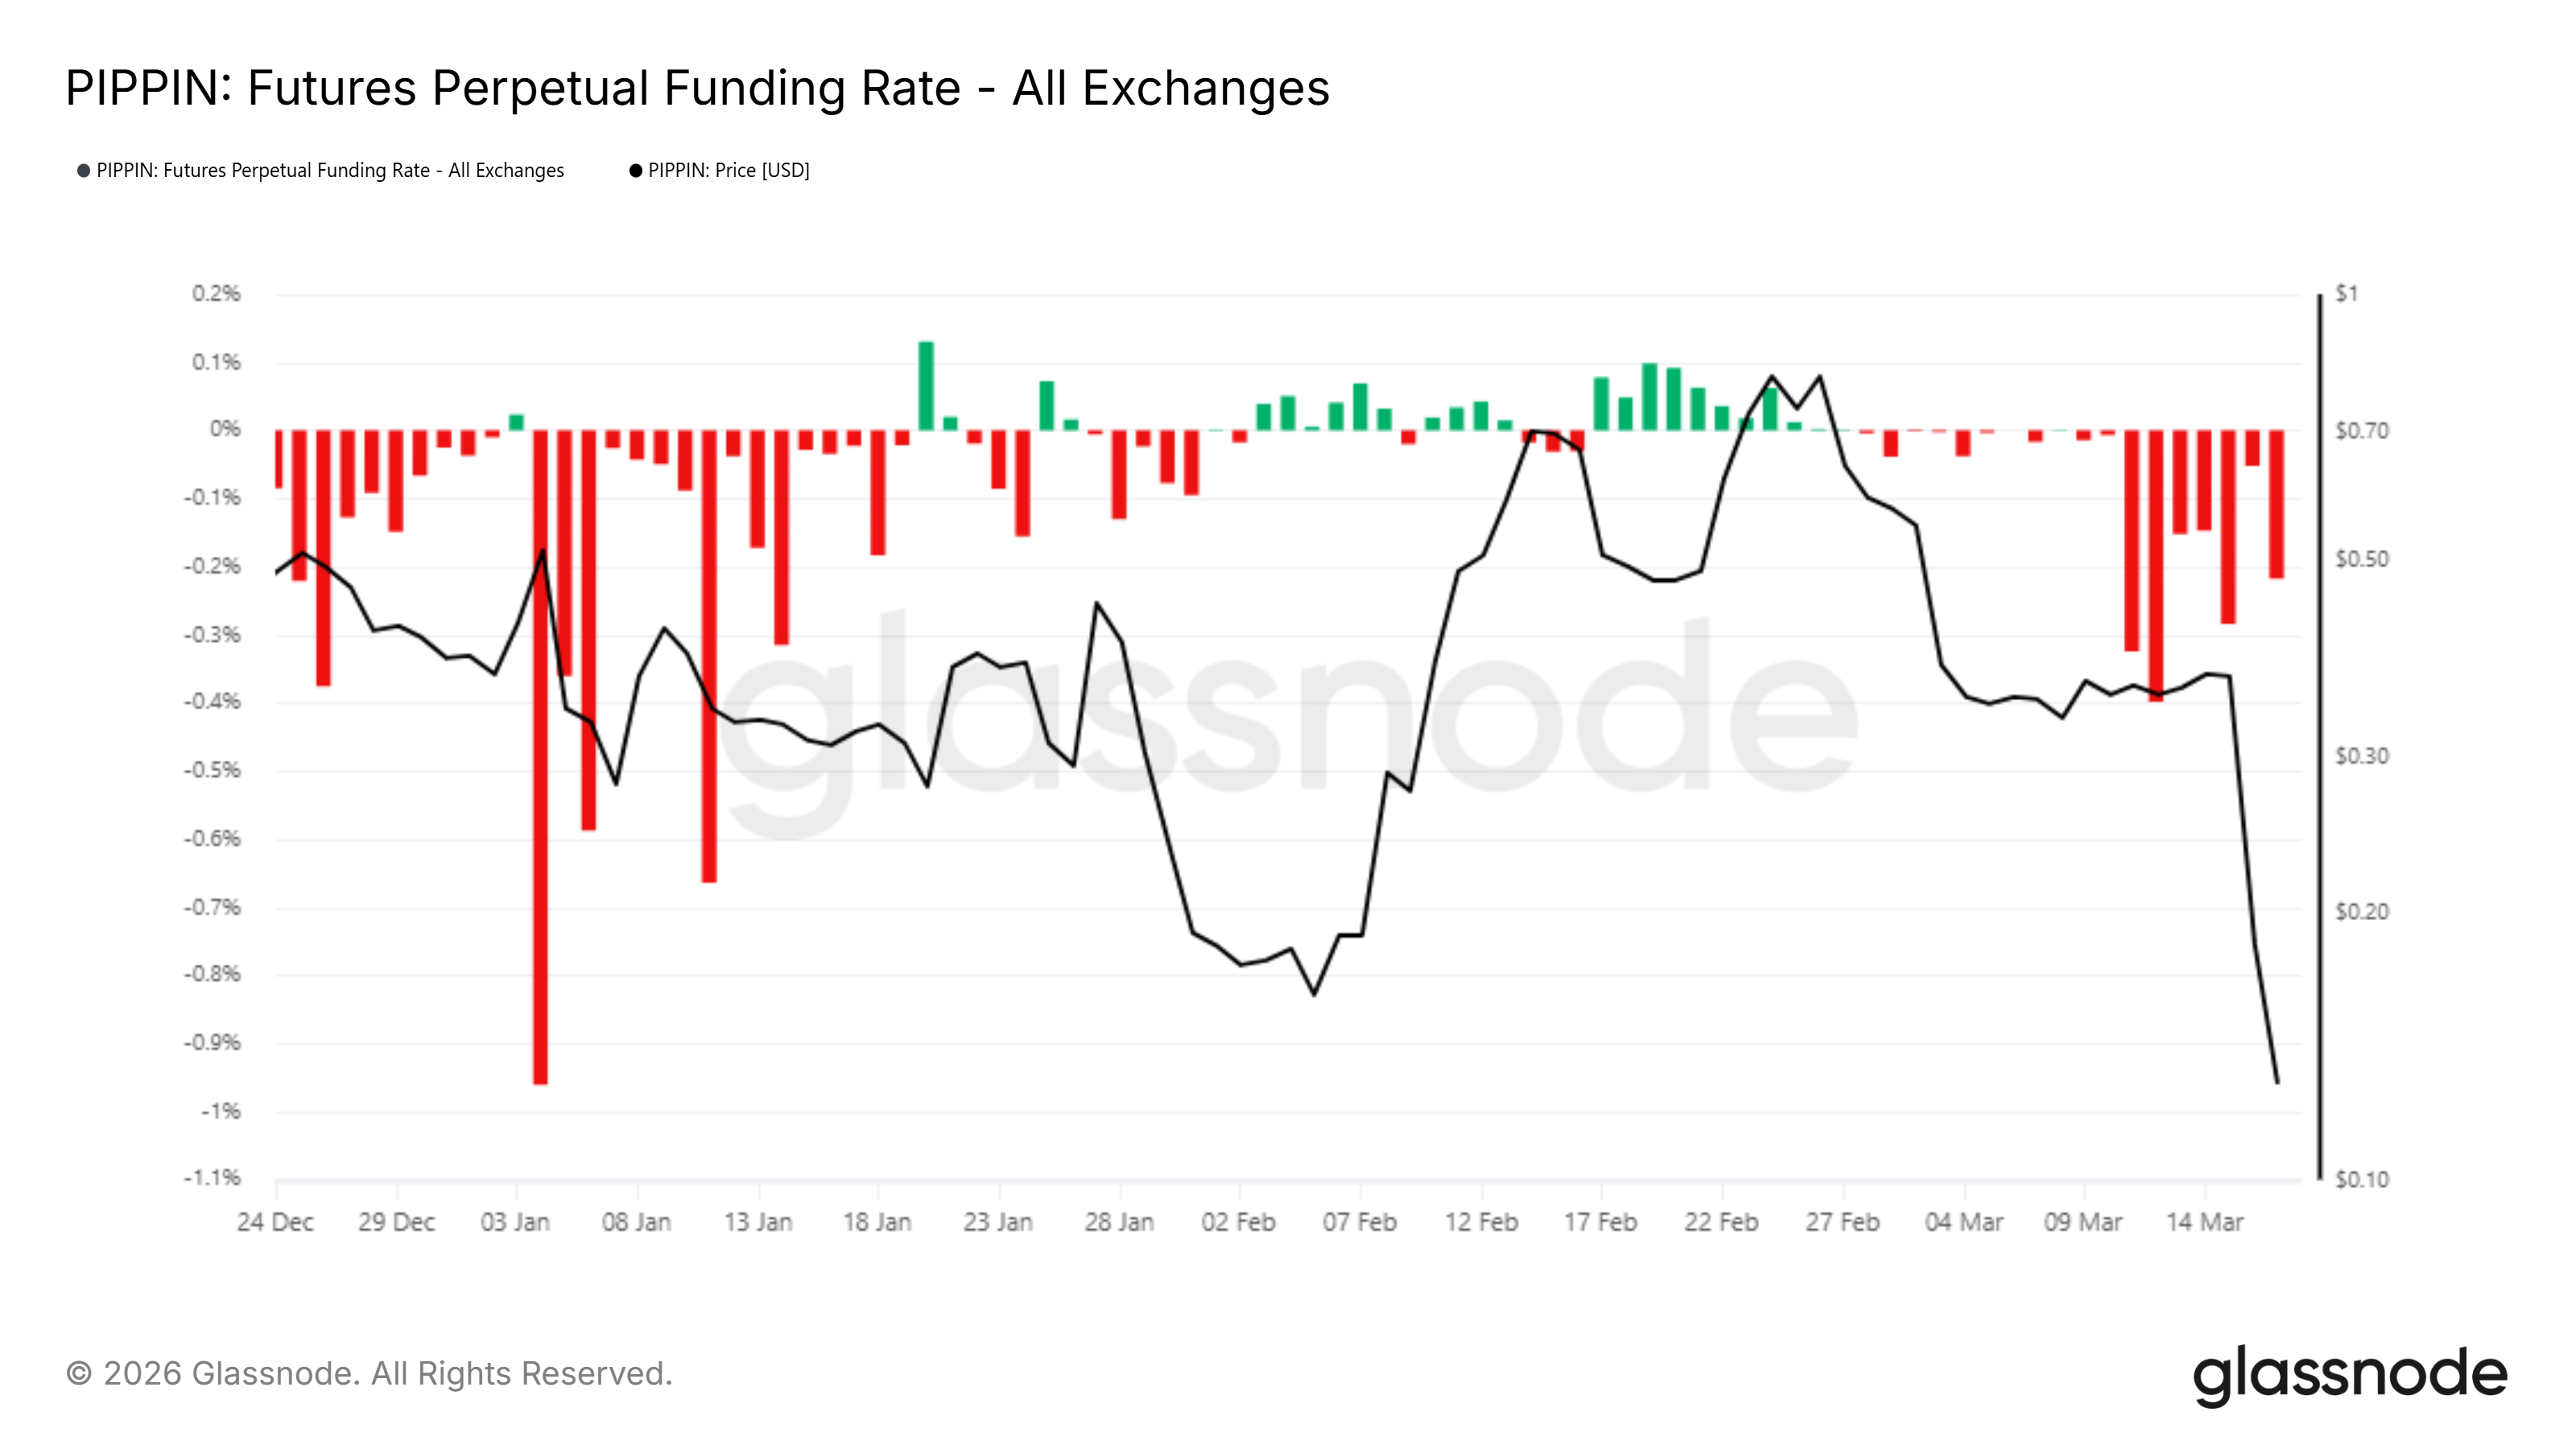
Funding rate data reveal that trader sentiment turned sharply bearish in the days preceding the collapse. Short positions began outpacing longs, building structural downward pressure on PIPPIN’s price. As this bearish derivatives positioning accumulated, the altcoin’s price eventually buckled under the combined weight of shorts dominating the futures market.
Historical precedent makes the current situation more concerning. Previous instances of similar funding rate shifts have reliably preceded meaningful price drops for PIPPIN. With shorts continuing to dominate longs at the time of writing, the derivatives market is signaling that selling pressure has not yet exhausted itself, raising the probability of further downside ahead.
Want more token insights like this? Sign up for Editor Harsh Notariya’s Daily Crypto Newsletter here.
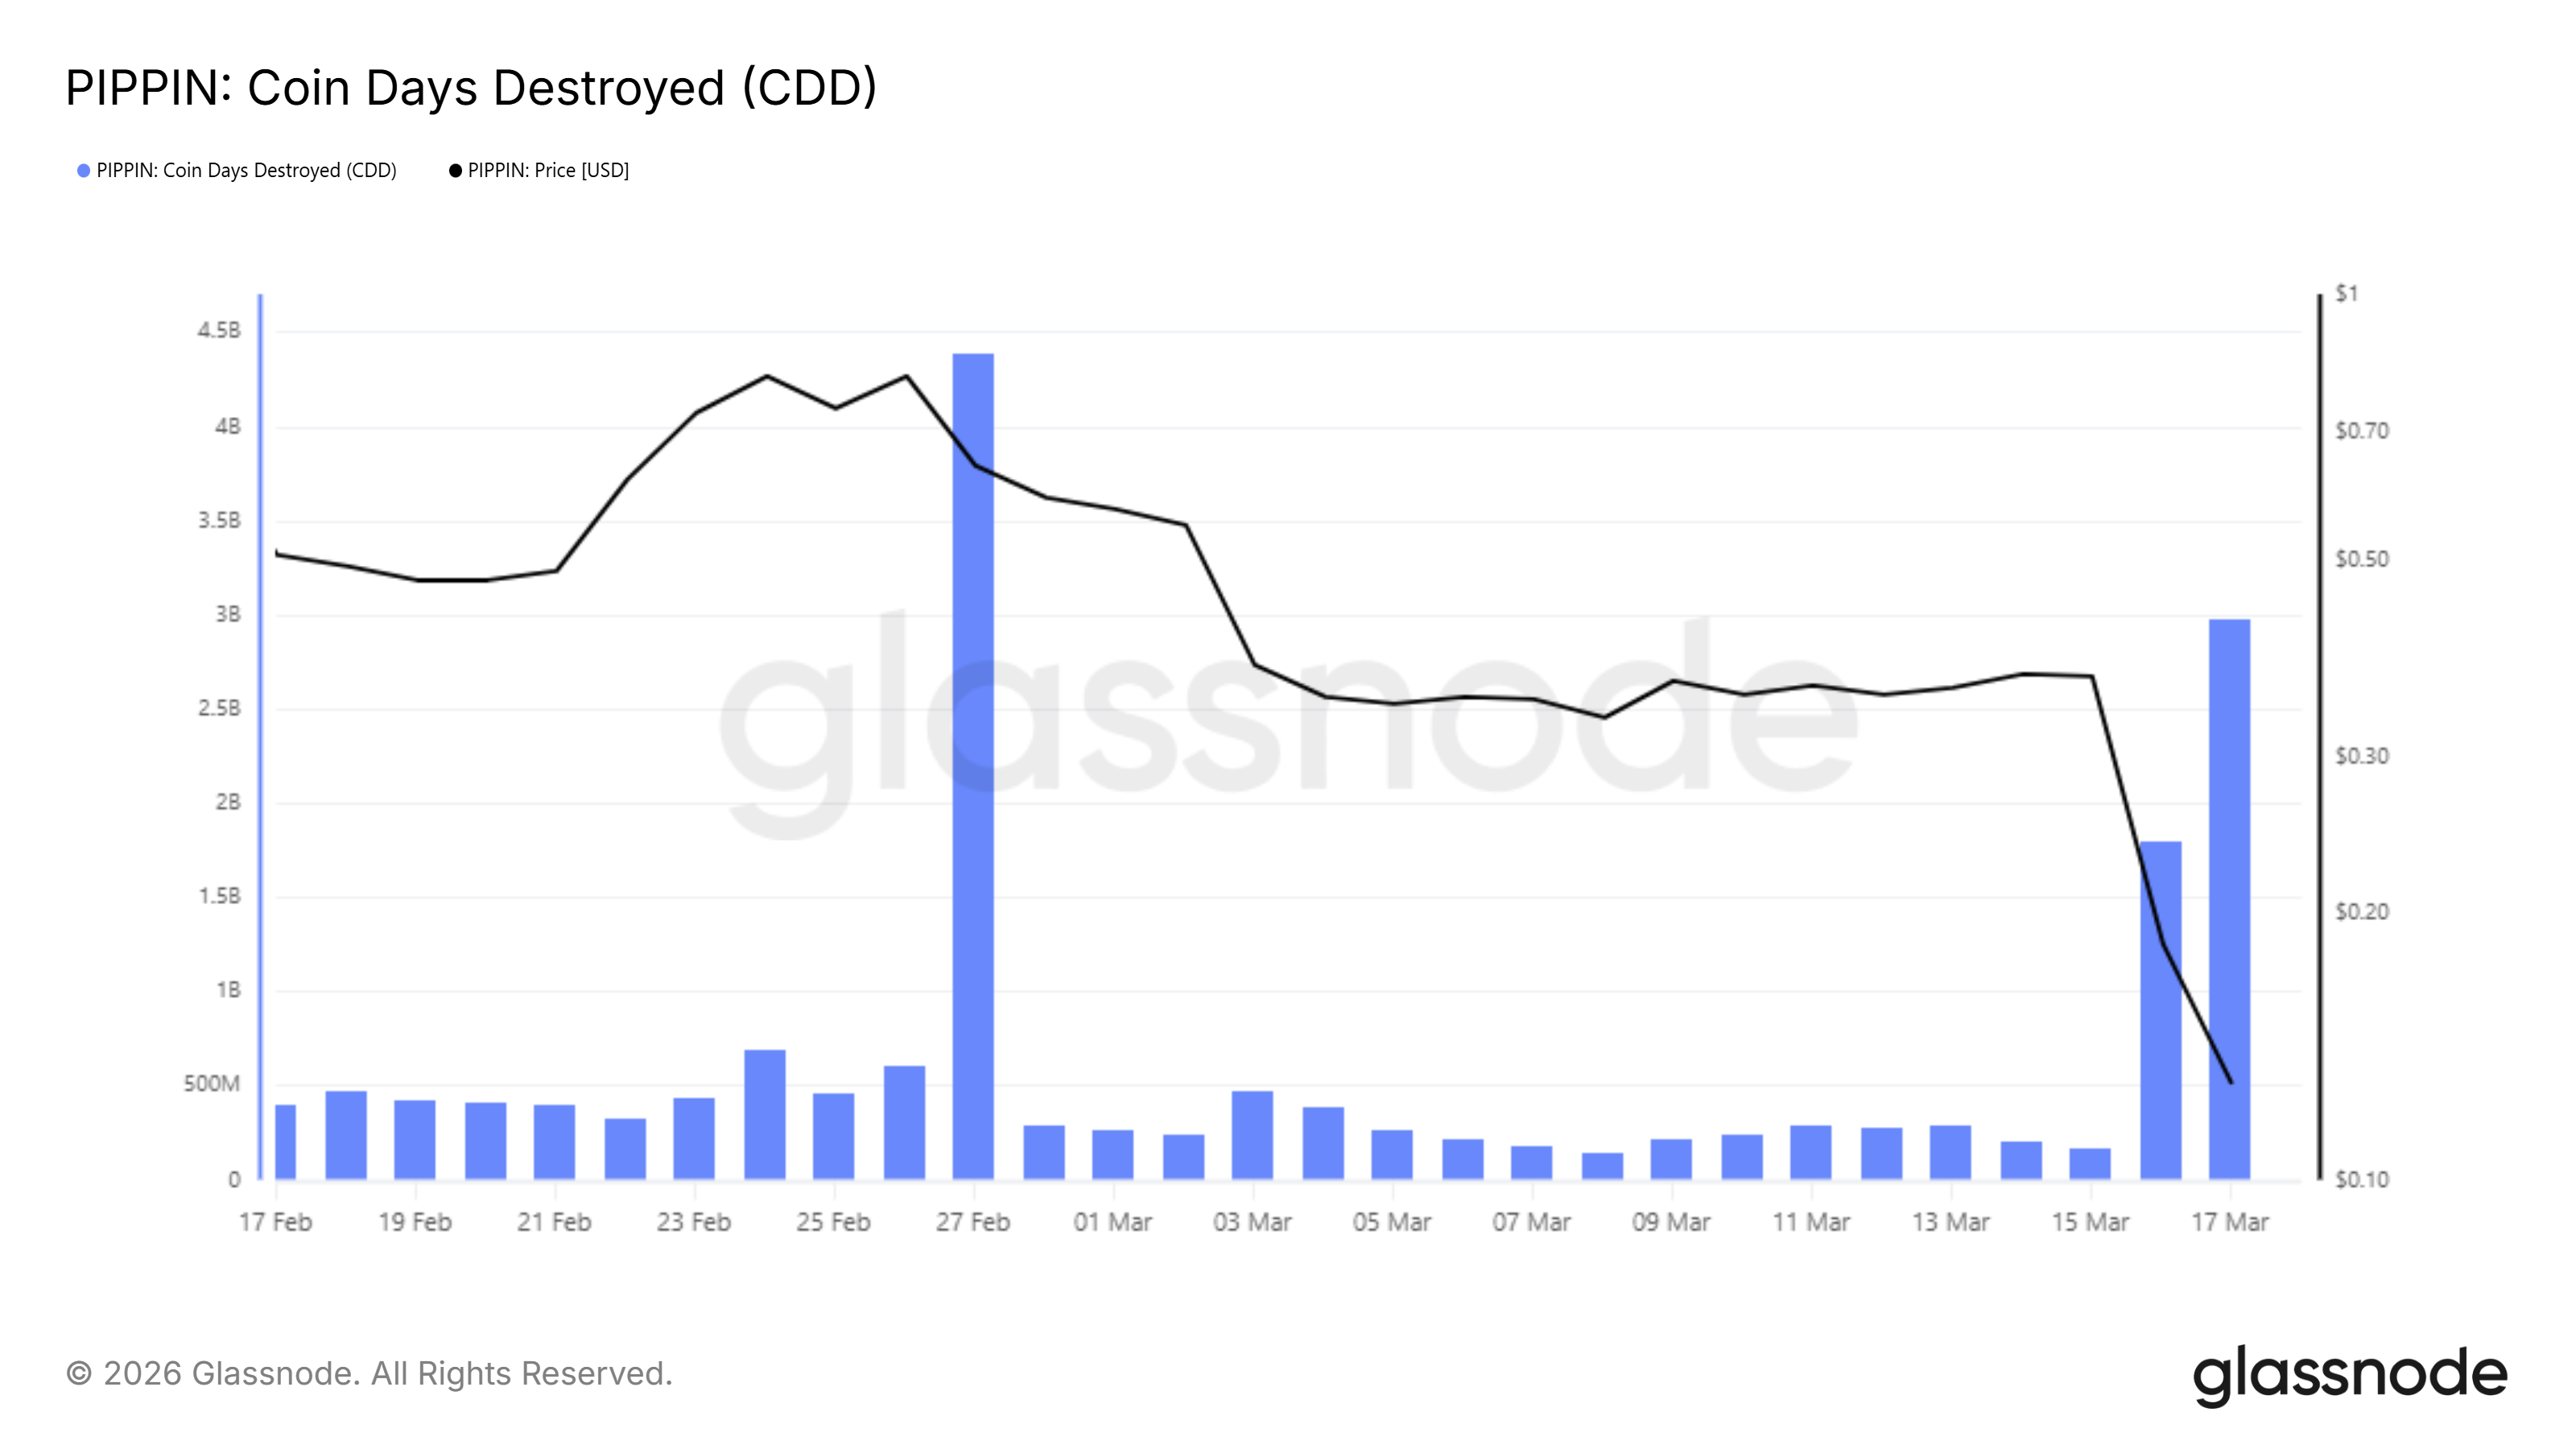
Coin Days Destroyed data registered a sharp spike for the first time in over two weeks, a significant development for PIPPIN’s outlook. This spike indicates that long-term holders are moving previously dormant coins, a behavior historically associated with selling activity. The sudden CDD surge after weeks of dormancy confirms LTH participation in the current decline.
Long-term holders did not initiate the original price drop, but their selling has meaningfully amplified the downward momentum. The last time CDD spiked at a similar magnitude, PIPPIN experienced an extended period of price weakness.
Their considerable market influence means continued LTH distribution will sustain selling pressure and complicate any recovery attempt in the near term.
PIPPIN Price Has a Long Way Down
PIPPIN is trading at $0.123, having visibly broken down from a double top pattern that formed over the past three months. This technical formation projects a near 80% decline from the breakdown point, targeting a slip below the $0.037 support level. The pattern’s activation confirms the structural deterioration that had been developing for months.
The 66% drop over 48 hours triggered the breakdown, and the combination of negative funding rates and LTH selling confirms the decline is likely to continue. Losing the $0.100 psychological support level would deepen bearish conviction, removing a critical floor that many investors have been watching closely.
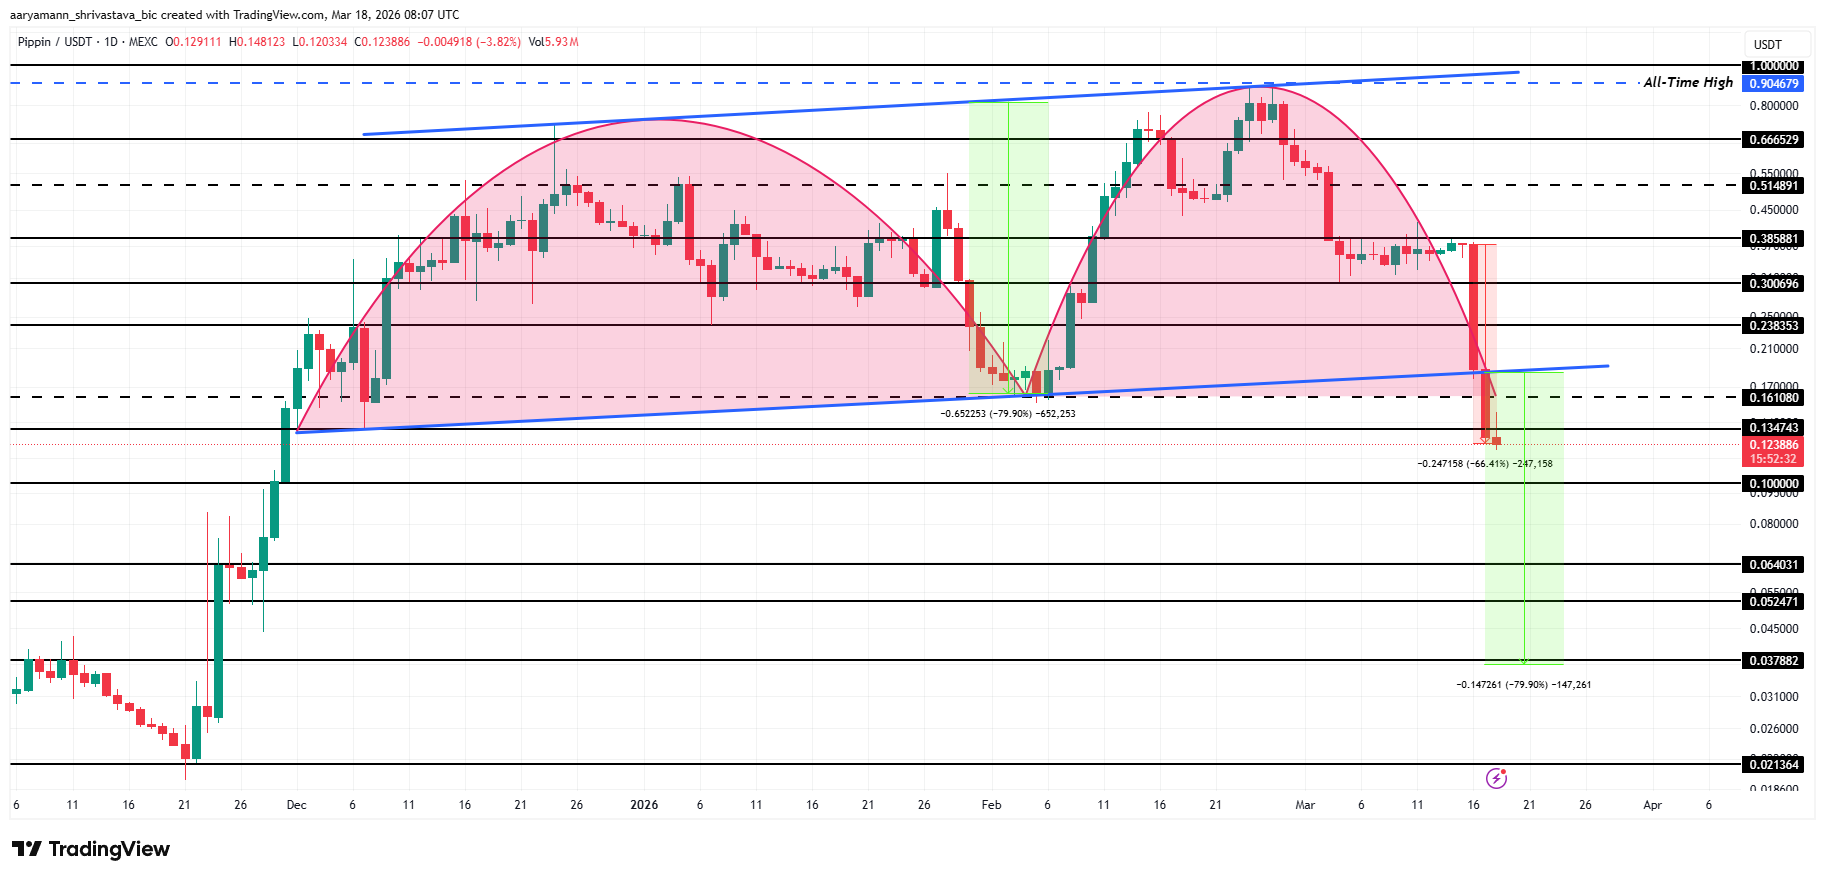
Bargain hunters entering at current depressed levels represent the primary bullish scenario. Aggressive accumulation could reverse the drawdown. Reclaiming $0.238 would invalidate both the bearish thesis and the double top pattern, signaling a genuine structural recovery for PIPPIN.
The post PIPPIN’s 66% Crash Was Not a Surprise — The Chart Had Been Warning for Months appeared first on BeInCrypto.