
Pi Network (PI) is trading at $0.1897, as a double top pattern on the daily chart puts the $0.1300 all-time low back in view for the first time since February.
Two technical signals confirm the bearish structure is strengthening — but the pattern is only valid if one specific price level breaks.
Selling Pressure On Pi Coin Is Rising
The MFI peaked above 83 around March 12 — the highest reading in the chart’s visible history and deep into overbought territory. That coincided precisely with the second peak of Pi Coin’s double top pattern near $0.27.
Since then, the indicator has declined without interruption to 43.44. The drop is steep and sustained, tracing a clean downtrend across 10 consecutive sessions. The MFI has not posted a meaningful bounce during this fall — each session has printed lower than the last.
Want more token insights like this? Sign up for Editor Harsh Notariya’s Daily Crypto Newsletter here.
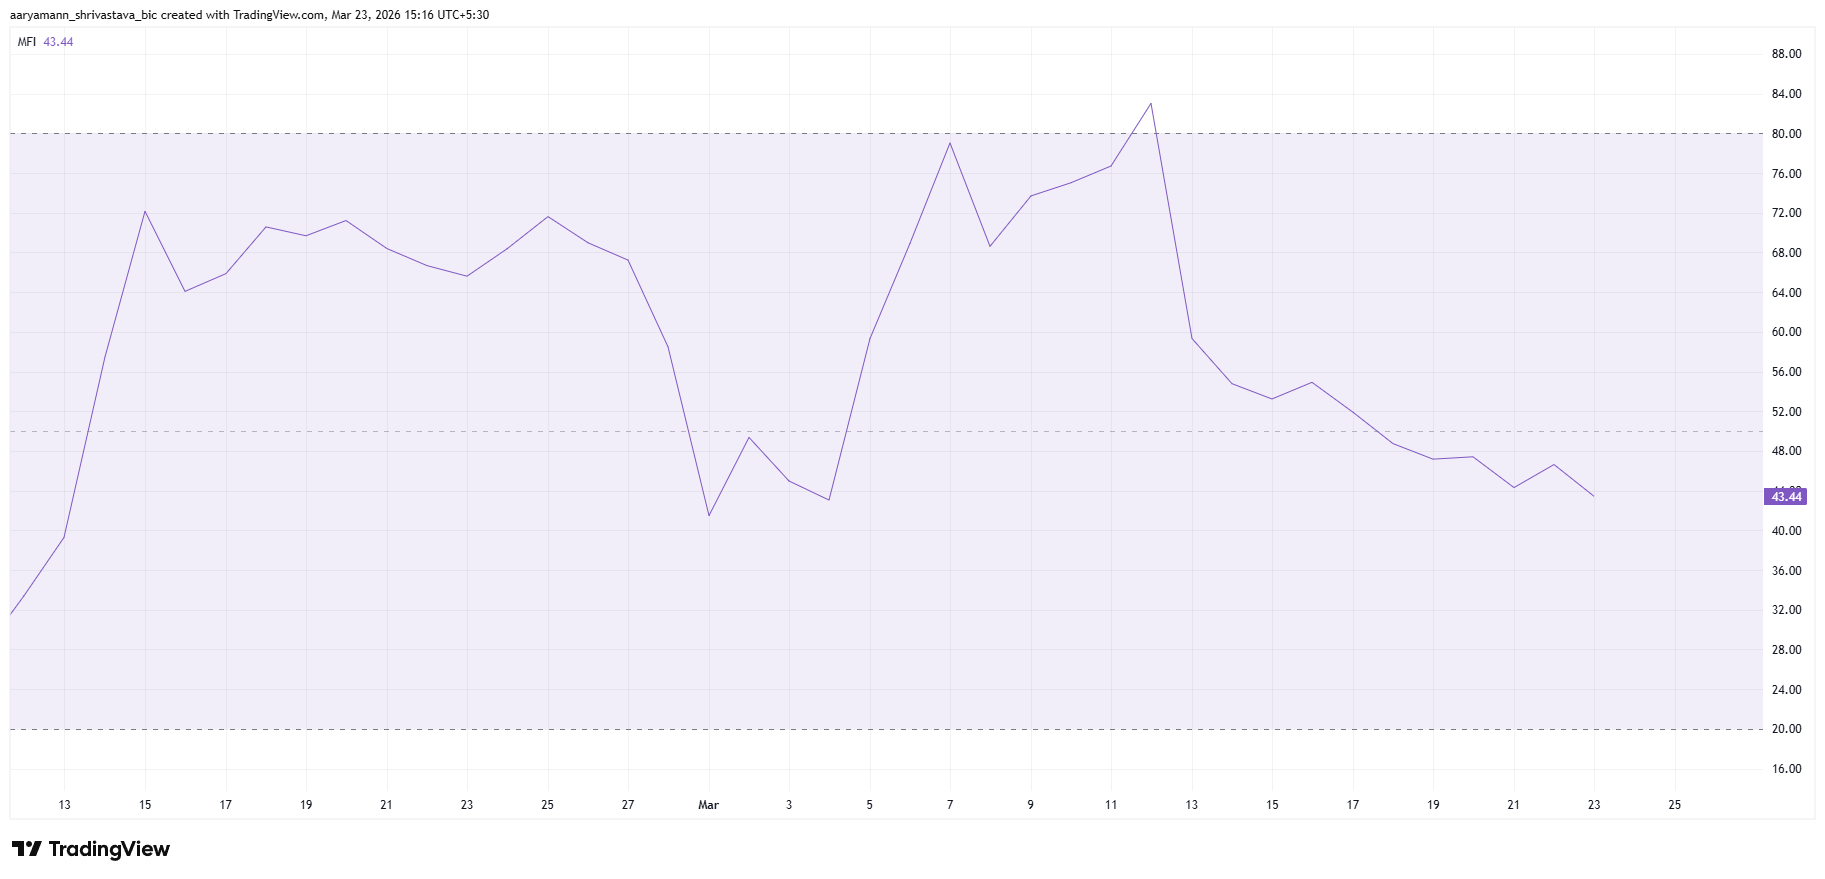
A reading of 43.44 sits near the midpoint of the neutral zone. A drop below 40 would tip the indicator into outflow-dominant territory. The last time MFI was this low during the current chart period — around late February — PI was trading near $0.16.
Bitcoin Correlation Turns Negative for the First Time Since February
Pi Coin’s correlation to Bitcoin has flipped to -0.27, entering negative territory for the first time since late February. The shift is marked by a pink zone on the chart beginning around March 19.
Through early and mid-March, the coefficient ran as high as +0.65, meaning PI was broadly tracking Bitcoin’s moves. That relationship has now inverted. At -0.27, PI is moving against Bitcoin rather than with it.
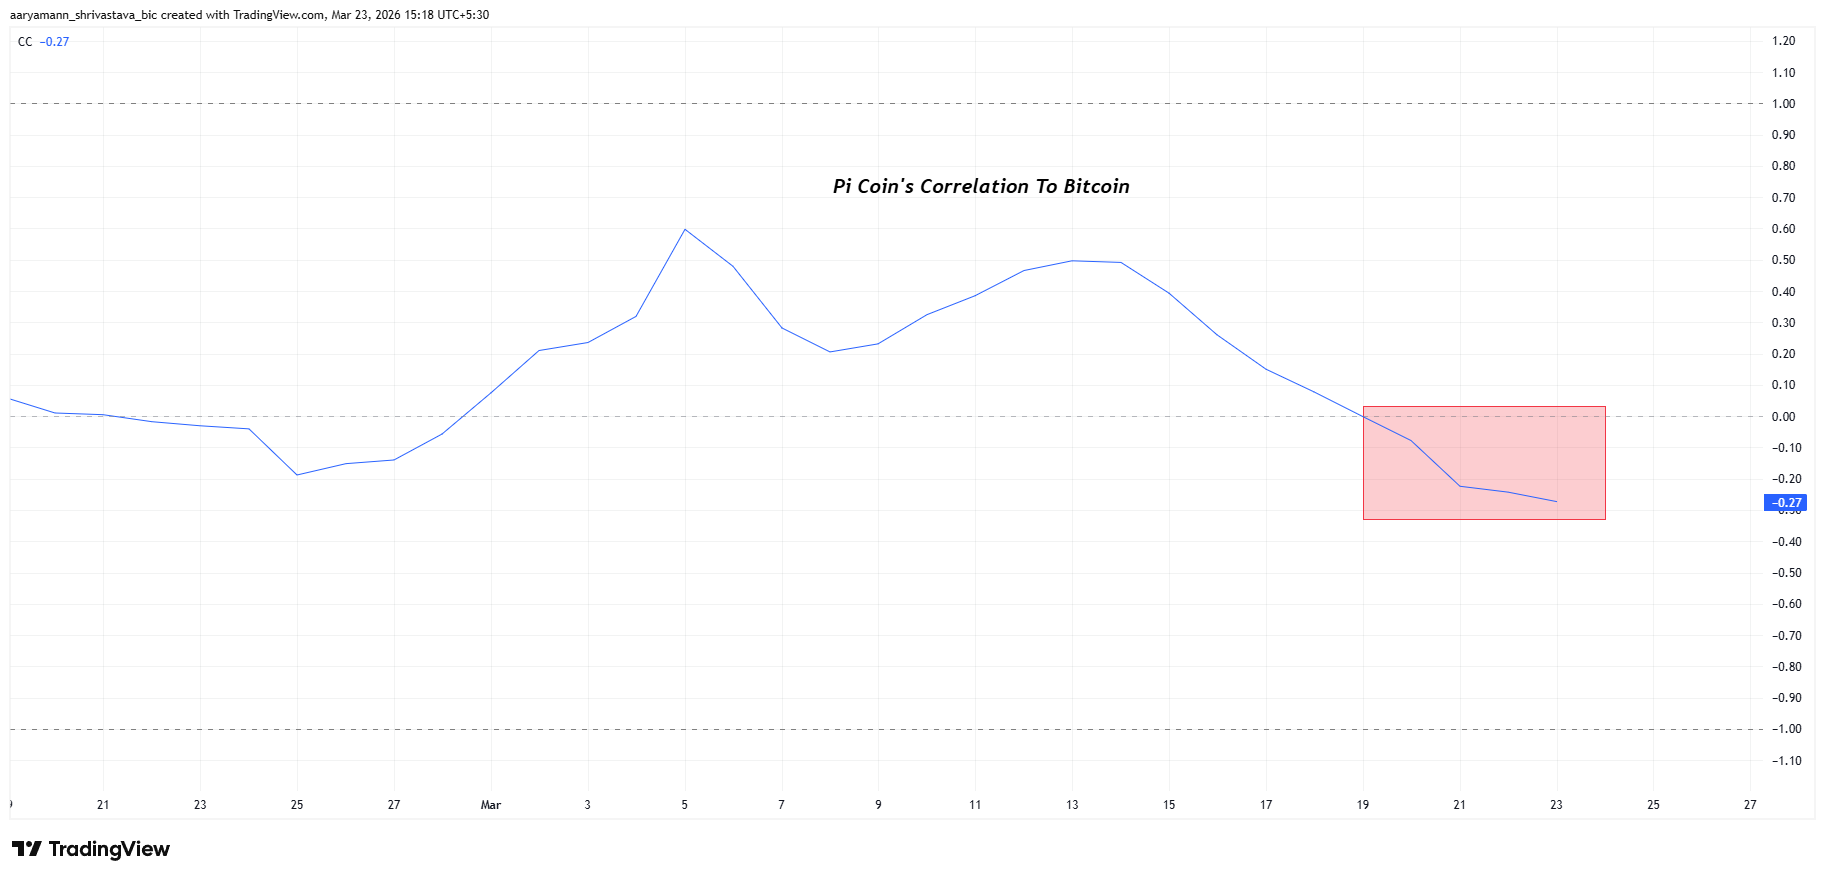
The practical consequence is direct. If Bitcoin rallies over the coming days, PI will not automatically benefit. The token is being driven by its own internal selling pressure rather than broader market flows. This removes the most common escape valve for bearish setups in altcoins.
Pi Coin Price Faces Crash
Pi Coin price trades at $0.1897 on the daily chart, pressing against the 0.236 Fibonacci level at $0.1894 after a 33.11% collapse from the March 13 high at $0.2990. The EMA at $0.1940 now sits above the price as resistance. Price remains inside a descending channel structure visible across the right side of the chart.
PI’s failure to reclaim the EMA at $0.1940 sustains the bearish case, with the next meaningful support at the Fibonacci zero baseline of $0.1555. A modest negative correlation of 0.27 with Bitcoin limits upside contagion from any BTC recovery, while rising selling pressure seen through consecutive distribution candles since March 13 favors further downside. The $0.1597 horizontal level marks the first target, followed by $0.1527 and then $0.1415 — both visible as labeled support zones on the chart.
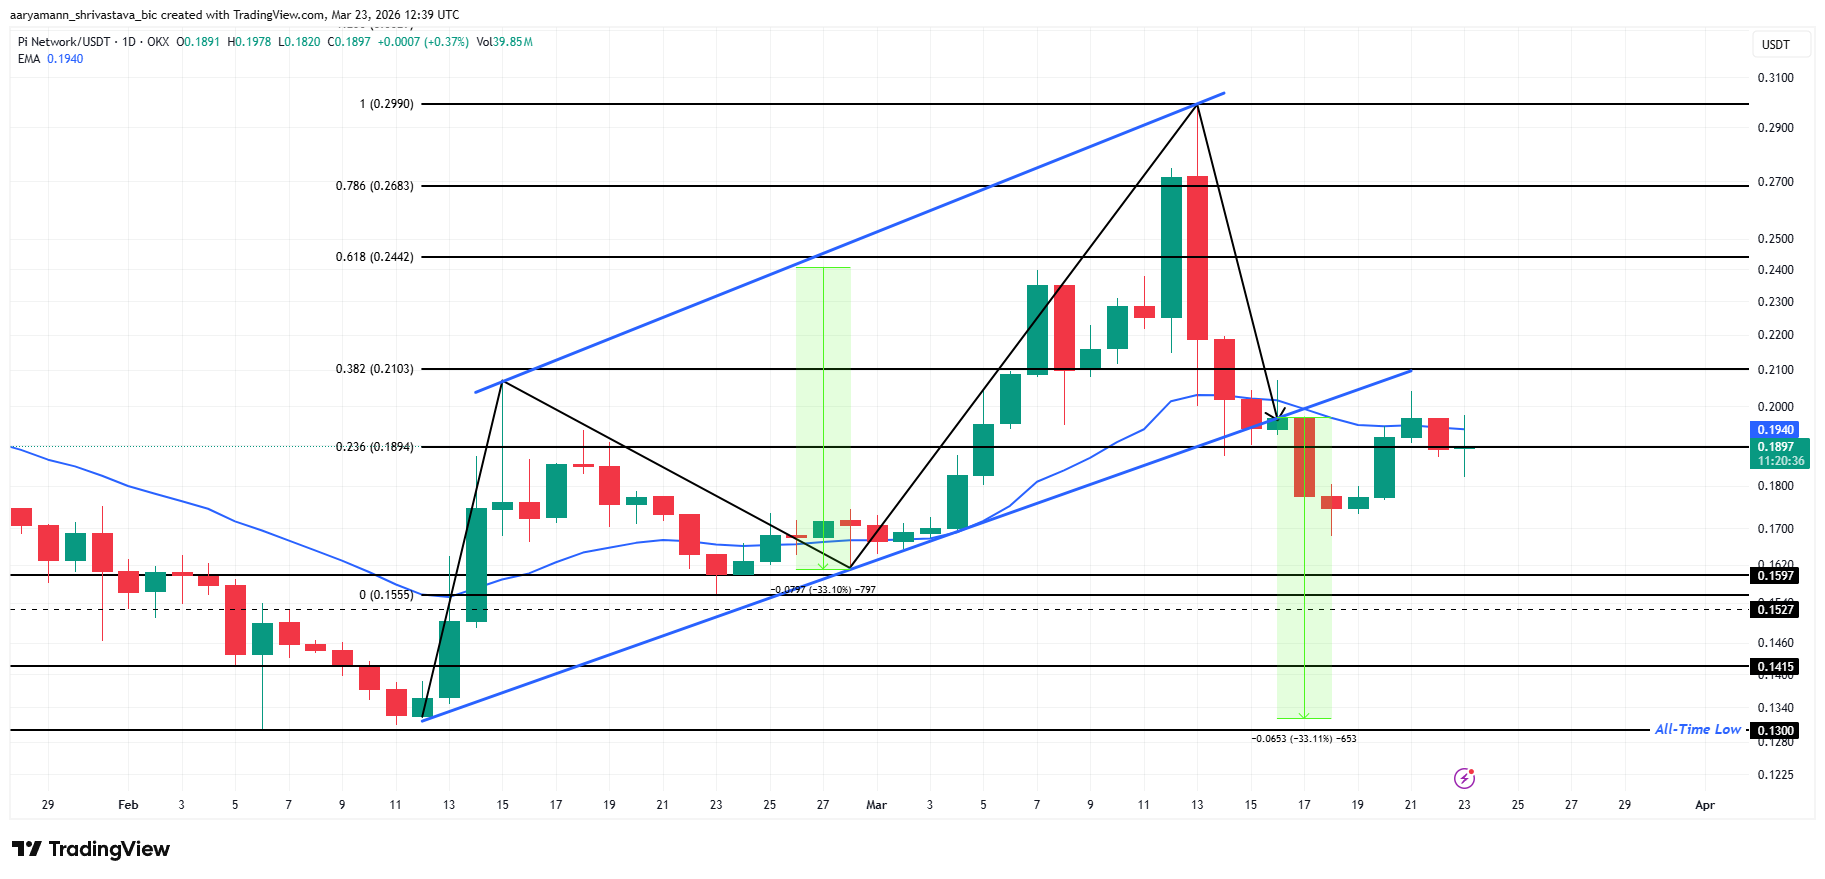
A daily close above the EMA at $0.1940 would challenge Pi Coin’s bearish structure and shift near-term momentum. Reclaiming $0.2103, the 0.382 Fibonacci retracement, would invalidate the thesis entirely and reopen the path toward $0.2442. Until either level is breached on a closing basis, the all-time low at $0.1300 remains a credible downside extension if $0.1415 gives way.
The post Pi Coin Price at All-Time Low: Only If This 33% Crash Pattern Is Validated appeared first on BeInCrypto.