The crypto market traded $20.57 trillion in Q1 2026, but declining volumes and concentrated liquidity told a story of cautious recovery, not euphoria.
A new quarterly research report from CoinGlass breaks down how capital, trading activity, and market depth shifted among exchanges during the first three months of the year. The findings paint a picture of a market still digesting the aftershocks of late 2025.
A Market Still Healing From Q4’s Crash
Q1 2026 unfolded against a difficult backdrop. The October 2025 tariff shock triggered $19 billion in liquidations within 24 hours, the largest single-day deleveraging event in crypto history.
Bitcoin (BTC) declined roughly 35% from its all-time high above $126,000, and open interest across exchanges dropped more than 40%.
By January, signs of stabilization had appeared. Total market volume for the quarter reached approximately $20.57 trillion, split between $1.94 trillion in spot and $18.63 trillion in derivatives.
However, each successive month saw lower totals. January posted the highest activity, and March fell to the quarterly low.
The derivatives-to-spot ratio held at roughly 9.6x throughout the quarter, slightly above the 2025 full-year average.
That ratio suggests traders preferred hedging and short-term positioning through futures rather than making directional spot bets.
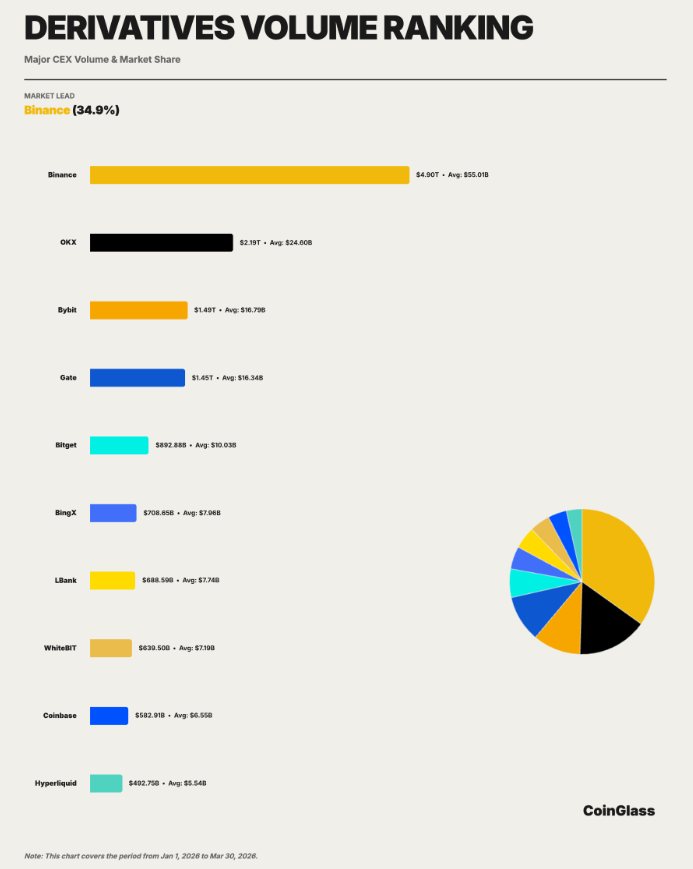
Binance’s Lead Extends Across Every Metric
The CoinGlass report measured exchanges across four dimensions, including trading volume, open interest (OI), order book depth, and user asset reserves. Binance ranked first in all of them.
In derivatives, Binance posted approximately $4.90 trillion in cumulative volume, a 34.9% share among the top 10 exchanges.
That figure exceeded the combined totals of OKX ($2.19 trillion) and Bybit ($1.49 trillion). In open interest, Binance averaged $23.9 billion daily, roughly 2.2 times second-ranked Bybit.
Liquidity depth told a similar story. In BTC futures, Binance’s average two-sided depth within 1% of the mid-price was approximately $284 million.
OKX followed at $160 million and Bybit at $76.55 million. The pattern repeated across BTC spot, ETH futures, and ETH spot markets. No single competitor matched Binance across all four sub-markets simultaneously.
The starkest gap appeared in user asset reserves. Binance held approximately $152.9 billion in custodial assets, accounting for 73.5% among the top 10 exchanges. OKX was a distant second at $15.9 billion. Gate, Bitget, and Bybit all fell within the $5 to $7 billion range.
That concentration far exceeds Binance’s share in trading volume or open interest. The CoinGlass report noted that asset retention reflects brand trust, product ecosystem breadth, and on/off-ramp convenience, making it a stronger indicator of long-term competitive position.
Hyperliquid Enters the Mainstream Conversation
One of the quarter’s most notable developments was the rise of Hyperliquid (HYPE), a decentralized derivatives protocol that posted approximately $492.7 billion in Q1 trading volume.
That placed it inside the top ten.
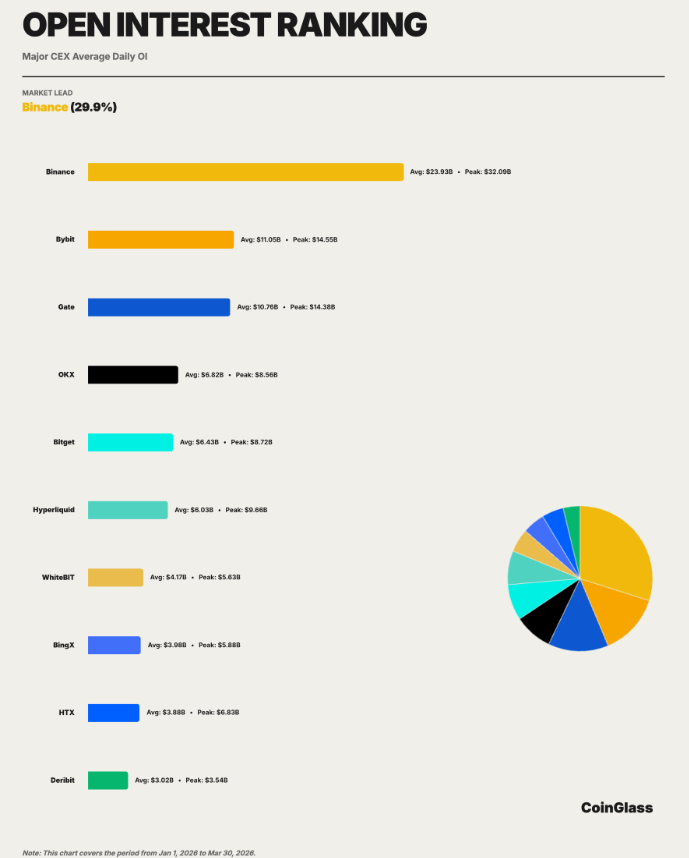
Its average daily open interest of roughly $6.0 billion, with a peak of $9.7 billion, drew close to that of centralized competitors like Bitget.
The growth validated what CoinGlass’s 2025 annual report had predicted, that decentralized derivatives were transitioning from proof-of-concept to actual market share competition.
JPMorgan flagged Hyperliquid in a March report, noting that demand for round-the-clock access to traditional assets was driving decentralized exchange growth and taking share from mid-tier centralized platforms.
Grayscale also filed an S-1 for a HYPE ETF in March, seeking a Nasdaq listing.
For now, Hyperliquid’s scale remains significantly below the leading centralized exchanges.
However, its entry into the competitive arena adds pressure to second-tier platforms competing for derivatives market share.
What Comes Next
The CoinGlass report identified several variables to watch heading into Q2. These include:
- The Federal Reserve’s monetary policy path,
- Changes in BTC spot ETF fund flows, and
- The progress of regulatory framework implementation across major jurisdictions.
Q1 was not about a return to all-time highs. It was about recovery, concentration, and a shifting market structure that is drawing clearer lines between the platforms that attract capital and those that risk falling behind.
The post New Report Finds Where All the Money Went in Crypto’s Brutal Q1 appeared first on BeInCrypto.