
Ethena (ENA) price surged roughly 20% since March 24, touching highs near $0.109 as whale accumulation and a new DeFi yield opportunity on Aptos drew fresh capital into the ecosystem.
However, the rally has already shown signs of exhaustion. A long upper wick on the latest 12-hour candle, declining whale balances, and a hidden bearish divergence suggest that the move may have been a profit-booking exercise rather than the start of a sustained recovery.
Whales Accumulated 120 Million, Then Started Pulling Back
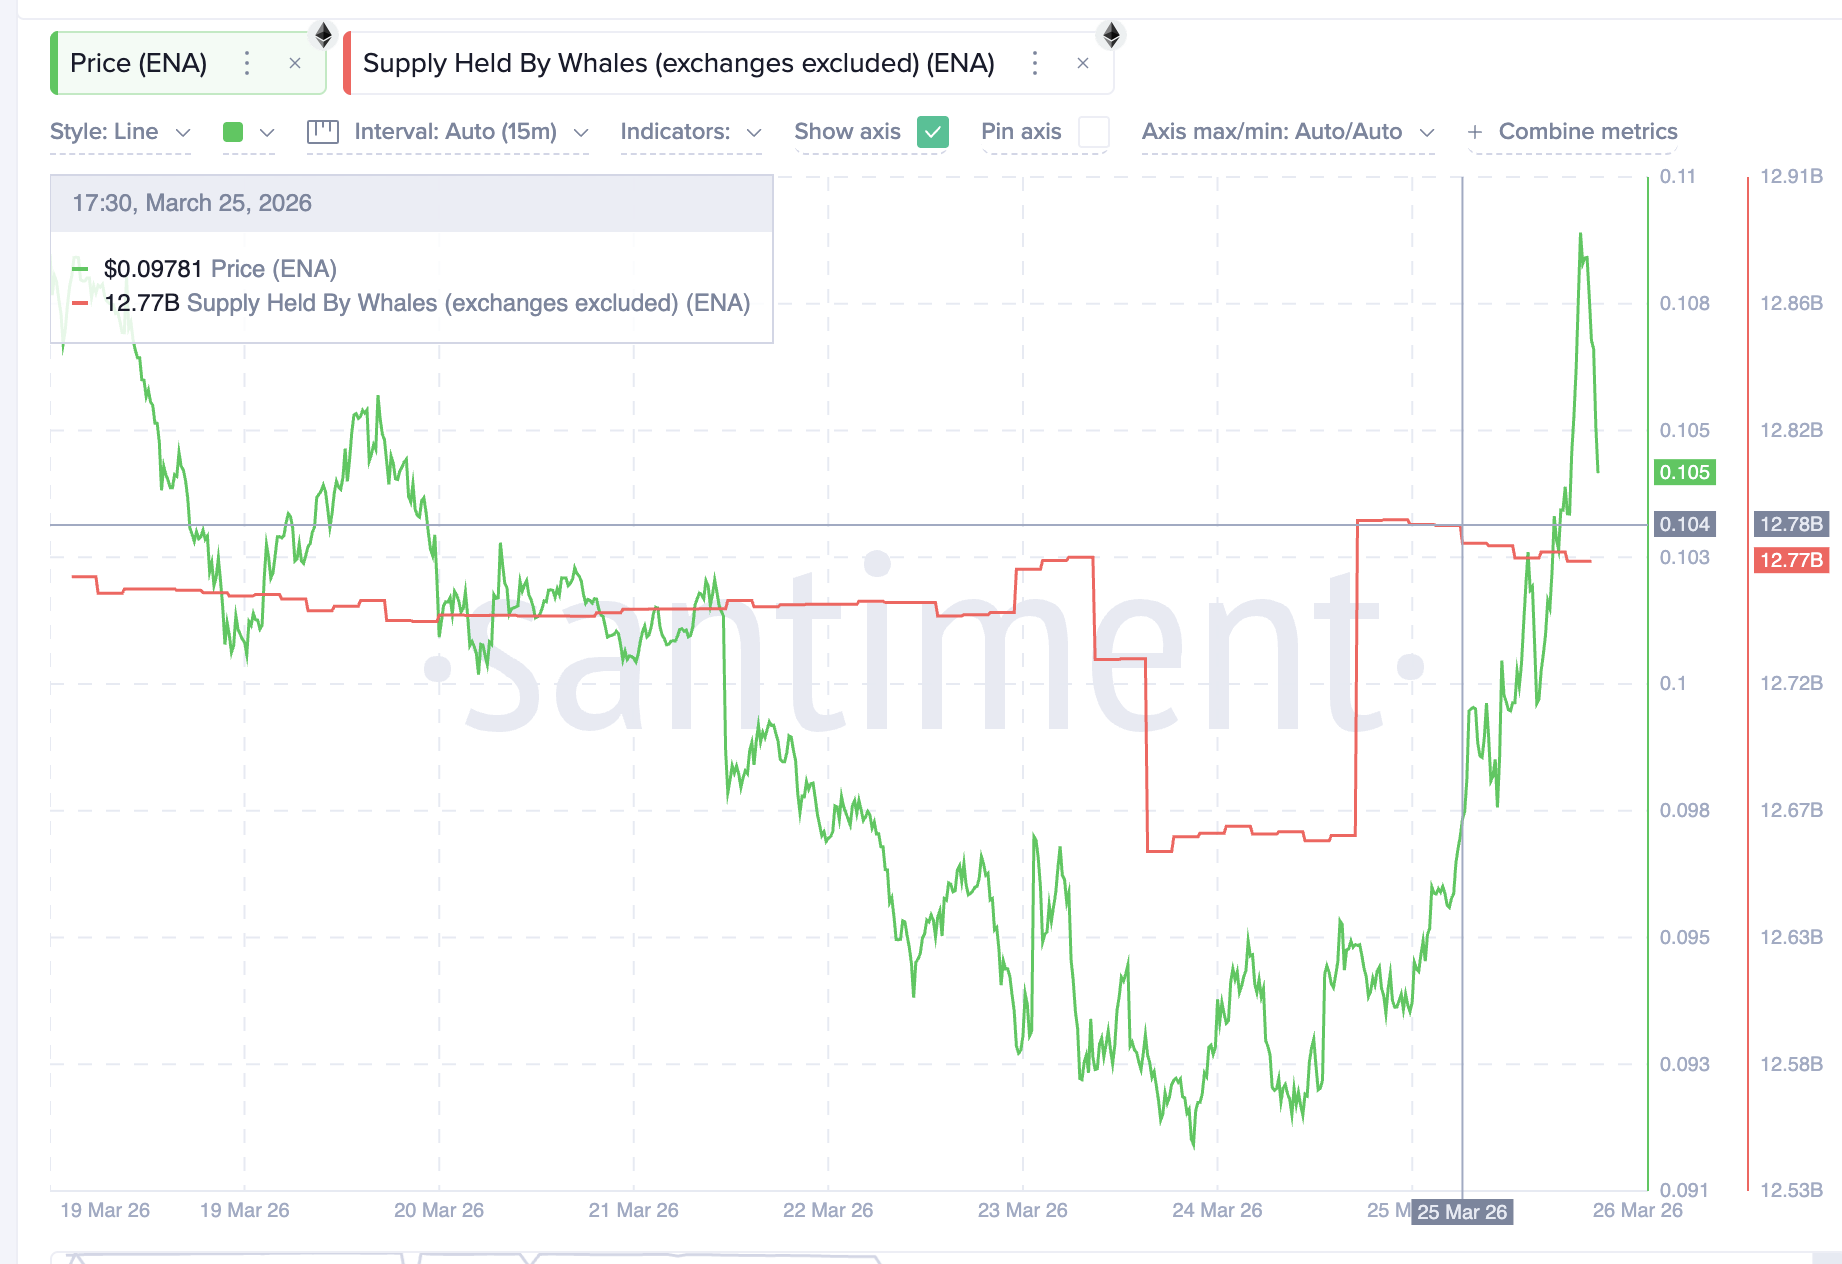
Whale wallets, excluding exchange addresses, began adding ENA aggressively on March 24. By March 26, that balance had climbed to 12.78 billion, an addition of roughly 120 million ENA in just three days.
The timing aligns with a catalyst. A new sUSDe-USDC liquidity pool on Aptos, launched via Hyperion, attracted over $11 million in total value locked within its first 24 hours. The pool offered a 59.2% APY with a 30x Sats multiplier, turning staked USDe into a high-yield DeFi primitive.
That demand for sUSDe flows directly back to the Ethena price, as users must mint or acquire USDe and stake it to participate.
However, the accumulation appears to have peaked. Since reaching 12.78 billion, whale balances have begun declining, dropping to 12.77 billion.
On the 12-hour chart, the latest candle carries a prominent upper wick, meaning the price was rejected sharply after touching highs. When whale holdings peak and pull back at the same time as a wick rejection forms, it typically confirms that large holders used the rally to book profits.
This is not unusual for a token that has remained down roughly 50% over the past three months. Whales entering on a DeFi-driven pump and exiting near resistance is a classic short-term rotation. The question is whether the remaining buyers can hold the line.
The 12-hour Relative Strength Index (RSI), a momentum signal, suggests they may struggle. Between February 26 and March 26, the Ethena price seems to be forming a lower high while the RSI is close to confirming a higher high. That hidden bearish divergence points to a continuation of the broader downtrend.
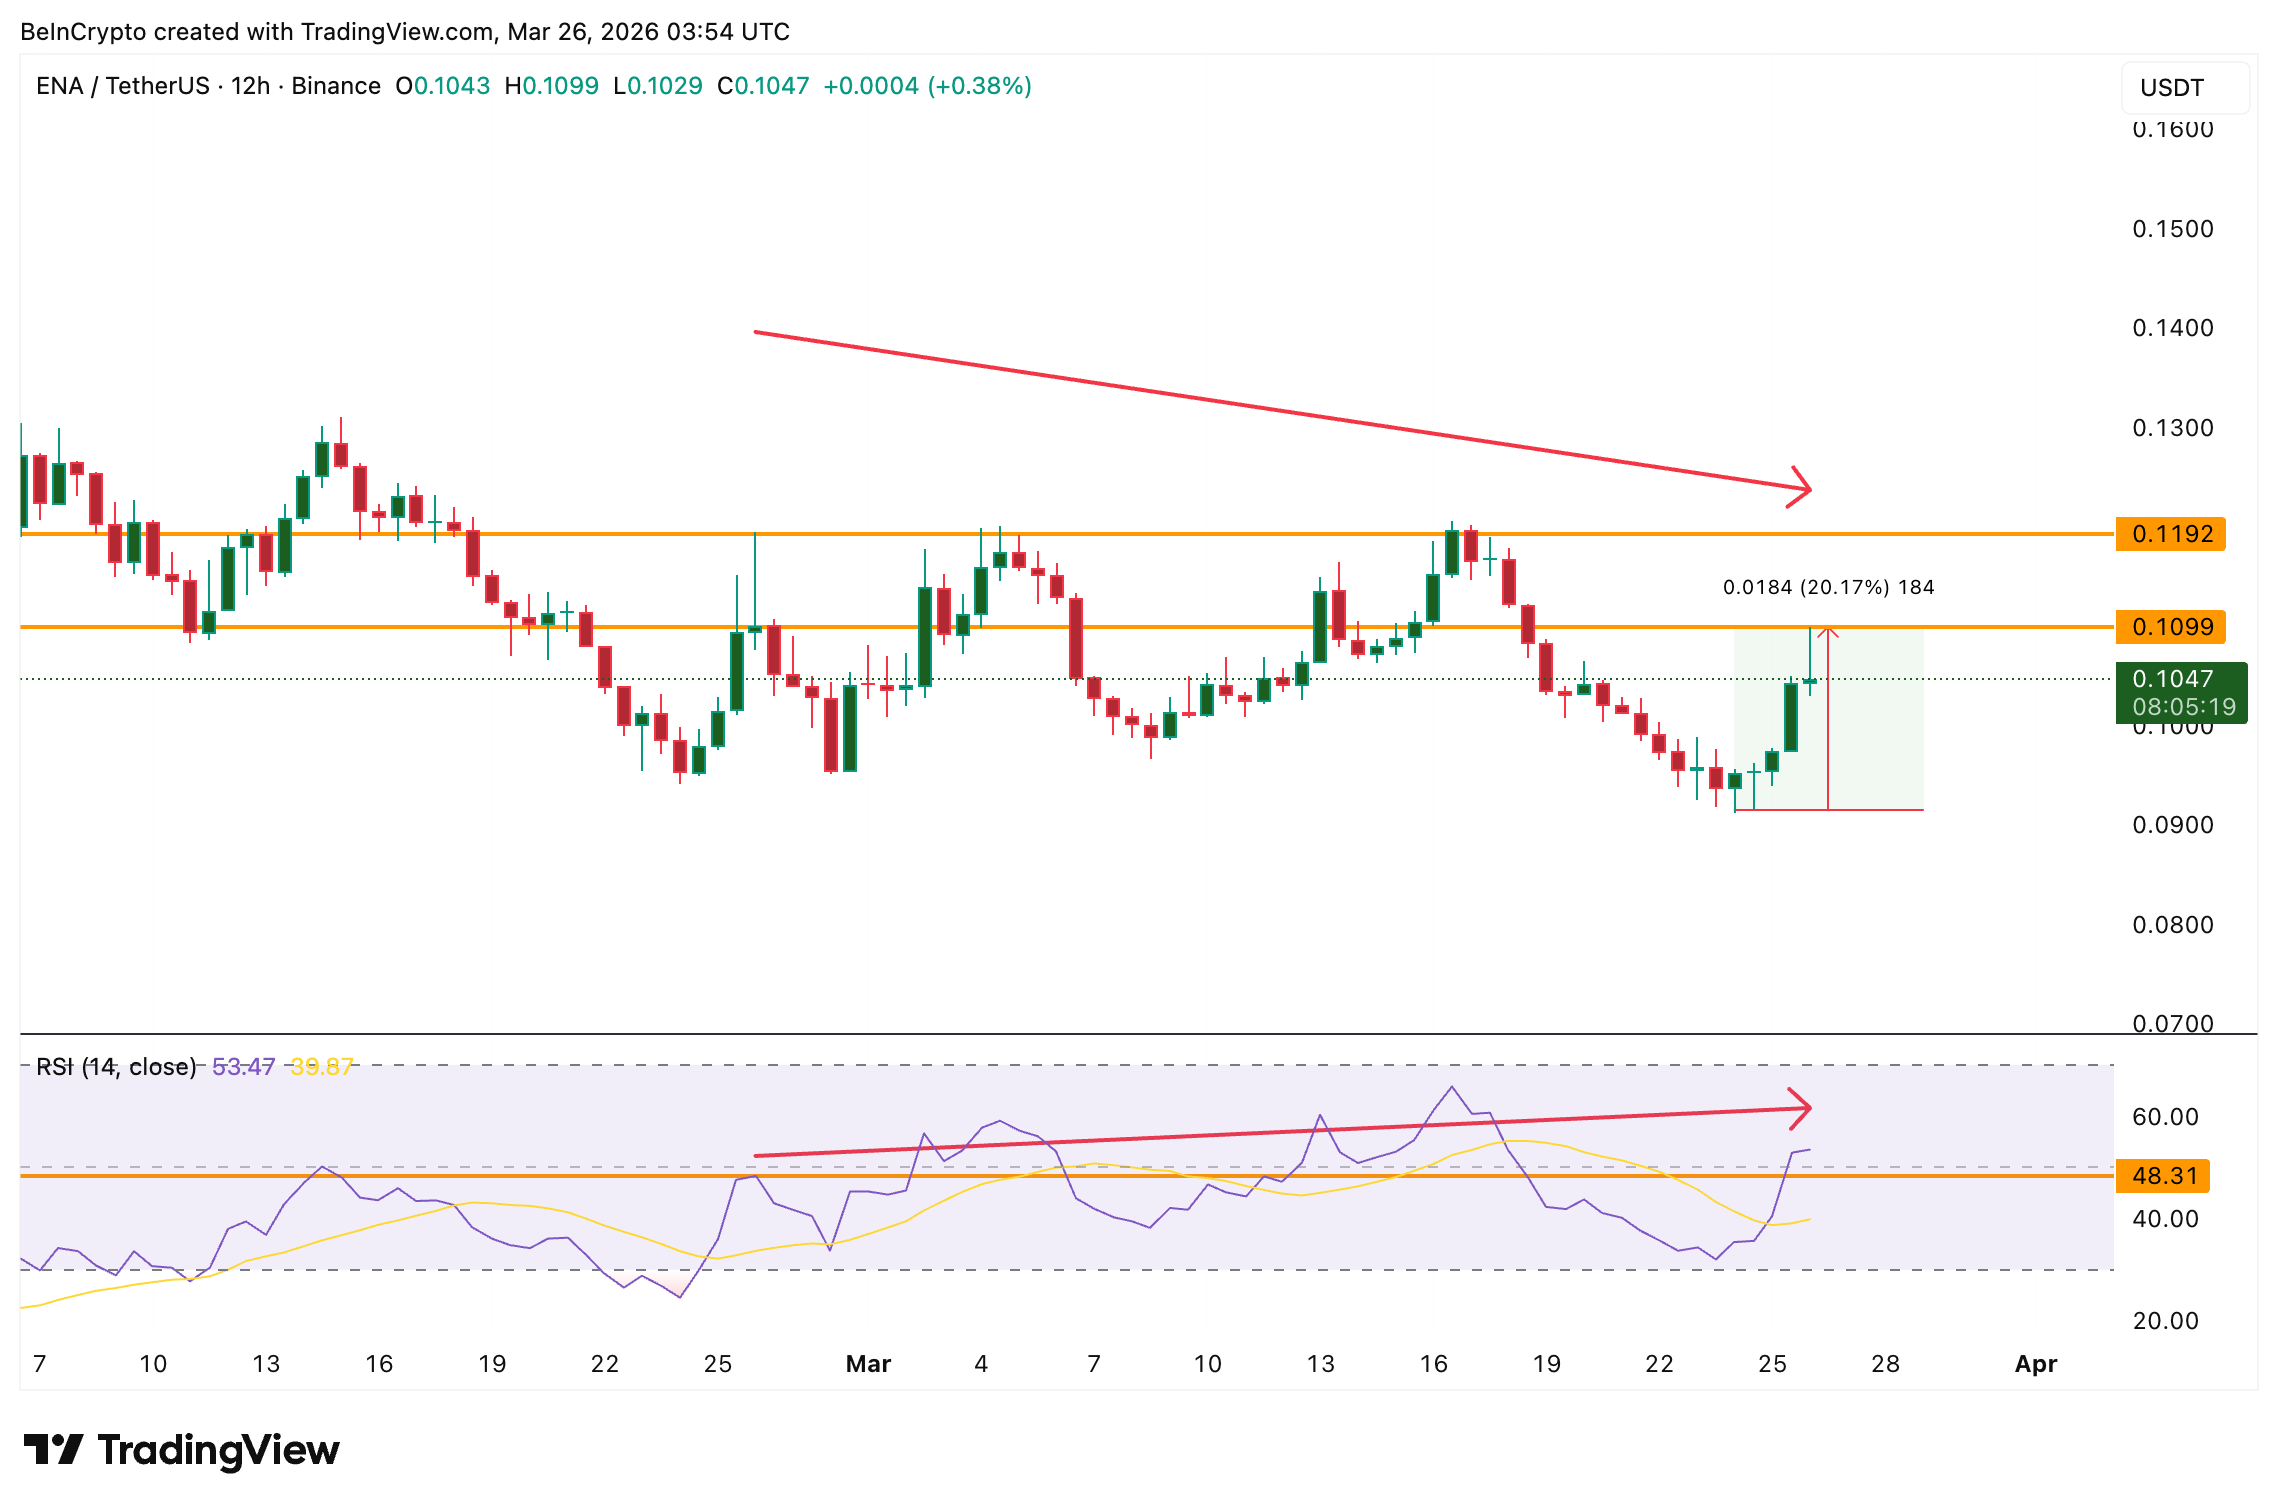
The structure confirms if the next 12-hour candle closes below $0.109. It only invalidates above $0.119, the previous swing high.
Long Leverage Tilts the Risk Lower
The Bybit ENA/USDT perpetual liquidation map over the past seven days (active positions) reveals a heavily long-biased market. Cumulative long liquidation leverage stands at $7.51 million against just $3.12 million in shorts. The rally attracted leveraged buyers, and if the price reverses, those positions become fuel for a downside cascade.
Want more token insights like this? Sign up for Editor Harsh Notariya’s Daily Crypto Newsletter here.
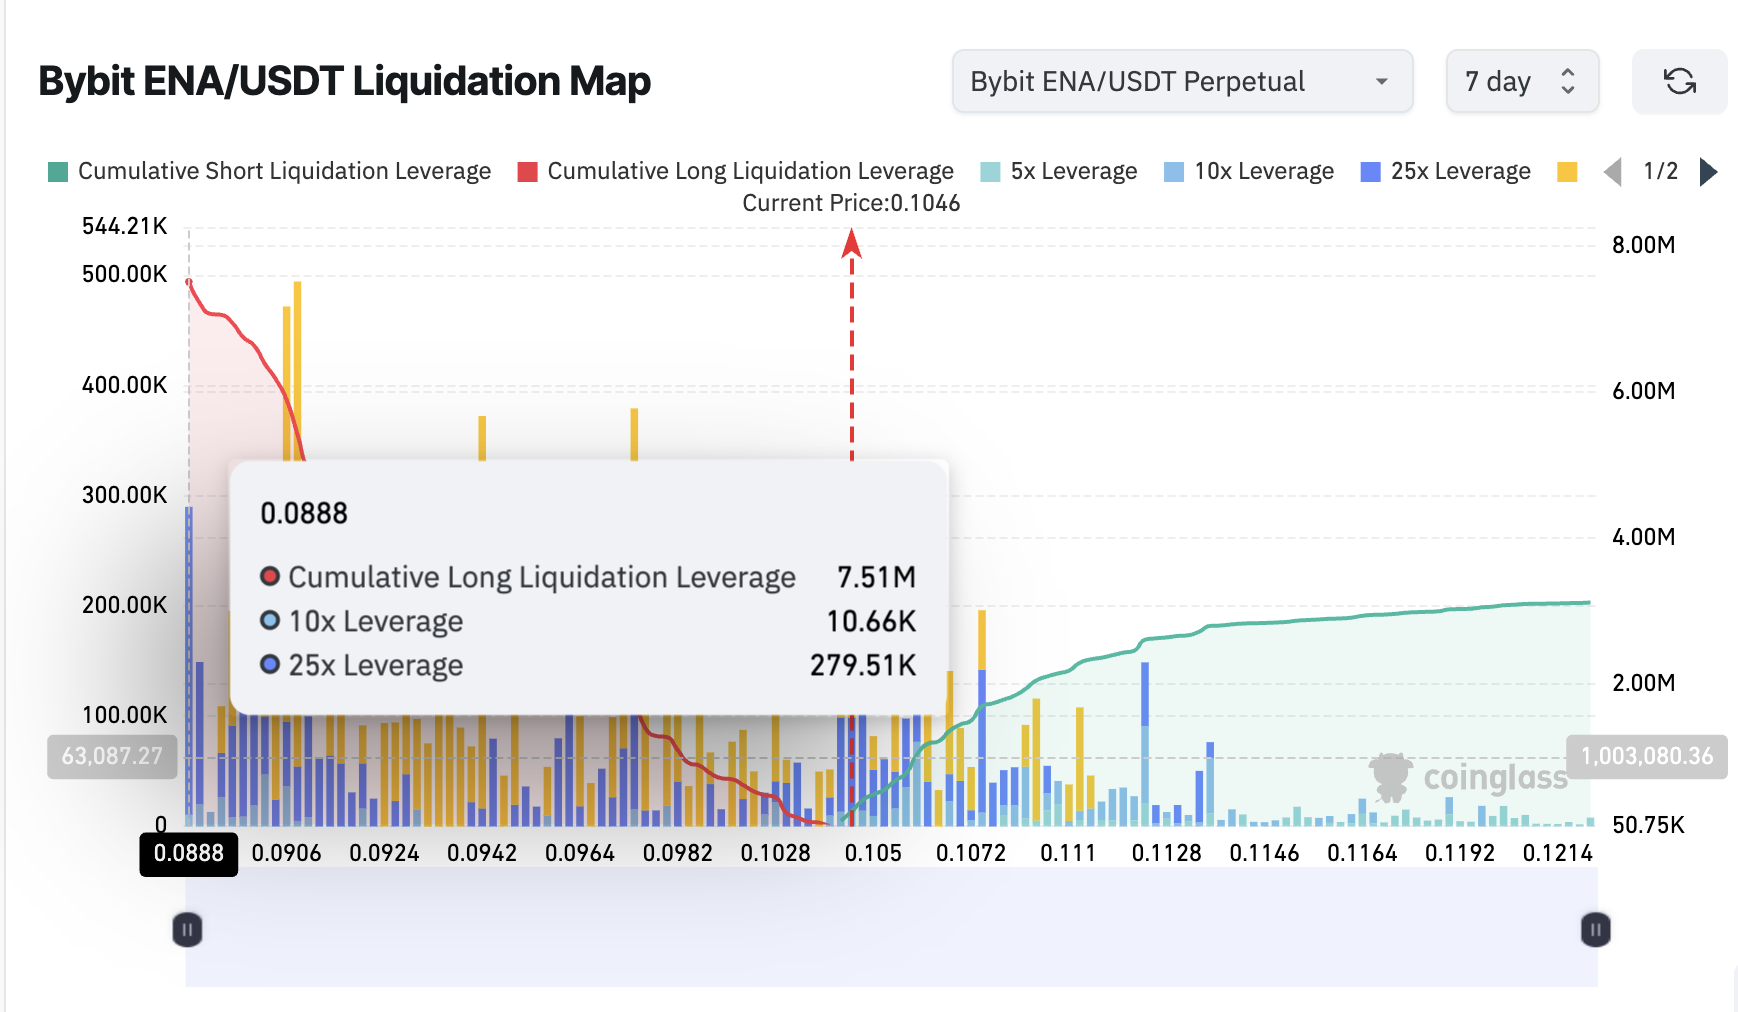
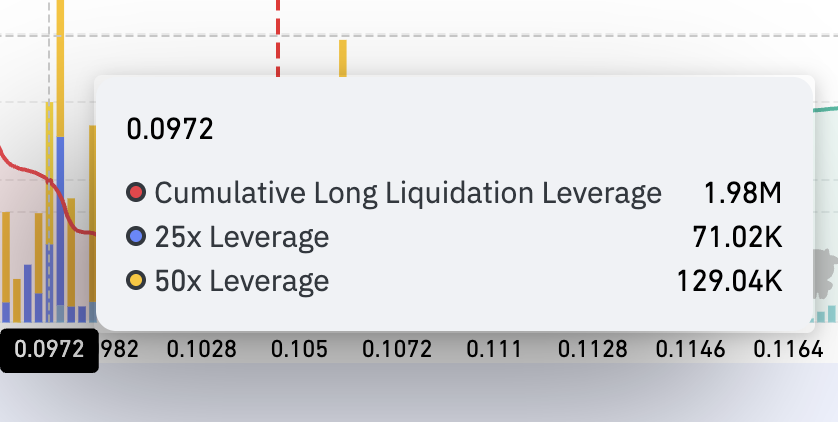
One of the densest near-term long liquidation clusters sits near $0.097, where roughly $2 million in positions would get triggered. A move into those zones would quickly liquidate overleveraged longs.
With whales already trimming, divergence forming, and leverage tilted long, the derivatives market aligns with on-chain data, pointing toward near-term caution.
Ethena Price Forecast and the $0.106 Test
The 12-hour chart shows that $0.106 has acted as a strong resistance. This level rejected the Ethena price on March 20 and again on the current candle. A 12-hour close above that level is the minimum requirement for the rally to continue. A move above $0.120 would confirm strength and invalidate the hidden bearish divergence flashing on the chart.
On the downside, $0.102 is the first line of defense. That level aligns with where the majority of long liquidations begin to cluster on the 7-day map. A break below $0.102 would likely trigger a chain reaction through $0.097. This is where a $2 million liquidation pocket sits, and potentially down to $0.091.
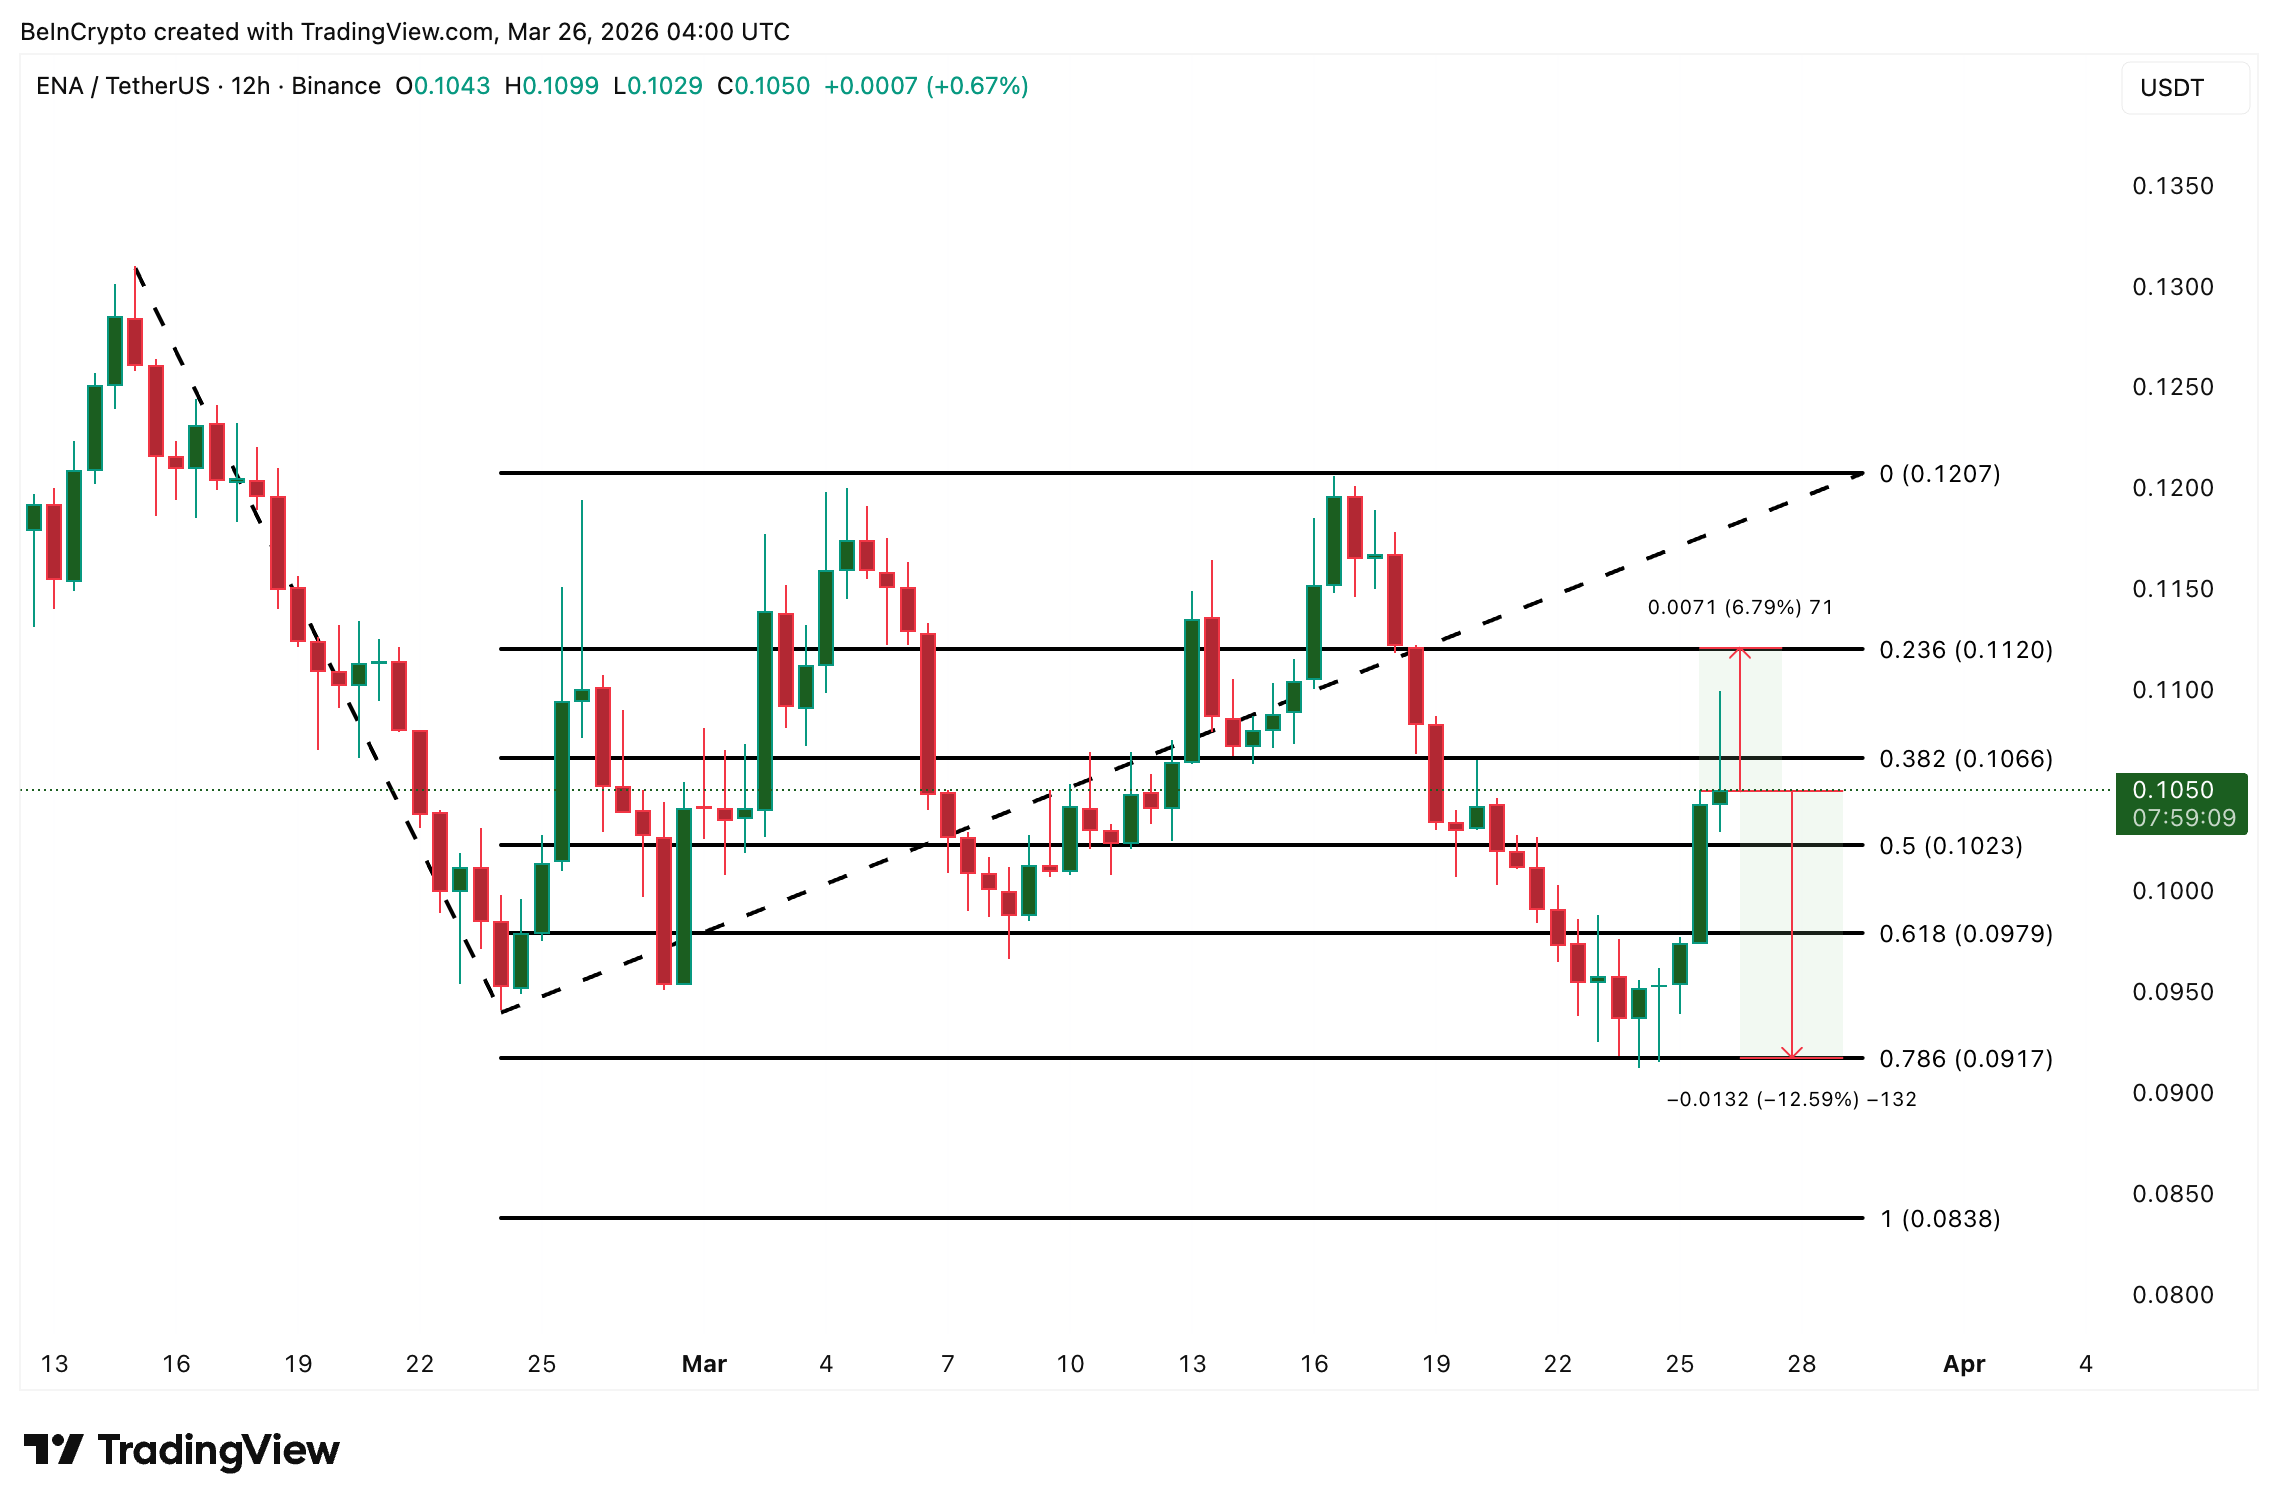
For now, $0.106 separates a continuation of the DeFi-driven bounce from a liquidation-fueled pullback to $0.091.
The post Ethena Price Up 20% on sUSDe Yield Frenzy, but Whales Could be Booking Profits appeared first on BeInCrypto.