
The Cardano price flashed a textbook bullish divergence on the daily chart, surged 24%, then collapsed. On-chain data reveals a coordinated whale exit worth over $540 million into the rally — even as the Money Flow Index confirmed retail was actively buying the dip.
Here’s what happened, and what it means next.
Daily RSI Divergence Fired & MFI Confirmed the Move
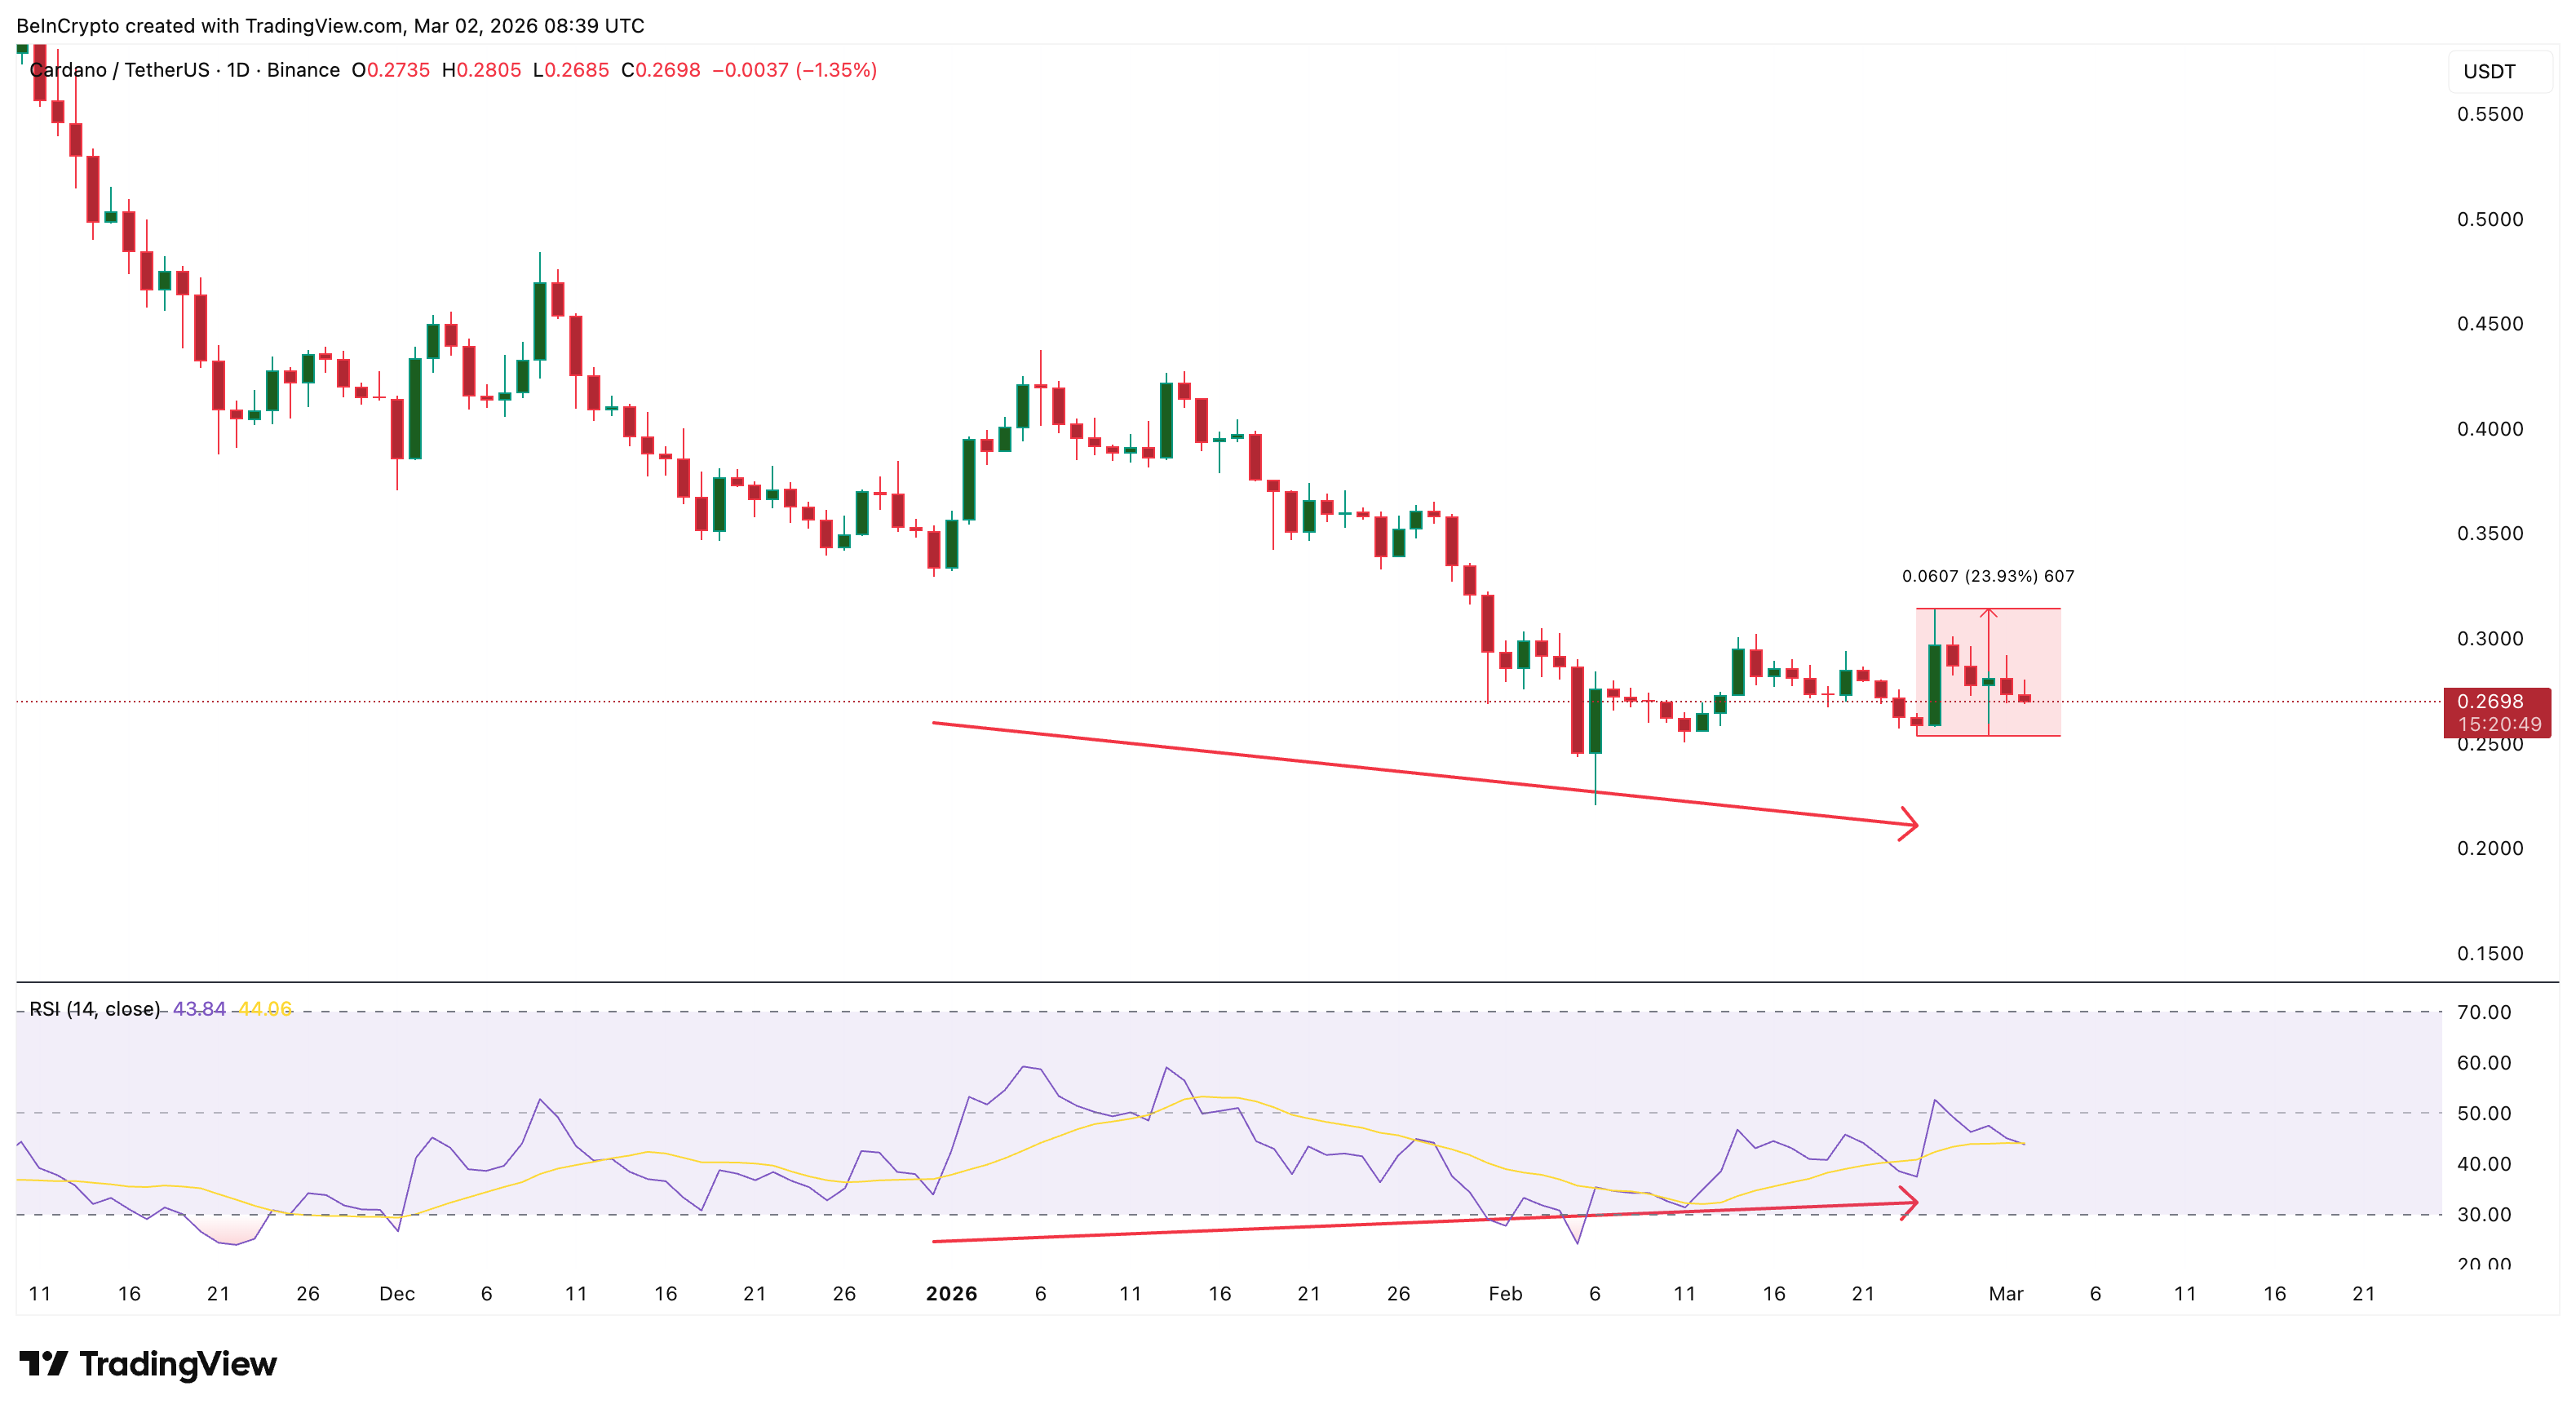
Between December 31, 2025, and February 24, 2026, ADA’s daily chart built a bullish divergence. The Cardano price printed a lower low, between the late-December range and the February 24 low. Meanwhile, the Relative Strength Index (RSI), a momentum oscillator, formed a higher low.
When price makes a lower low but RSI makes a higher low, it signals that bearish momentum is weakening even as price continues to fall.
The signal resolved on February 25 when ADA surged nearly 24%, briefly touching $0.31 before posting a long upper wick — a candlestick structure indicating aggressive selling into the highs.
Want more token insights like this? Sign up for Editor Harsh Notariya’s Daily Crypto Newsletter here.
What makes this setup more interesting is that the Money Flow Index backed it up. The MFI is a volume-weighted momentum indicator that combines both price and volume to measure buying and selling pressure, scored from 0 to 100. Unlike the RSI, which only considers price, MFI factors in trading volume — making it a more direct proxy for whether real capital is flowing into or out of an asset.
Between February 24 and 28, both price and MFI trended higher together. There was no bearish MFI divergence. This means the dips were being genuinely bought with volume conviction, not just price drifting upward on thin liquidity. Someone was actively absorbing sell pressure.
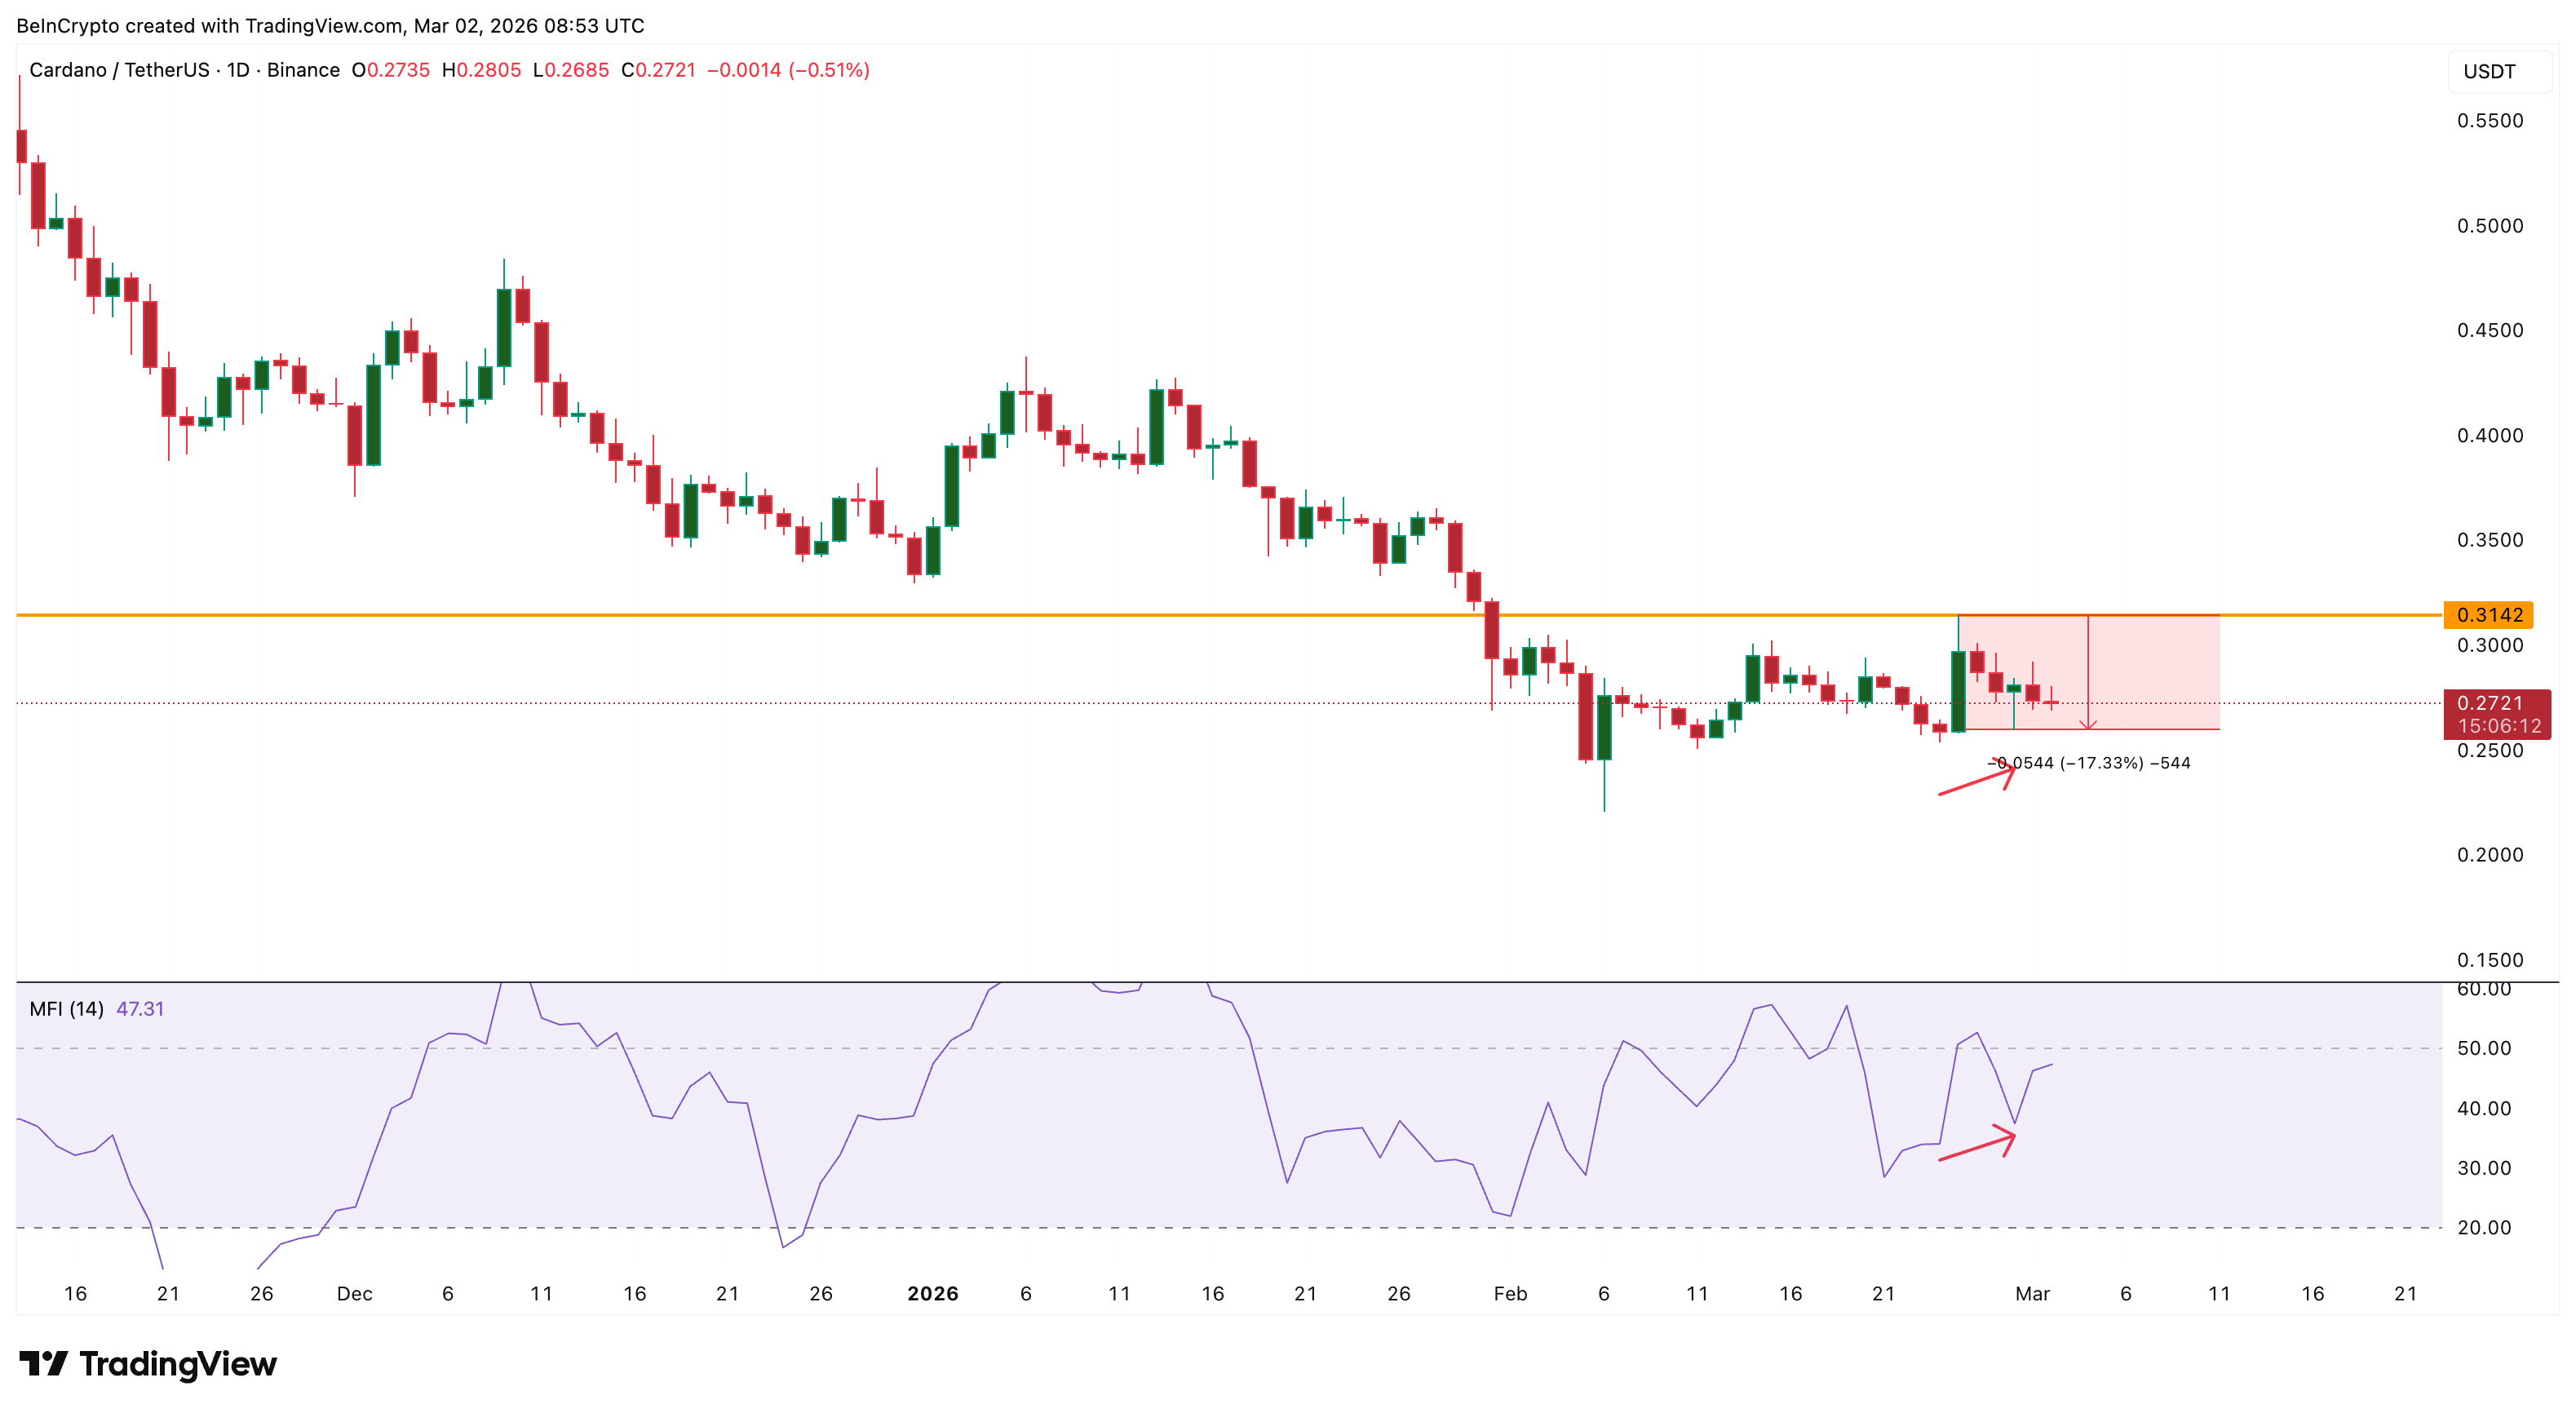
So the RSI divergence fired. MFI confirmed genuine buying support. ADA jumped 24%. And yet, from that February 25 peak, the price fell 17% within days. If the technical setup was valid and dip-buying was real, what killed the rally?
Over 2 Billion ADA Distributed in 3 Days: The Whales Were the Sellers
The answer is on-chain. Santiment’s supply distribution data reveals that between February 24 and 27, every major whale cohort reduced its holdings simultaneously.
The 1 billion-plus ADA cohort executed the largest single exit. It shed roughly 1.02 billion tokens in a single day between February 24 and 25 — dropping from 2.90 billion to 1.88 billion ADA.
The 100 million to 1 billion cohort initially picked up tokens on February 24, likely absorbing some of that initial sell, but then reversed aggressively by February 27, dropping from 3.47 billion to 2.61 billion ADA — a reduction of approximately 860 million tokens.
The 10 million to 100 million cohort shed around 220 million ADA over the same window, declining from 13.90 billion to 13.68 billion. Even the smallest whale tier, the 1 million to 10 million holders, reduced from 5.69 billion to 5.64 billion, offloading roughly 50 million tokens.
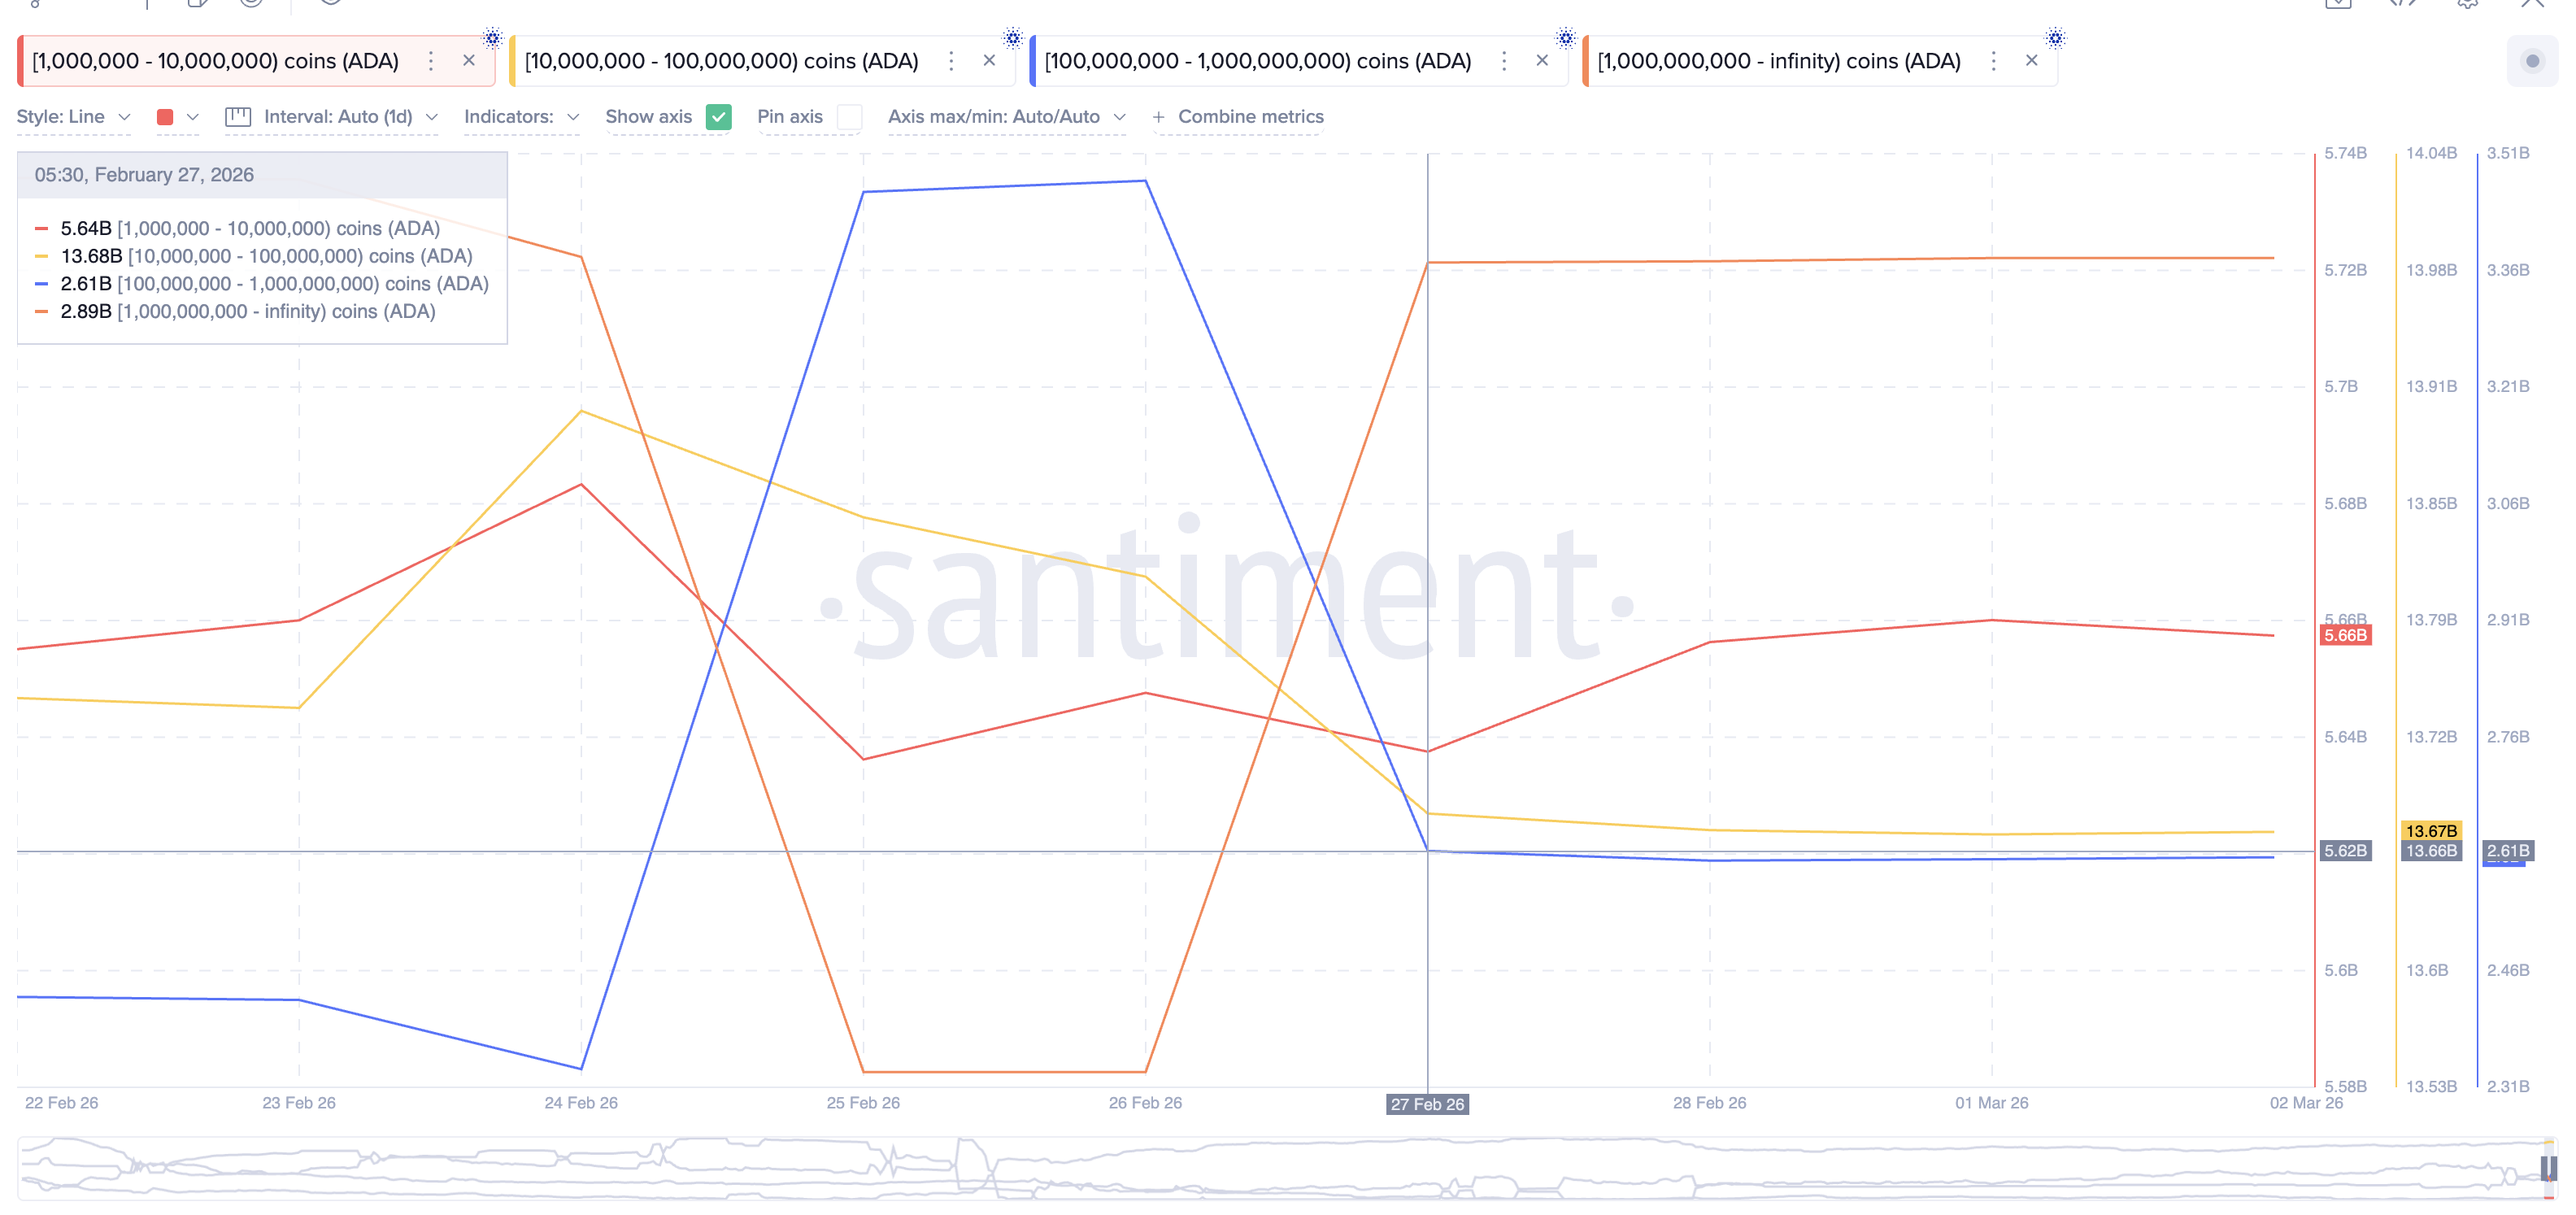
In total, approximately 2.15 billion ADA was distributed across all four cohorts within three days. At the average price of roughly $0.27 during this window, that amounts to approximately $540 million in concentrated sell pressure — all hitting the market during a rally that retail was actively buying into.
This is why the MFI data is so revealing. The MFI confirmed genuine buying support. The whale data confirms where the selling came from. Retail and mid-tier addresses were absorbing whale supply on the way up, but $540 million in distribution over 72 hours simply overwhelmed that demand.
Derivatives Data Adds Weight To ADA Breakdown
The derivatives market reinforces this picture. Cardano’s futures open interest had already collapsed from $1.95 billion September peak to below $450 million by mid-February. One of the lowest levels this year. This meant that leveraged retail had largely exited before the divergence even fired.
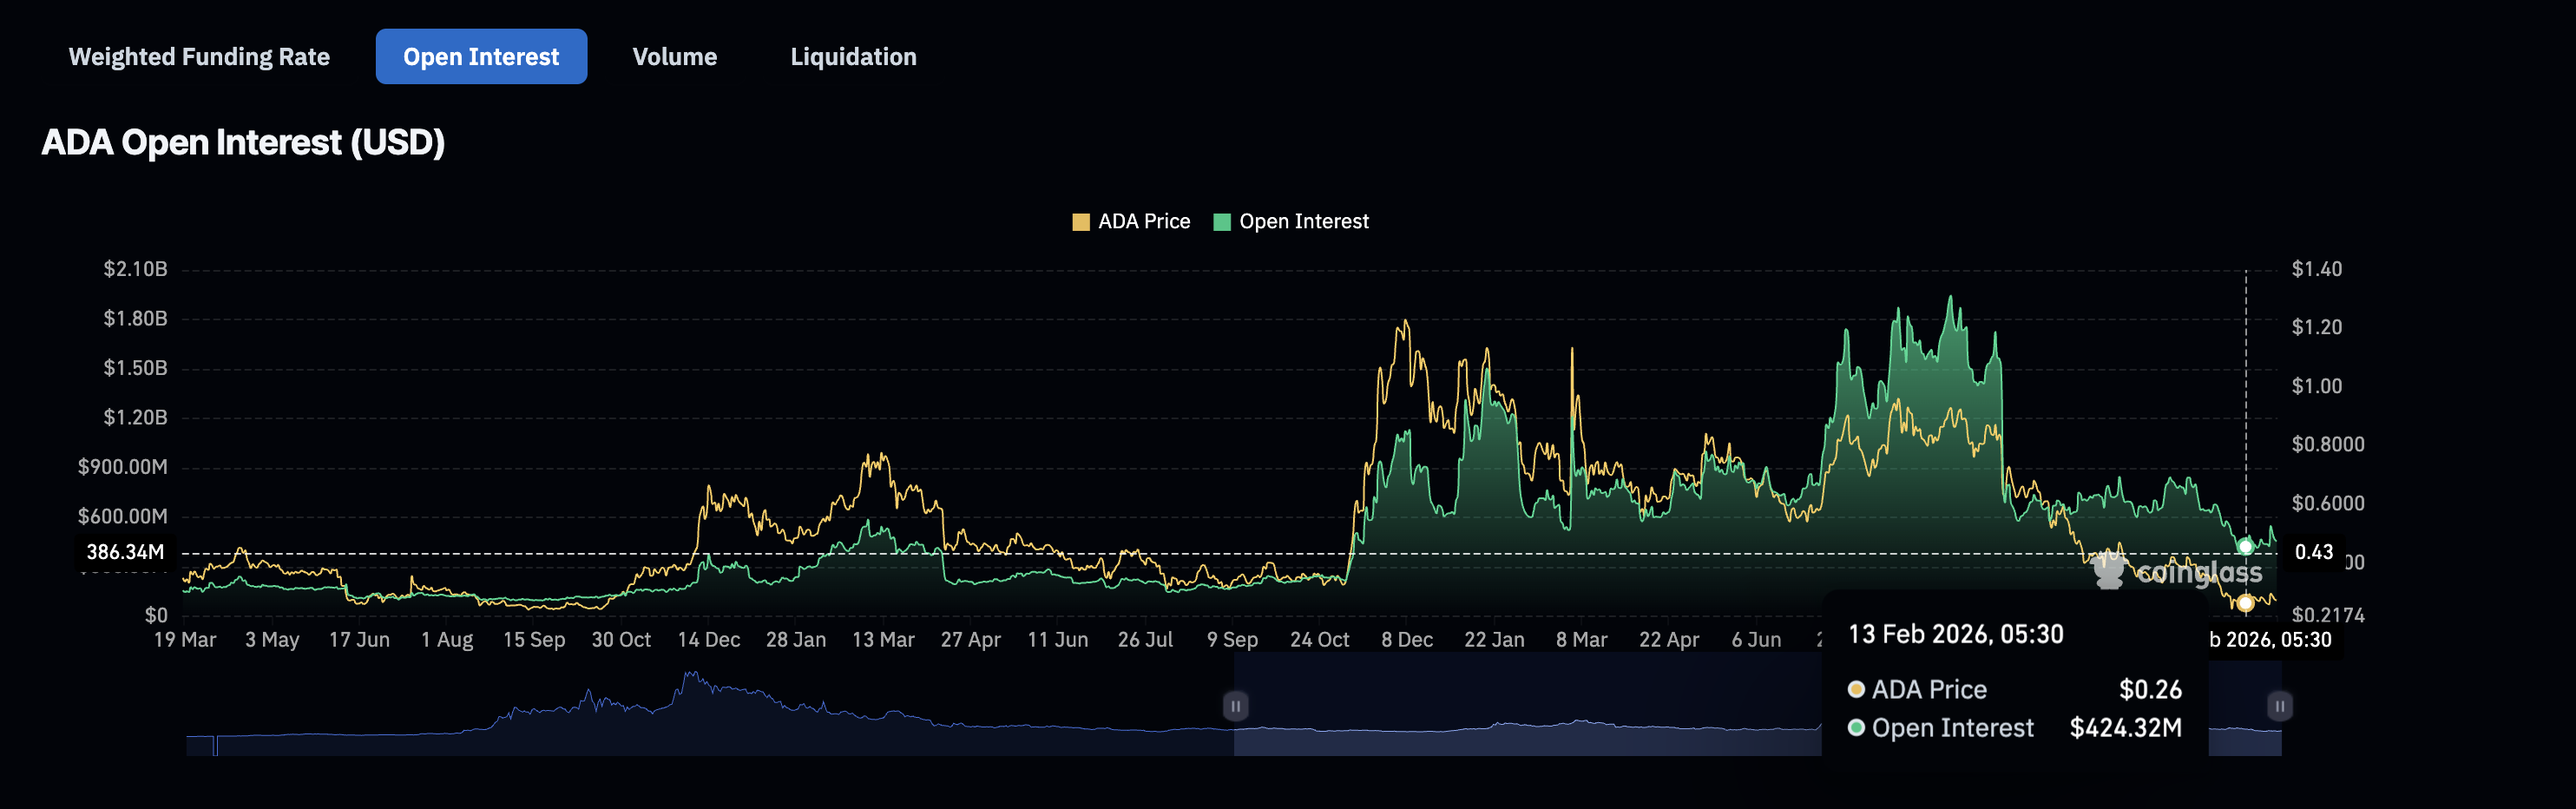
The buying MFI captured was therefore likely spot-driven: retail accumulating on the dip, using RSI divergence as conviction. But spot buying alone could not absorb the scale of whale distribution.
Cardano Price Action: Lower Lows Persist, Whale Re-Entry Becomes the Key Signal
ADA’s daily price structure remains lower as of March 2 (relative to late December), trading at $0.27, while the RSI continues to print higher lows (again relative to late December). This means the divergence framework is still technically alive, even after the late-February failure. A new swing low could trigger it again.
On the upside, $0.31 is the line in the sand. This was the exact rejection level on February 25. A daily close above this level would mark the first structural break in the downtrend, opening a path toward $0.37.
On the downside, a loss of $0.26 would confirm the weakness. Below that, the $0.23 and $0.21 levels become critical.
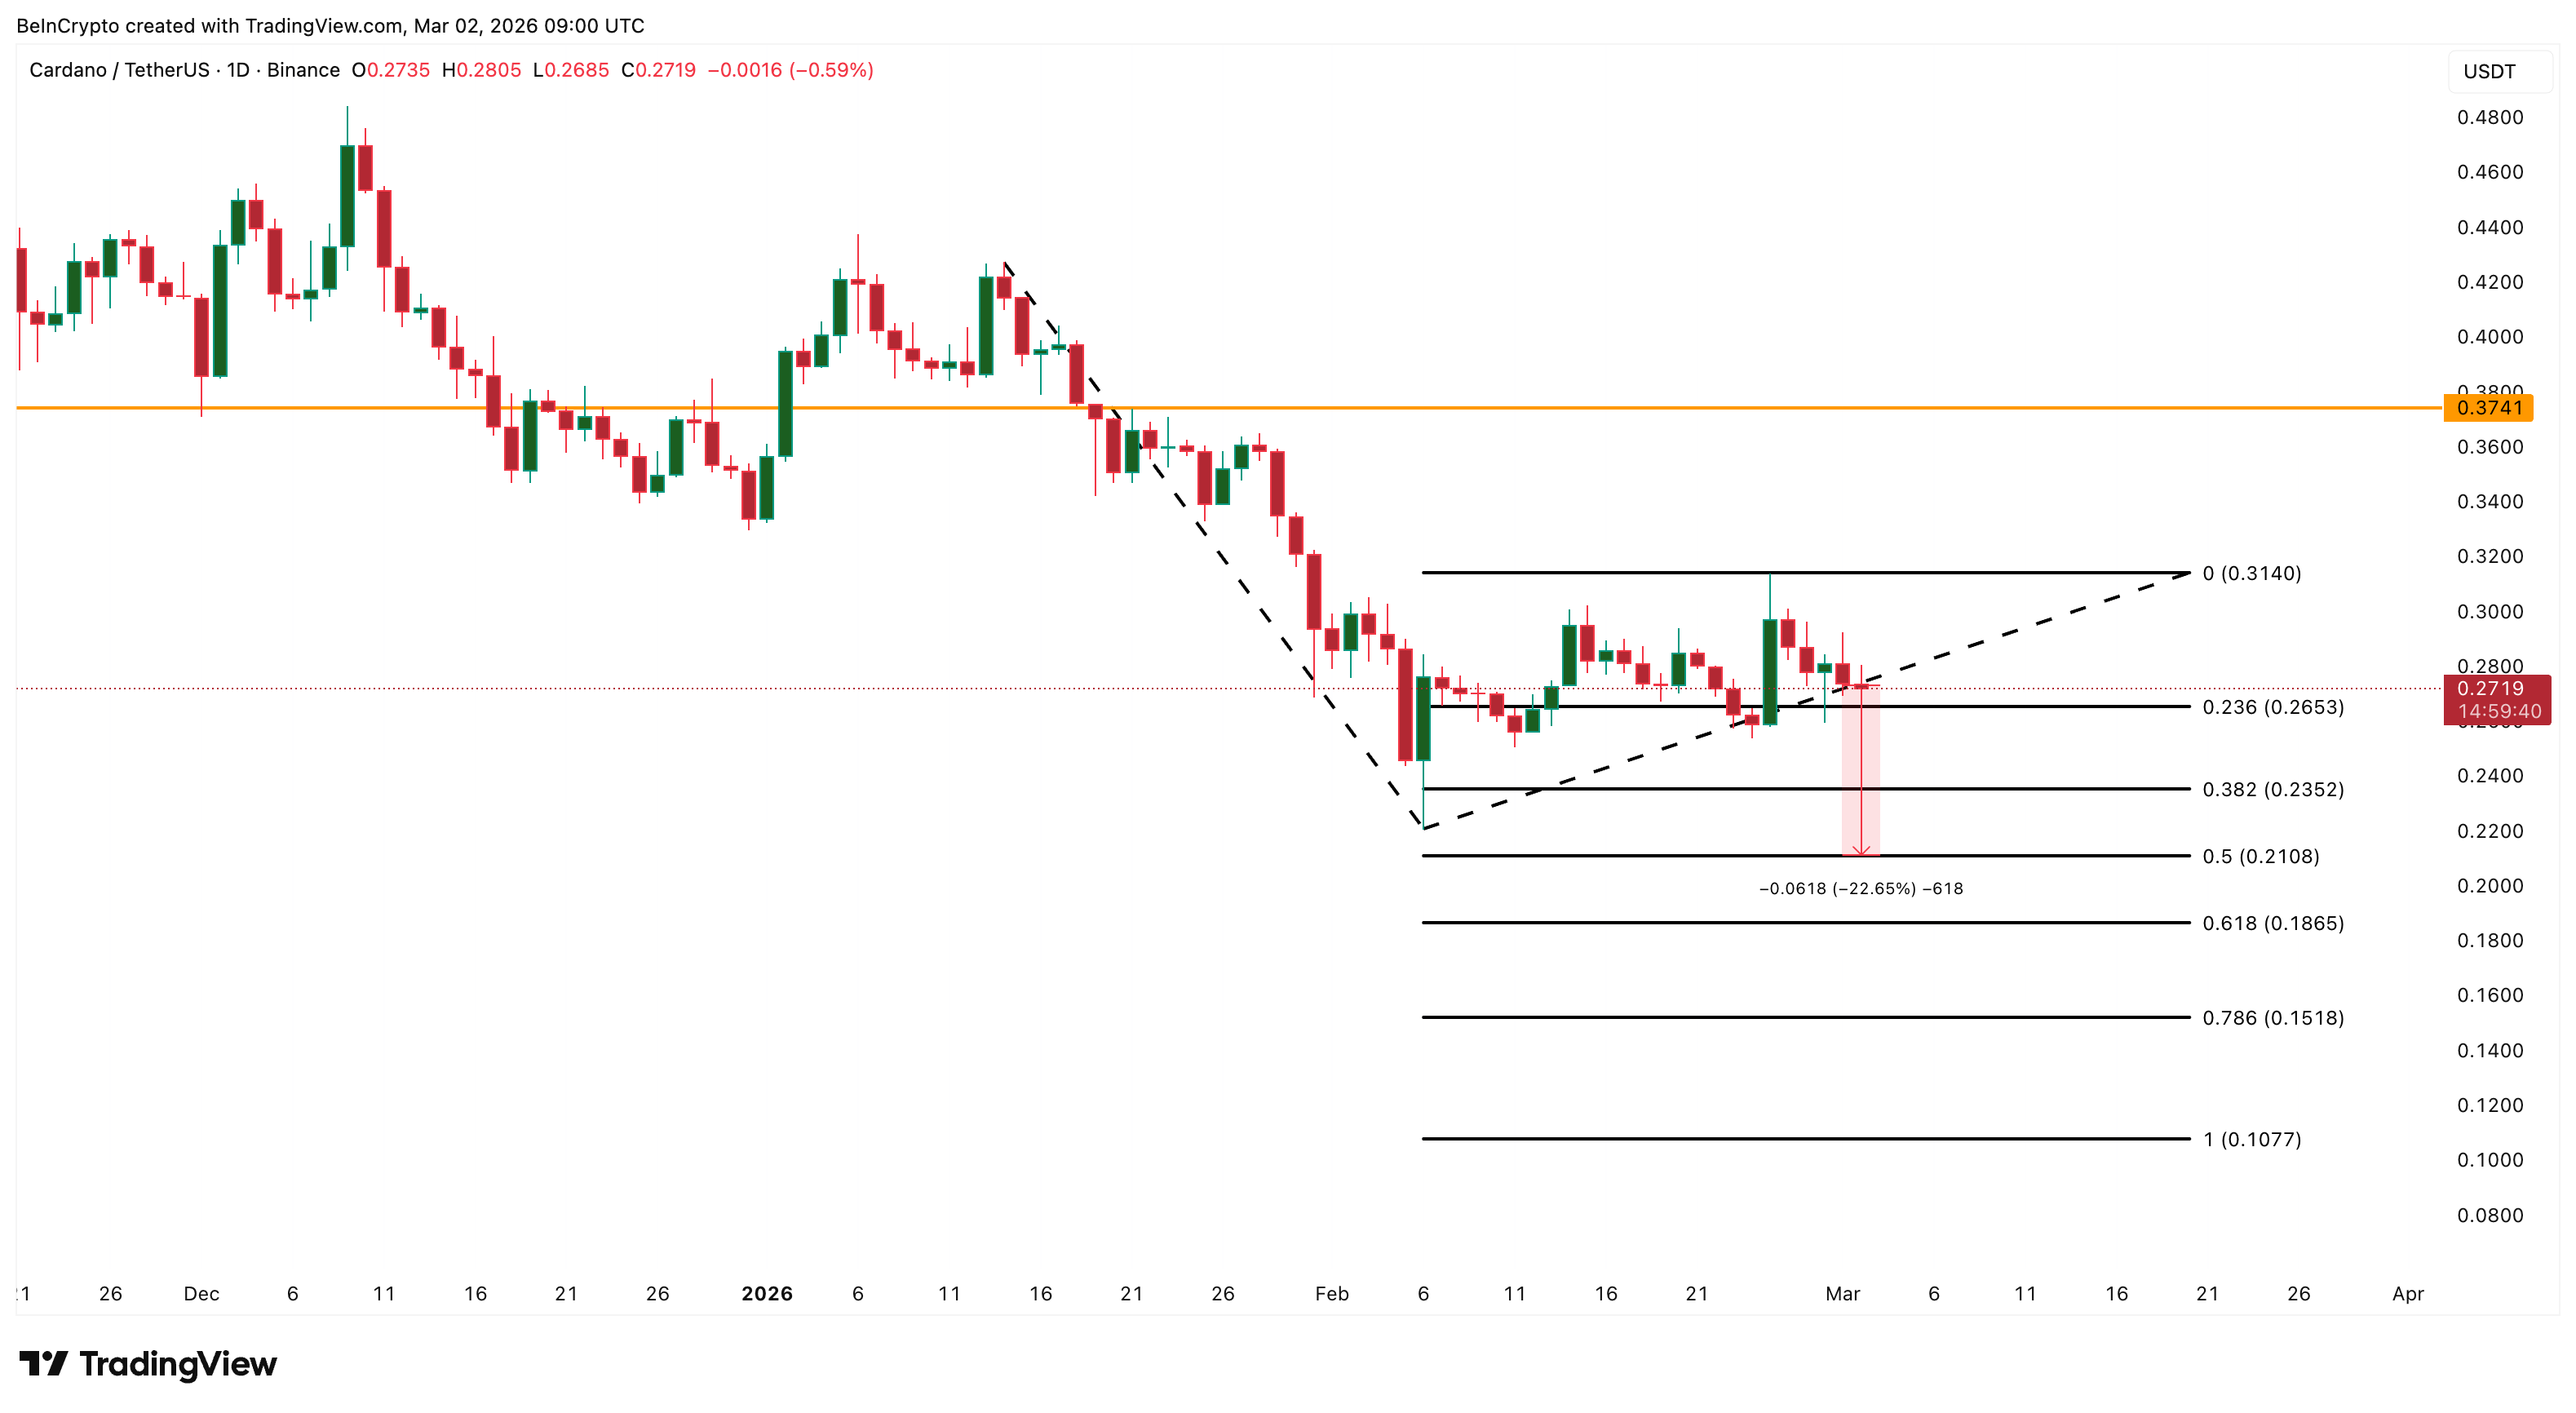
If $0.21 fails, deeper Fibonacci extensions at $0.18 (0.618) and $0.15 (0.786) come into play.
But the most important variable for Cardano’s next move is not a price level. It is whether the whales start buying again. As of March 2, Santiment data shows that major holders have not resumed significant accumulation.
If ADA declines toward $0.21 or lower and whale cohorts begin to re-accumulate, as they did earlier, it would represent a considerably stronger setup than February delivered. The moment whales resume buying can be treated as a potential local bottom signal.
For the next divergence to succeed, it needs whale participation as confirmation, not contradiction. Until that happens, the Cardano price structure could continue to point lower.
The post Cardano’s Bullish Divergence Fired and Failed — $540 Million in Whale Selling To Blame? appeared first on BeInCrypto.