
Bittensor (TAO) price trades near $268, down 3.5% over the past seven days, yet two consecutive days of exchange outflows suggest spot buyers are quietly positioning for something bigger.
The AI-focused token has been a fixture on CoinGecko’s trending list and is up 22.5% year-to-date. It peaked near $310 on March 20 before correcting, but the pullback may be forming the handle of a much larger pattern. The disconnect between weakening price and persistent spot buying is the central tension here, and the daily chart reveals what the buyers might be seeing.
Outflows Slow but Persist, and the Chart Reveals Why
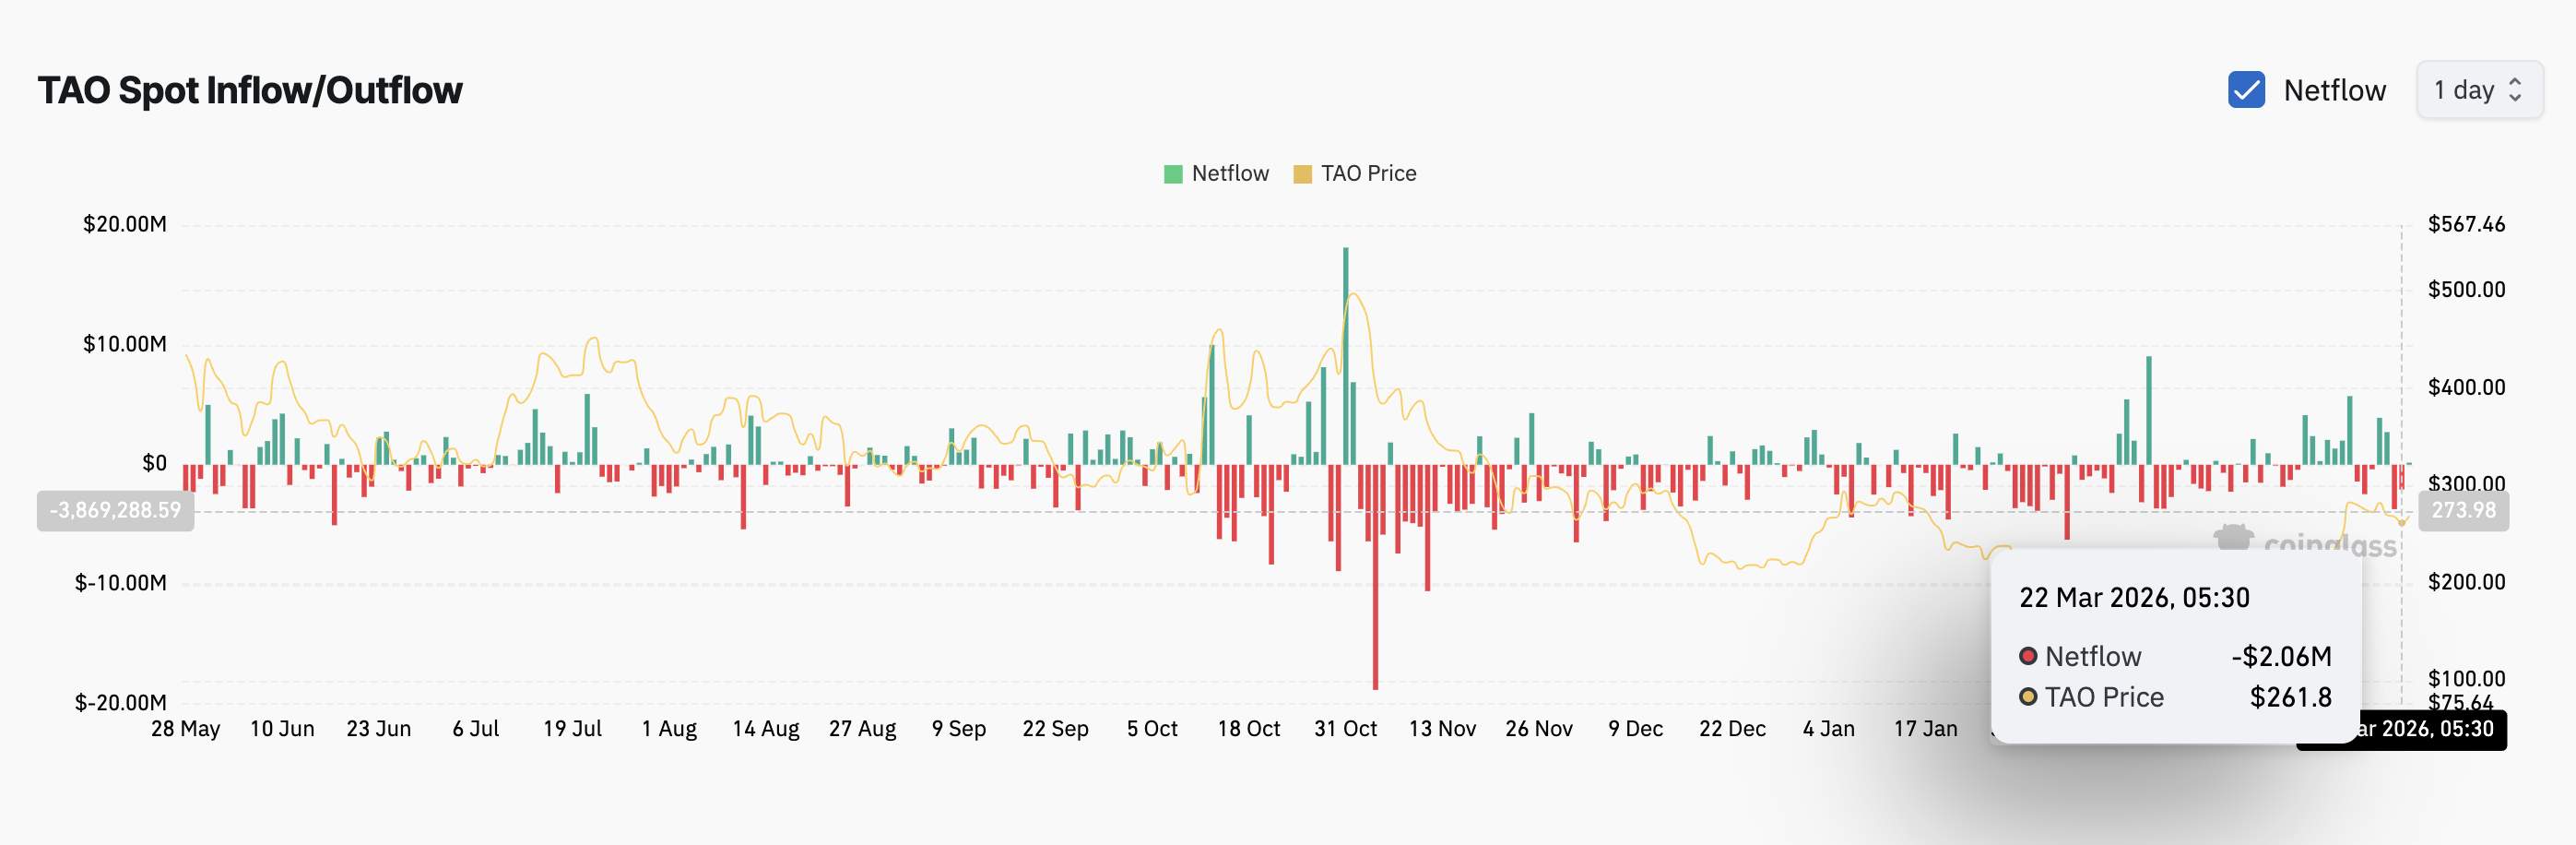
Exchange flow data from Coinglass shows TAO recorded $3.71 million in net outflows on March 21, followed by $2.06 million on March 22. That is $5.77 million leaving exchanges over two days while the Bittensor price was actively correcting.
However, the pace has clearly slowed. The 44% drop from $3.71 million to $2.06 million shows that spot buyers are still accumulating but with growing caution. They have not stopped buying, but they are no longer rushing in either. That hesitation possibly aligns with the short positioning building in derivatives, which the next section explores.
Want more token insights like this? Sign up for Editor Harsh Notariya’s Daily Crypto Newsletter here.
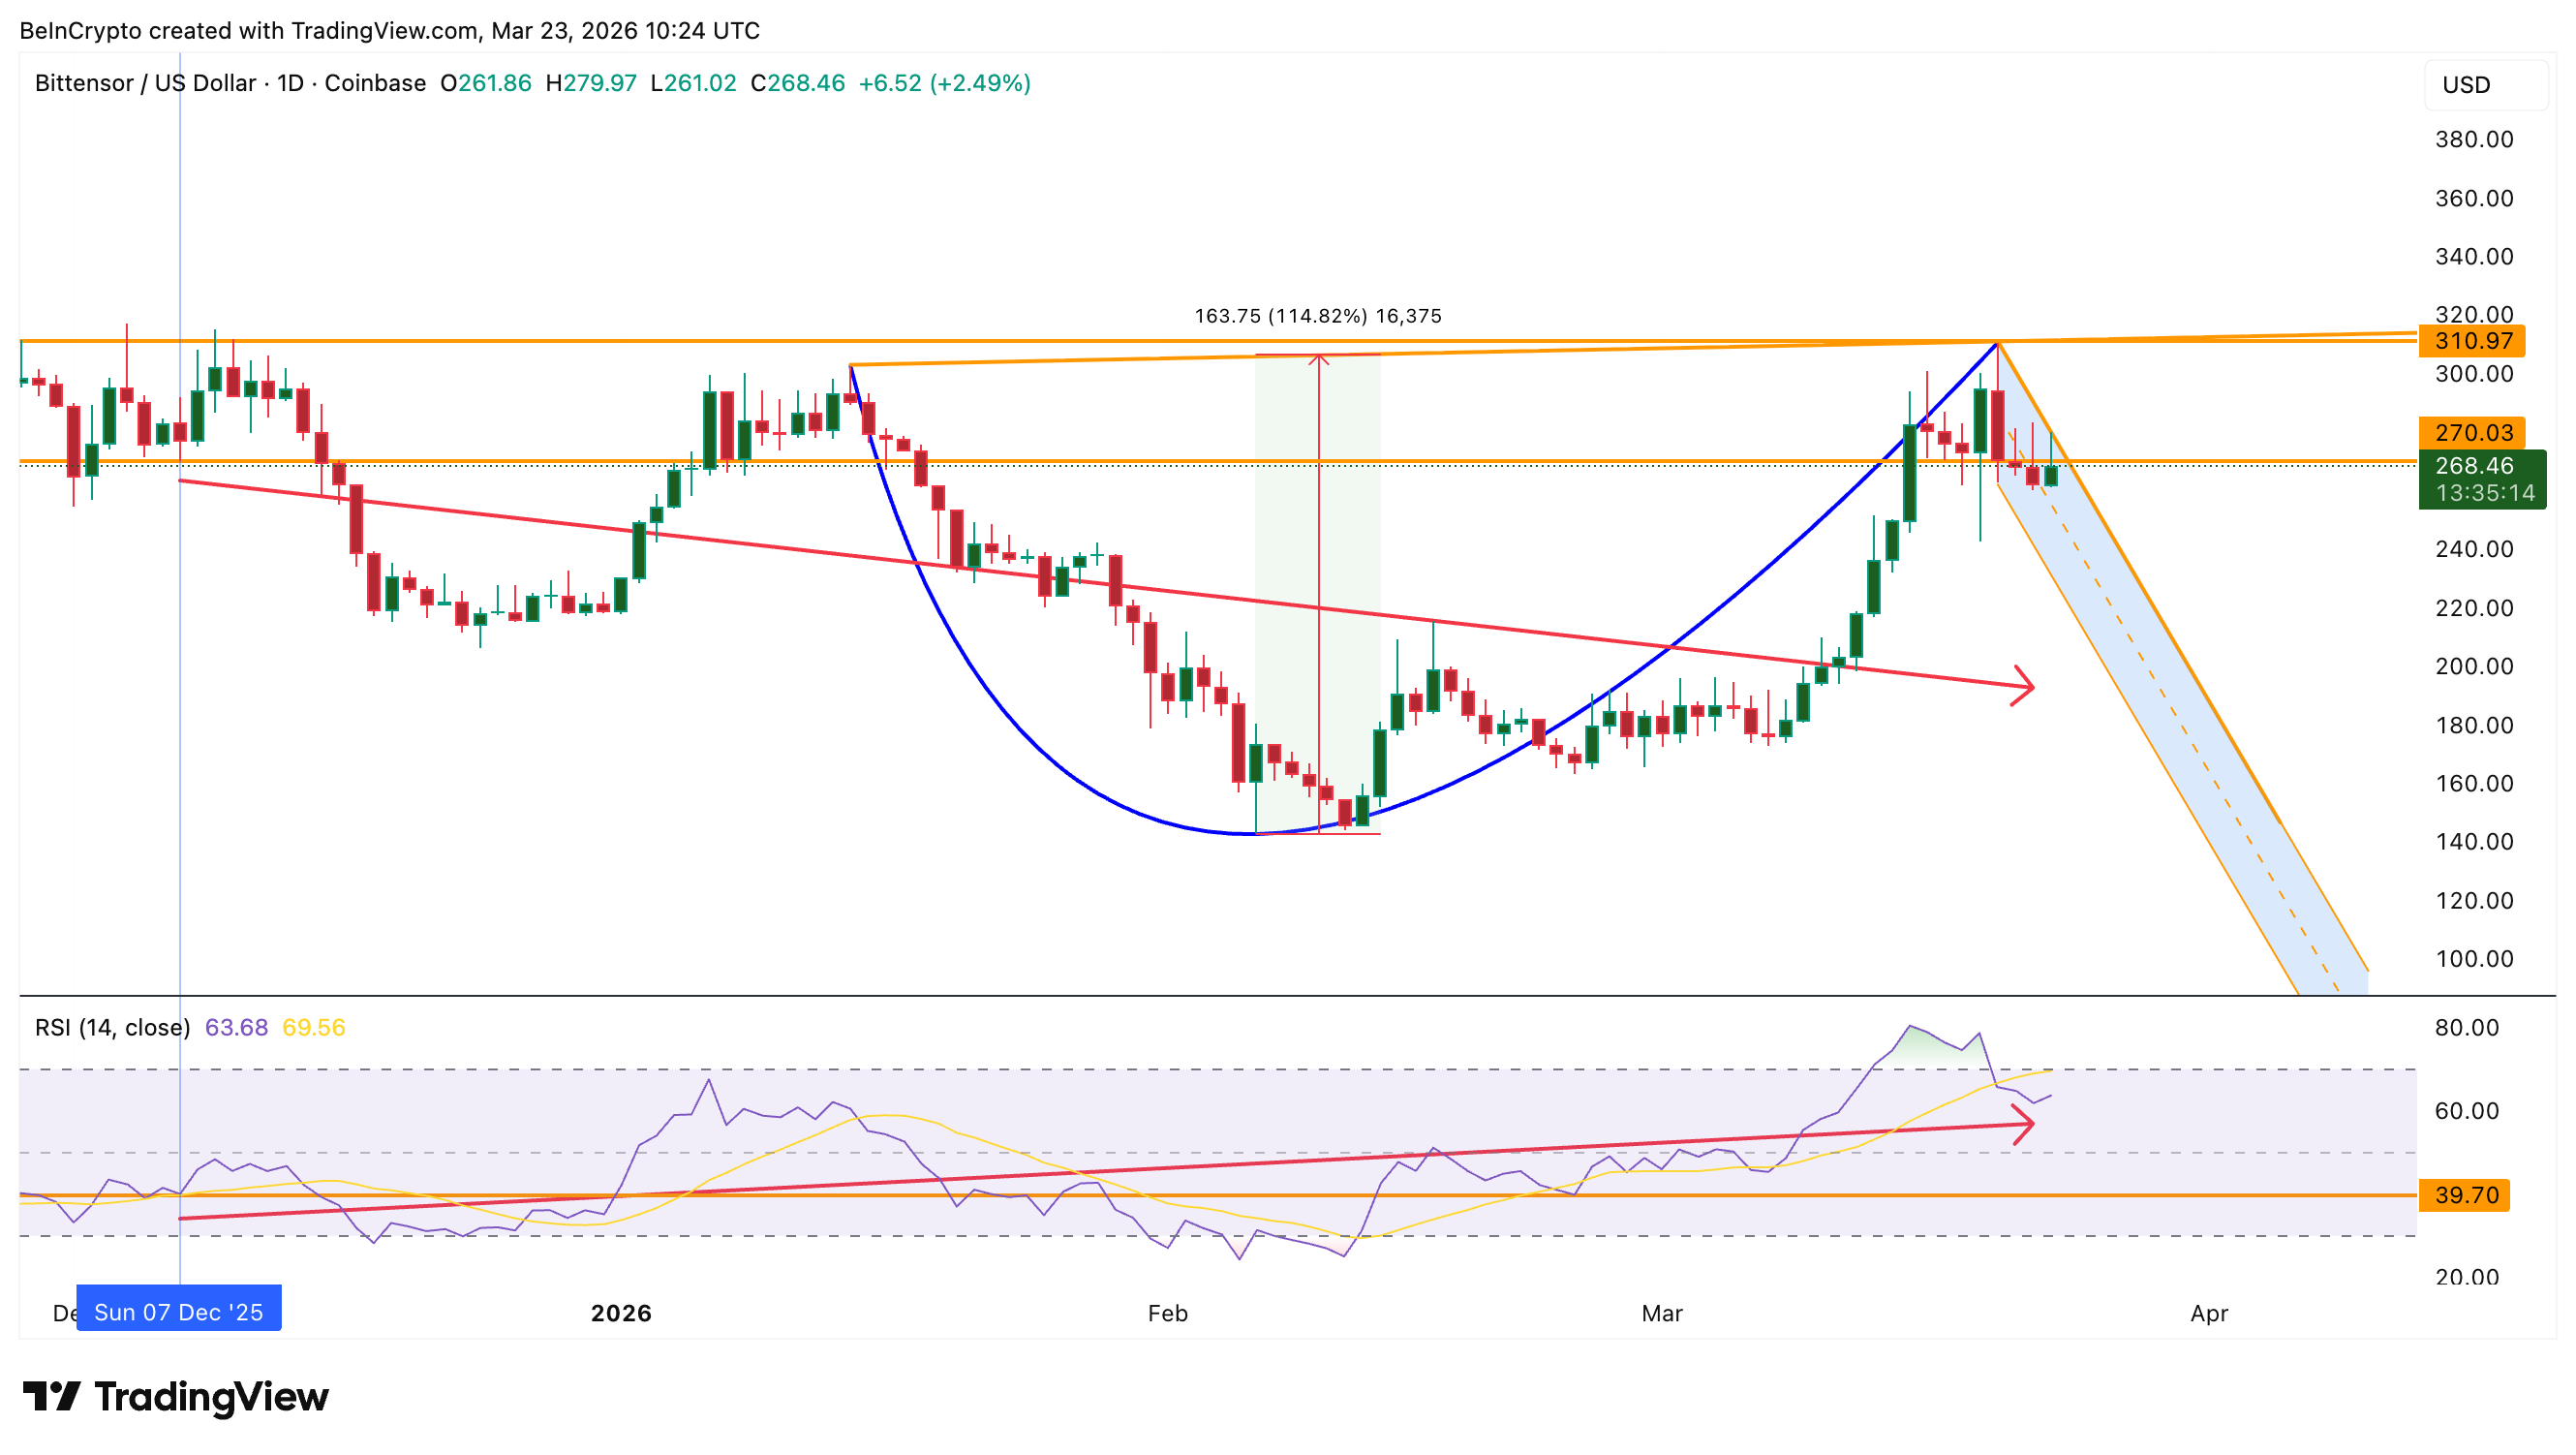
The daily chart on Coinbase explains what these cautious buyers are likely positioned for. Since January, the TAO price has been carving a cup-and-handle formation. The rounded bottom of the cup stretches from early February through mid-March, with the left rim and right rim both near the $310 neckline. The current pullback from $310 is forming the handle, a small consolidation before the potential breakout.
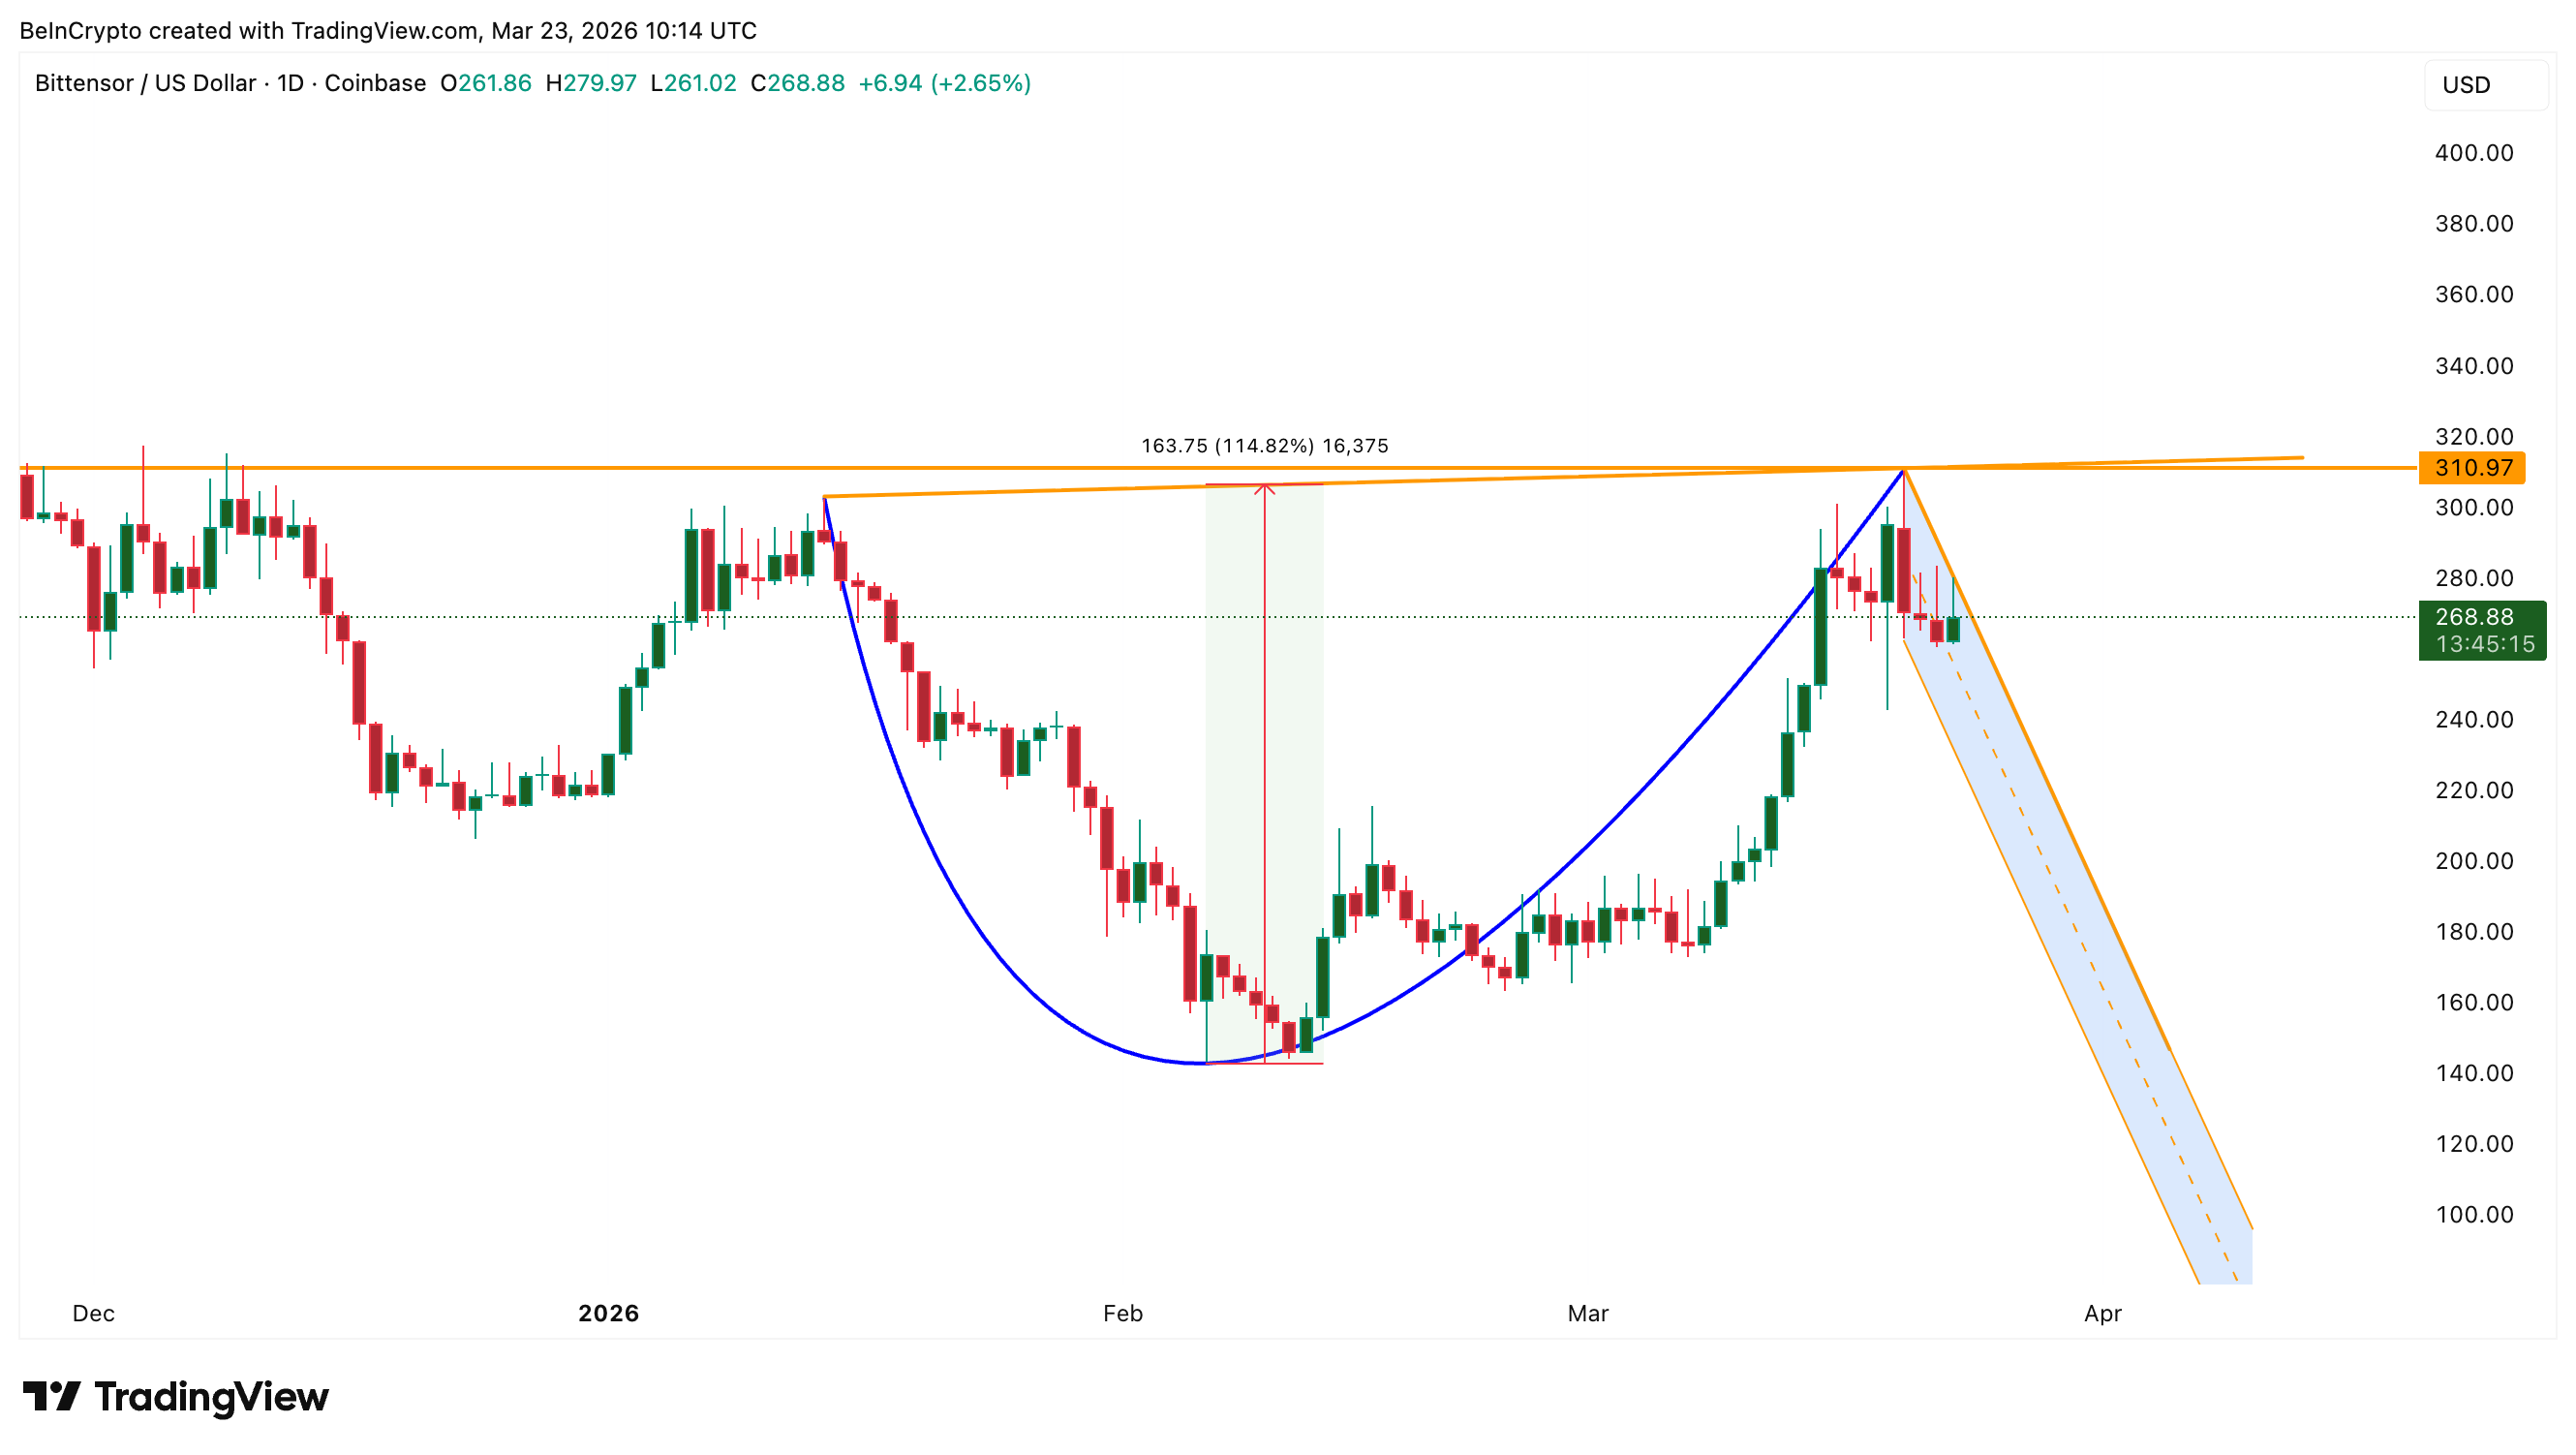
The measured move from this pattern targets approximately 115% upside from the neckline. However, the pattern only activates on a daily close above $310, also the cup’s neckline level. Until then, the handle could deepen further. Whether it breaks depends on the derivatives’ positioning and the conviction of the buyers already accumulating.
Shorts Are Building Again, and That Could Be the Fuel
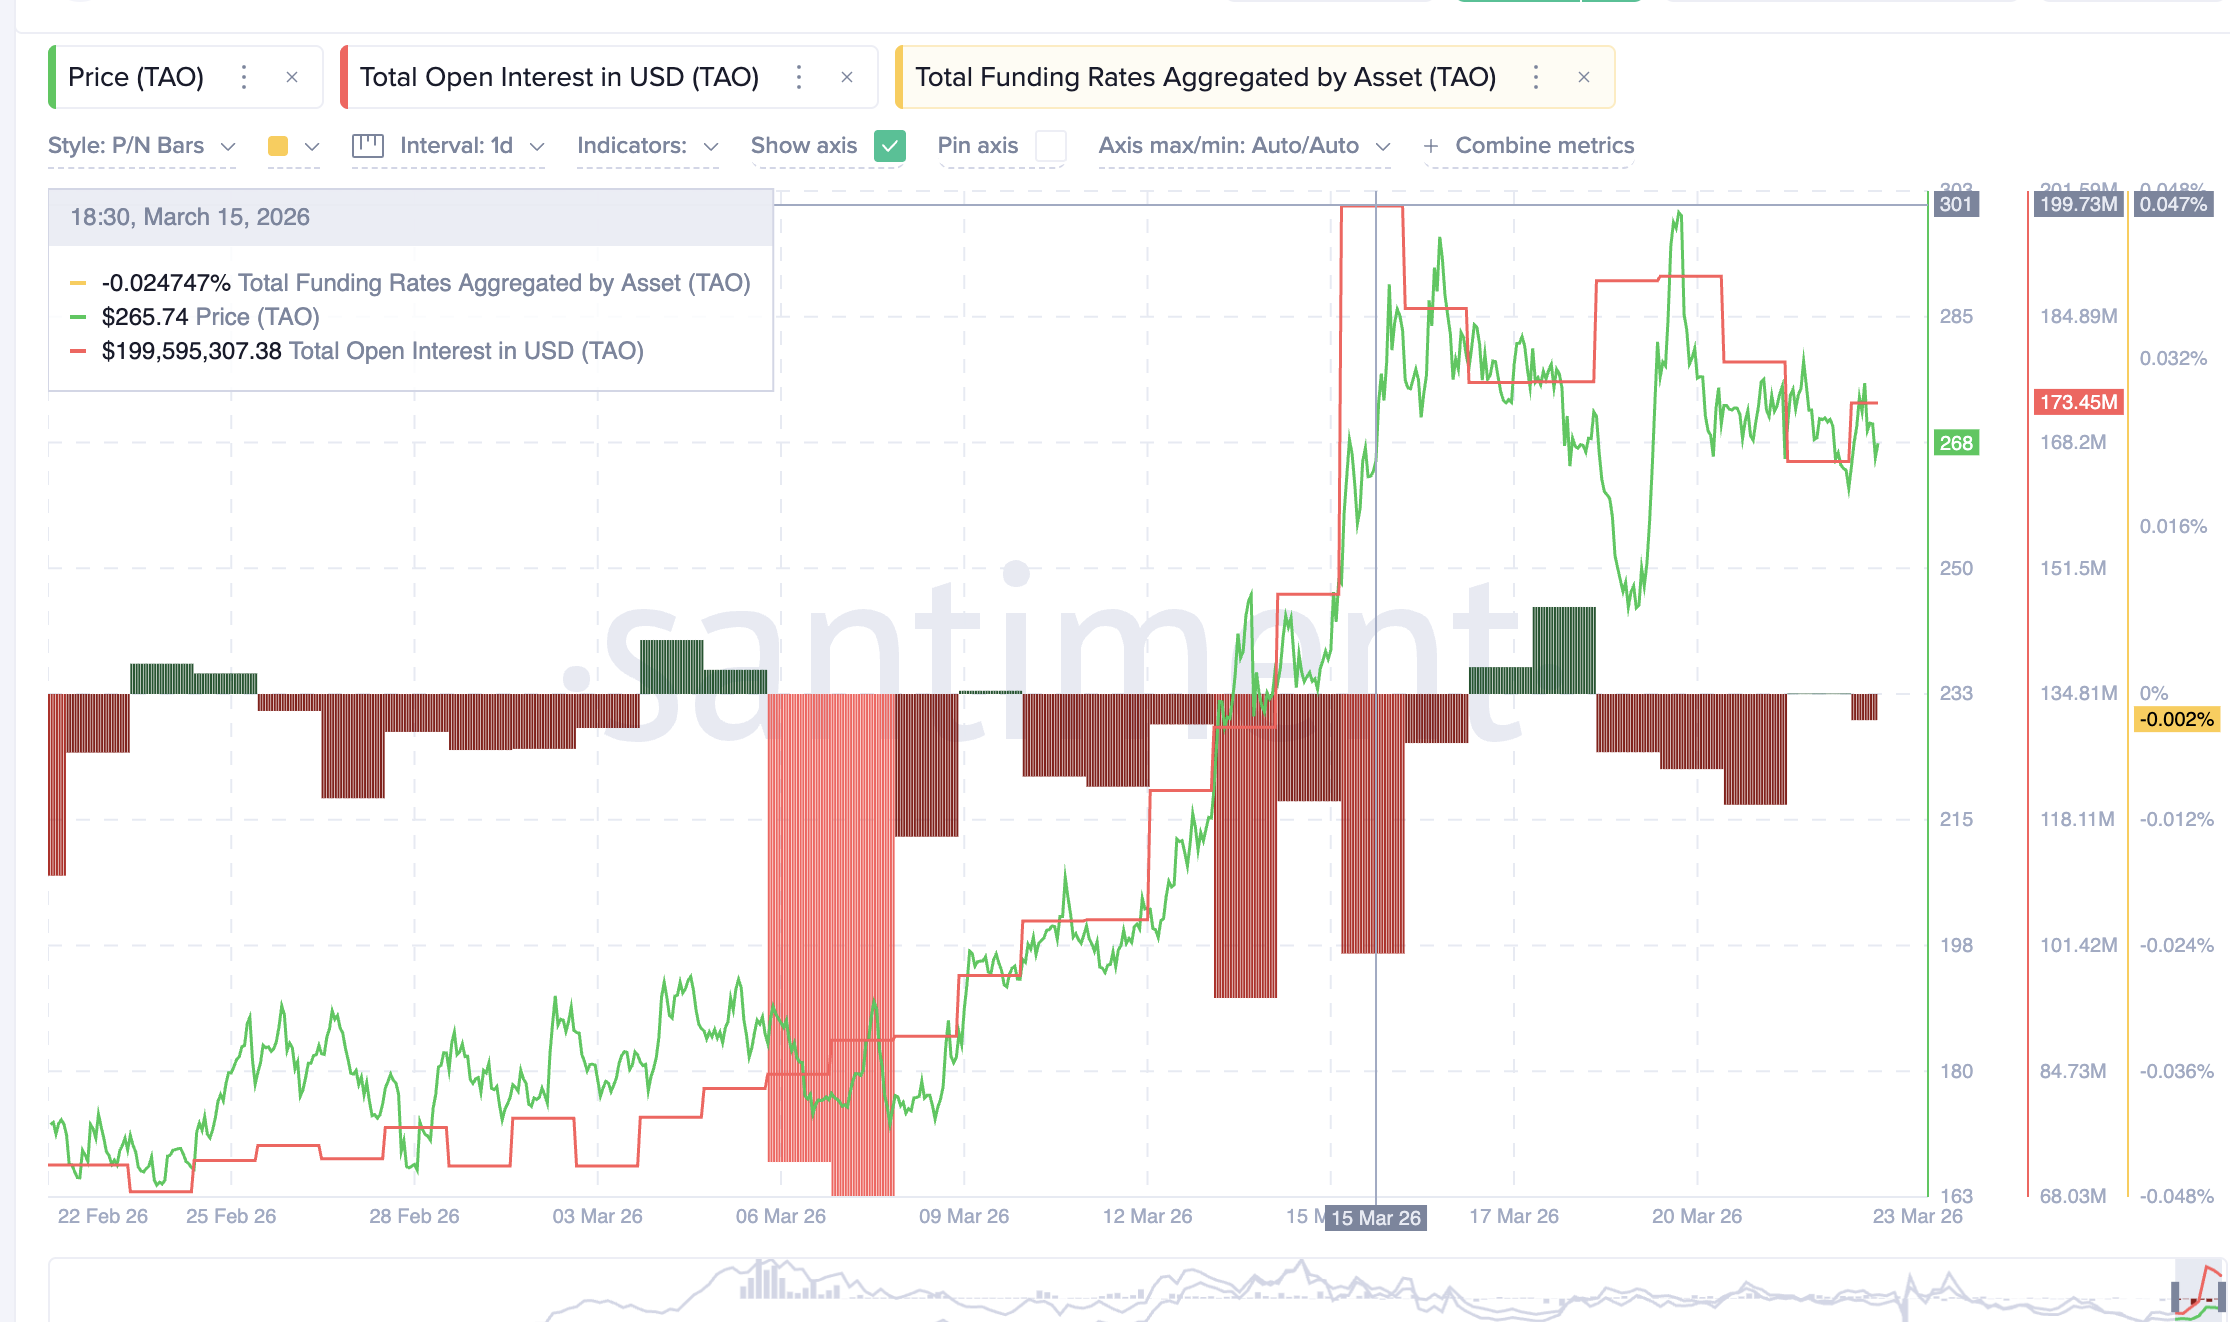
The derivatives picture adds a critical layer. On March 15, when TAO was building momentum toward $310, open interest peaked near $199.73 million with a deeply negative funding rate of -0.0247%. That combination of rising open interest and negative funding meant short positions were dominant. When the price pushed through resistance anyway, those shorts were forced to cover, fueling the rally to $310.
A similar setup is forming now. Since March 22, open interest has risen from $165.48 million to $173.45 million, a roughly 5% increase. The funding rate has flipped negative again to -0.002%. The current short buildup is less aggressive than the -0.0247% reading from March 15, roughly 90% smaller. But the direction is the same. Derivatives traders are betting on further consolidation or decline, while spot buyers continue to pull tokens off exchanges, even if cautiously.
That tension between short positioning and cautious spot accumulation is what creates squeeze fuel if the neckline breaks. The shorts provide forced buying. The spot holders provide the floor. Together, they set the stage. But one more indicator suggests the stage is set for the bulls.
The Smart Money Index (SMI), an indicator that tracks positioning by informed participants during key trading hours, remains above its signal line. The SMI has been trending higher since the March lows despite the price pulling back from $310.
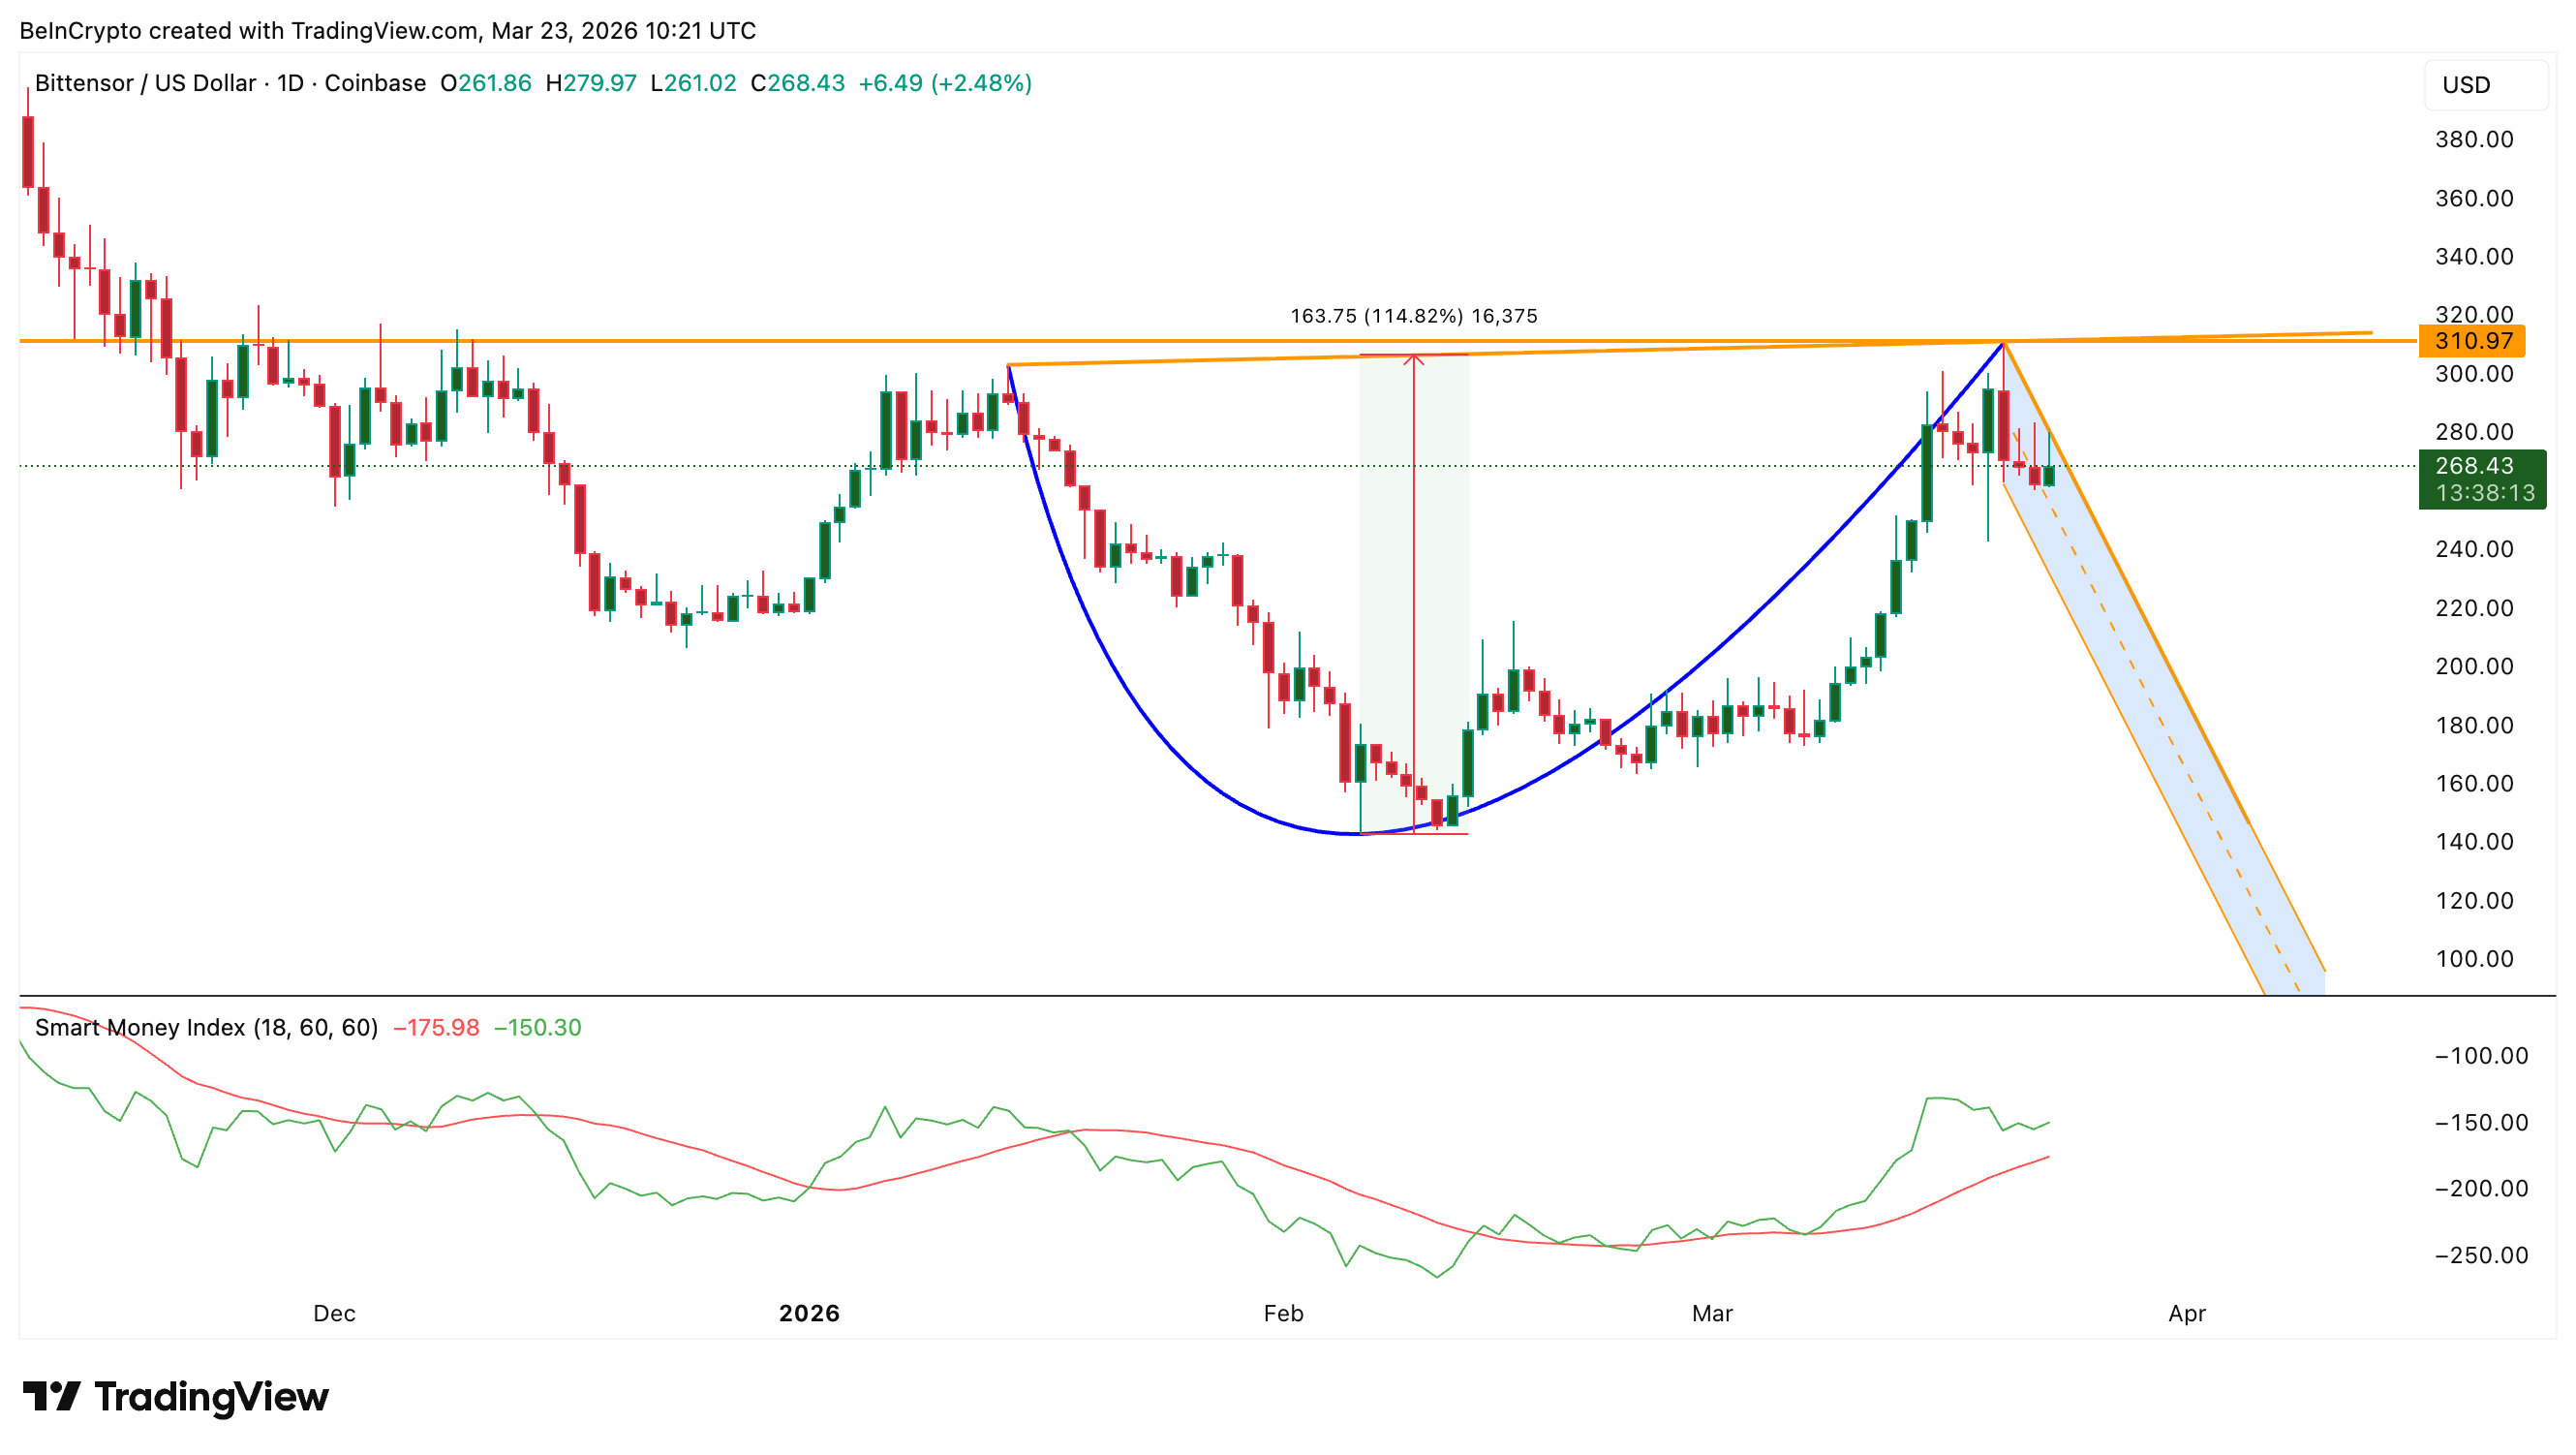
Informed traders have not exited their positions, which aligns with the exchange outflow data.
Bittensor Price Breaks Out or Breaks Down As Key Levels Surface
The Relative Strength Index (RSI), a momentum indicator, adds one final layer of confirmation. Between December 7 and March 22, TAO’s price made a lower low while the RSI printed a higher low. That standard bullish divergence on the daily chart suggests downside momentum is fading even as prices consolidate within the handle.
For the bullish case to activate, TAO needs a daily close above $299, the 0.236 Fibonacci level, followed by a push through the $310 neckline. Above $310, the targets open up significantly toward $364 and $428. If the AI narrative strengthens and the cup-and-handle plays out fully, the 1.618 extension at $532 and the projected target near $670 come into play.
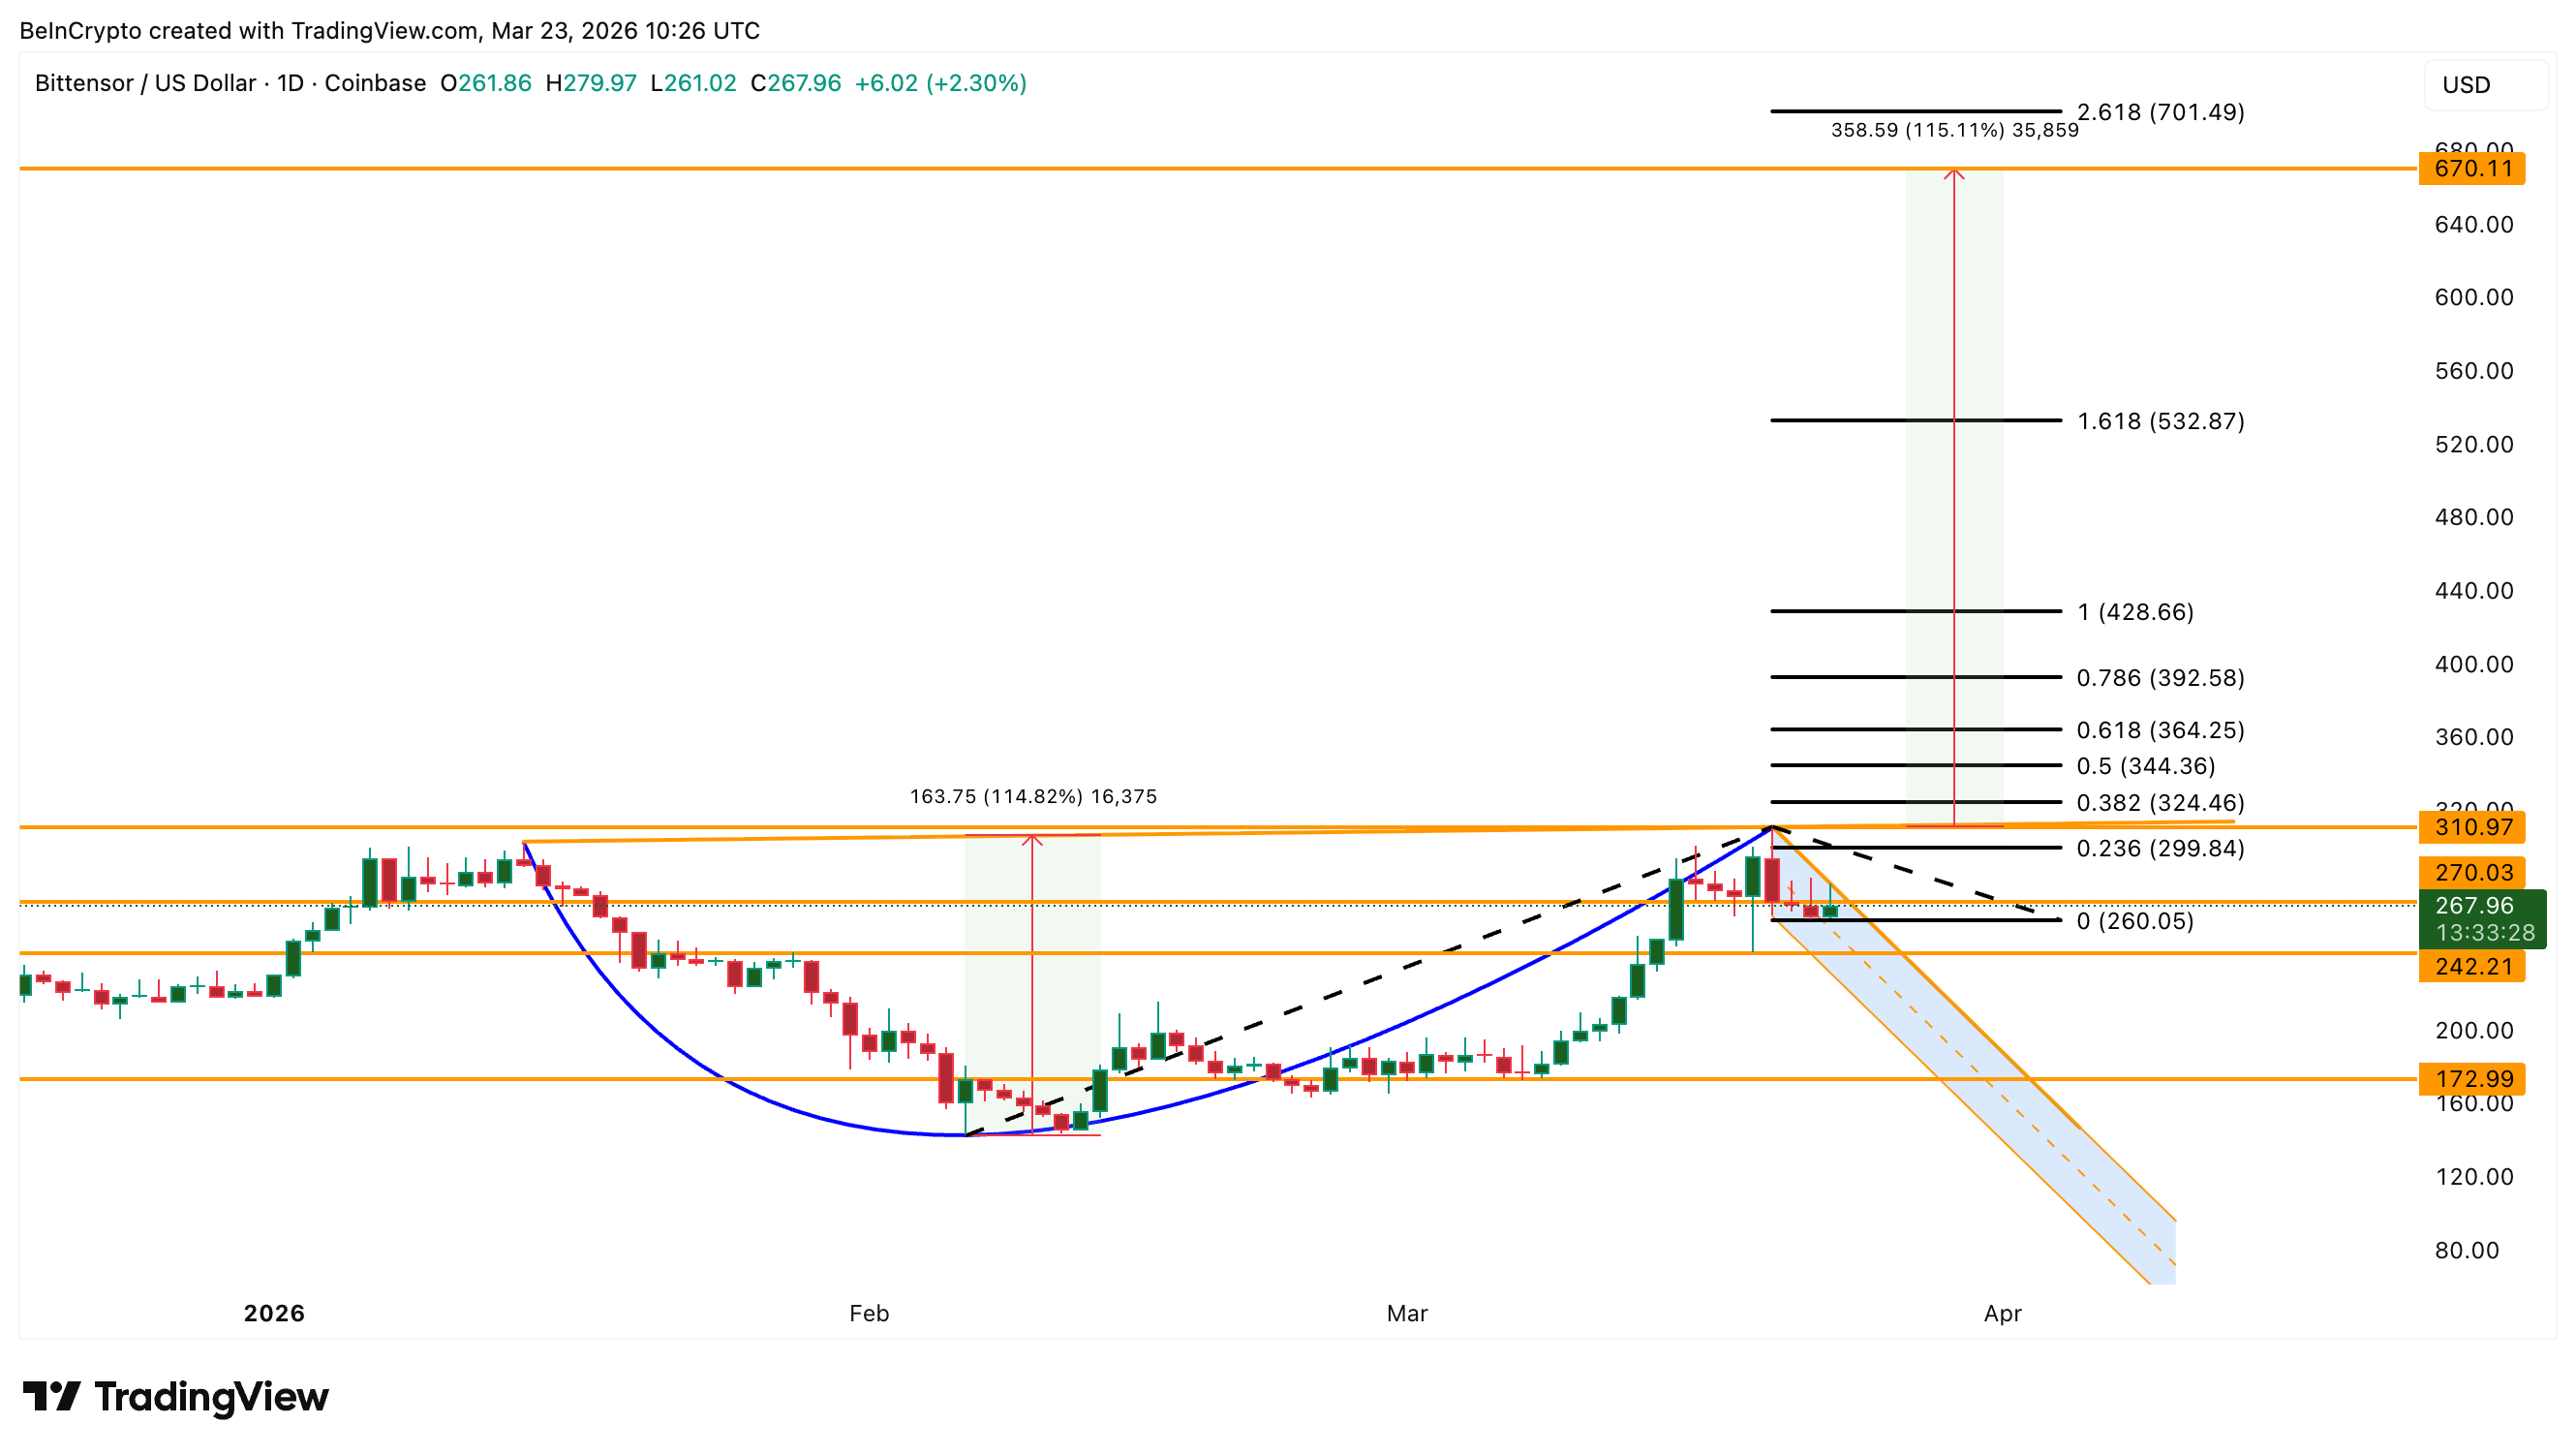
On the downside, $260 is the immediate floor. Below that, $242 is the next support. A daily close under $172 would invalidate the entire cup-and-handle structure. Currently, a daily close above $310 is what the Bittensor bull needs.
The post Bittensor Could Be Hiding a 115% Move as Spot Buyers Quietly Accumulate TAO appeared first on BeInCrypto.