Bitcoin (BTC) is tracking an 11% advance through April. If it holds onto these gains, it would mark BTC’s strongest monthly print since April 2025.
The focus now turns to May, and analysts are sounding a bearish tone on what lies ahead for Bitcoin.
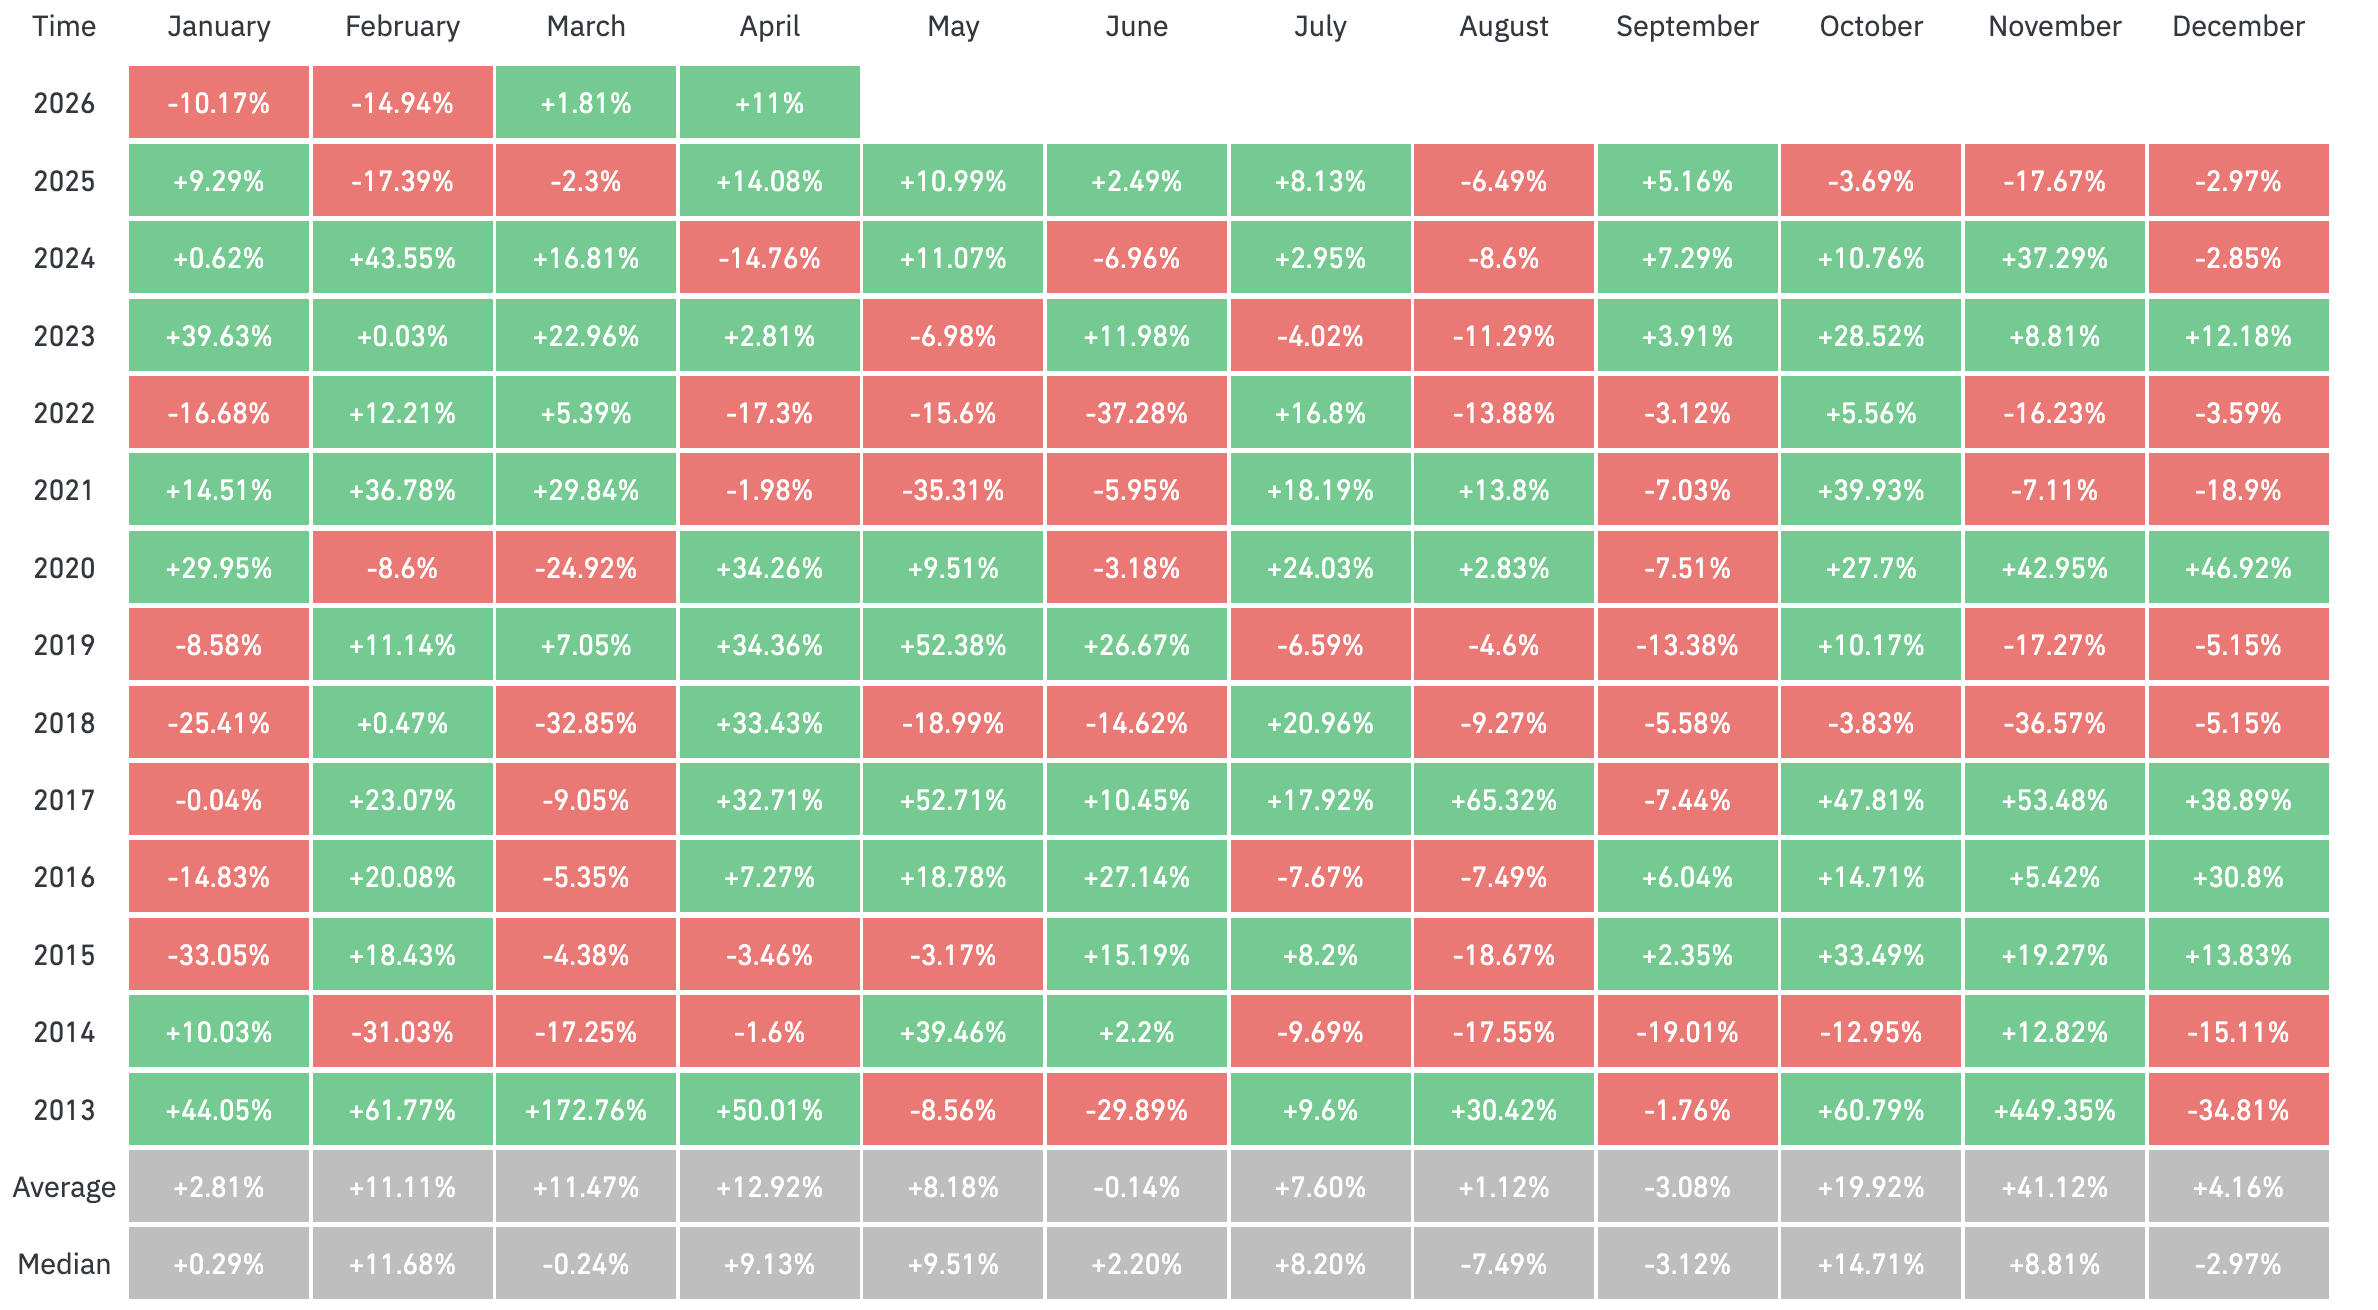
Bitcoin’s 11% April Rally Faces May Top Risk
The recent run also follows March’s modest 1.81% rise. Both green months followed a sharp downtrend. Bitcoin posted five straight red months from October 2025 through February 2026, with the price falling 17.67% in November and 14.94% in February.
The latest turnaround now faces fresh scrutiny as the calendar turns to May. In a post on X (formerly Twitter), analyst Merlijn The Trader flagged a recurring four-year mid-term election pattern.
The analyst cited May peaks in 2014, 2018, and 2022 that preceded drops of 61%, 65%, and 66%. According to him, a similar reversal could push BTC near $30,000.
“Sell in May and go away. Only in mid-term years, every time,” he said. “Three words. Three cycles. The fourth is running.”
Follow us on X to get the latest news as it happens
Coinglass data also showed that two of the three previous midterm years, 2018 and 2022, saw May close red, adding to the bearish thesis. Previously, Binance Research highlighted that BTC has averaged a 56% decline during US midterm election years.
On-Chain Signals Reinforce Bearish Setup
Beyond seasonal patterns, on-chain analysts also flag structural weakness. Crypto Dan argued that BTC remains in a “typical bear cycle.” The analyst pointed to negative funding rates as confirmation of weak sentiment.
“While the current price range is undeniably cheap from a cycle perspective, there still appears to be insufficient evidence to conclude that we are at the point of transitioning into a new bull cycle,” the analyst wrote.
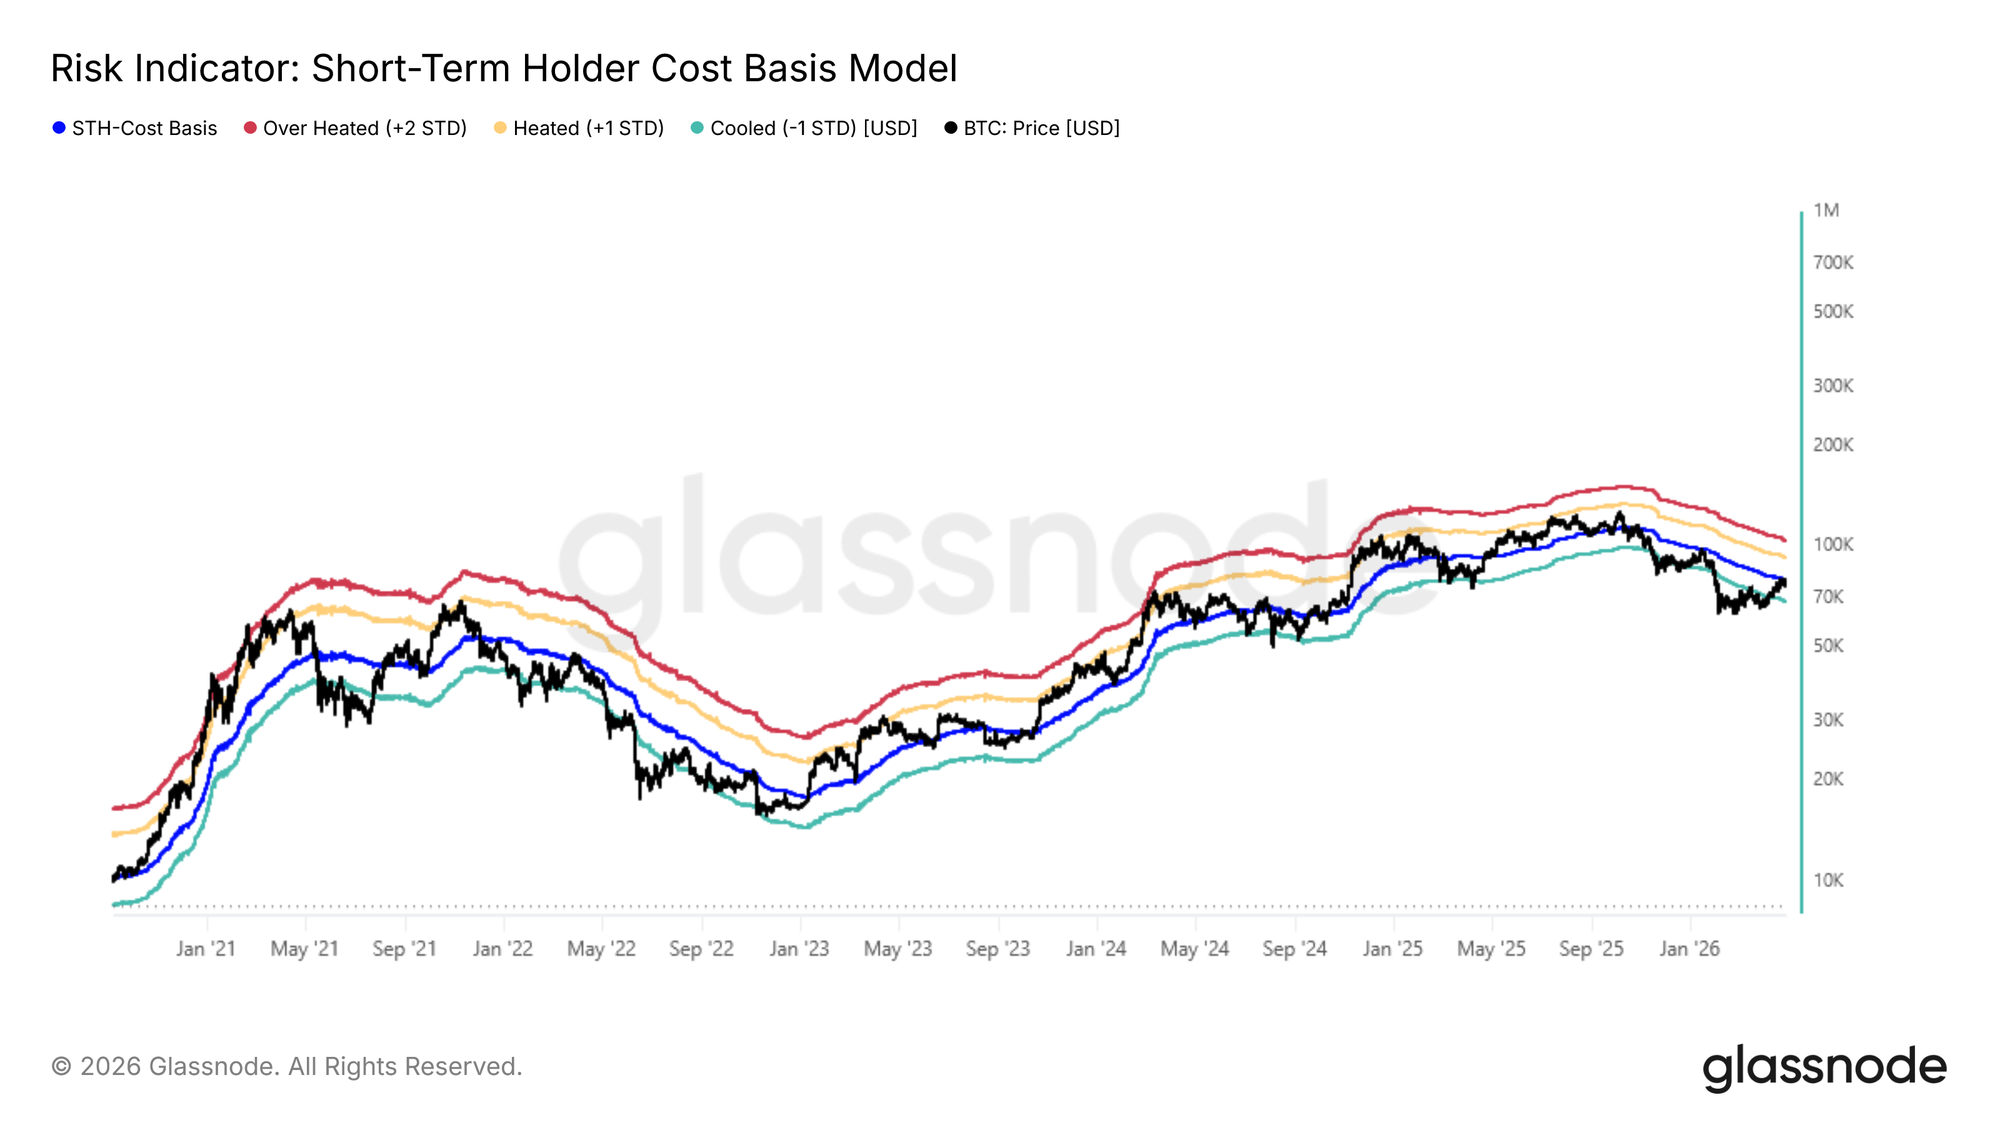
Glassnode data reinforced the cautious read. The price was rejected at the True Market Mean and the short-term holder cost basis, confirming resistance and a mid-term downside bias.
“This behavior is a textbook pattern in bear markets, where price approaches the breakeven level of the most price-sensitive cohort, the incentive to exit positions overwhelms incoming demand, exhausting upside momentum,” the report read.
The 24-hour SMA of Short-Term Holder Realized Profit surged to $4 million per hour as Bitcoin’s price inched closer to $80,000. This signals heavy distribution into strength and, in turn, limits follow-through from the rally.
In a recent interview with BeInCrypto, Benjamin Cowen, CEO of Into The Cryptoverse and former NASA researcher, also said Bitcoin’s base-case bear-market bottom is October 2026, suggesting further downside.
Nonetheless, not all signals are negative. Cowen also pointed to a scenario where Bitcoin could bottom as early as May.
“Bitcoin could bottom sooner, as early as May. But in order for that to happen, there would have to be some type of massive capitulation well below what we historically expect to see in midterm years,” he said.
Subscribe to our YouTube channel to watch leaders and journalists provide expert insights.
Meanwhile, institutional players appear to be stepping back in. Both the Chicago Mercantile Exchange (CME) open interest and spot Exchange-Traded Fund (ETF) assets under management (AUM) are also showing early signs of recovery.
In addition, sustained short bias leaves room for a squeeze if demand returns. Binance Research separately tracked roughly 54% gains in the 12 months following midterms, hinting at a possible recovery once weakness clears.
The post Bitcoin Technical Charts For May Turn Bearish – Will BTC Fall Again? appeared first on BeInCrypto.