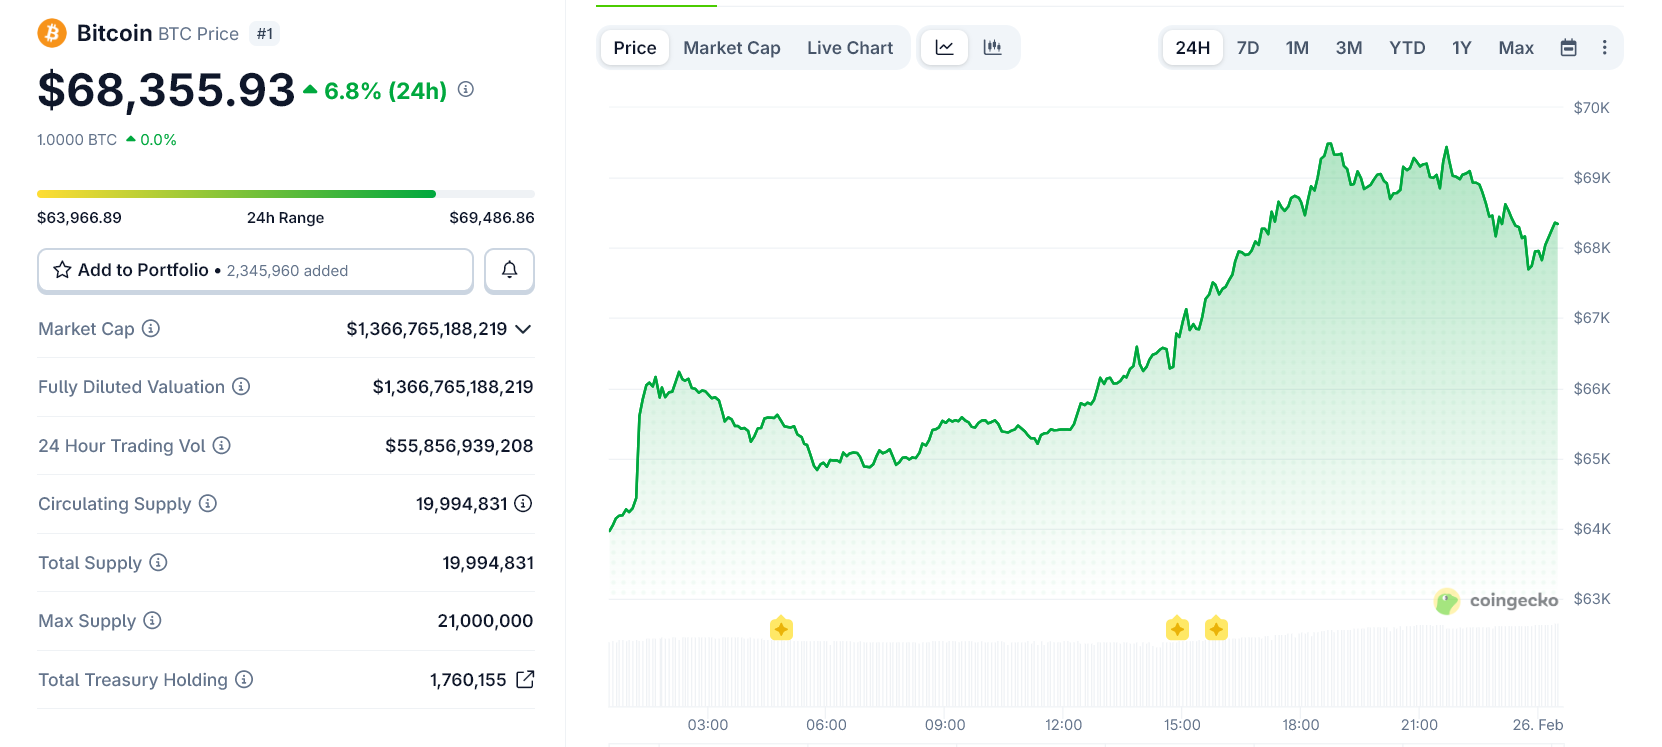
Bitcoin surged sharply this week, briefly nearing $70,000 before pulling back. The move sparked debate across the market: has Bitcoin finally bottomed, or is this just another relief rally inside a broader bear phase?
Multiple on-chain, derivatives, and institutional indicators show early signs of stabilization. However, key signals still point to a fragile recovery rather than a confirmed bullish reversal.
Options Market Shows Fragile Conditions, Not Strong Support
Bitcoin’s options positioning recently shifted into what traders call a negative gamma regime, according to Glassnode’s GEX heatmap.
In simple terms, gamma measures how options market makers hedge risk. When Bitcoin sits in a negative gamma zone, dealer hedging tends to amplify price moves.
That means rallies can accelerate quickly—but so can selloffs.
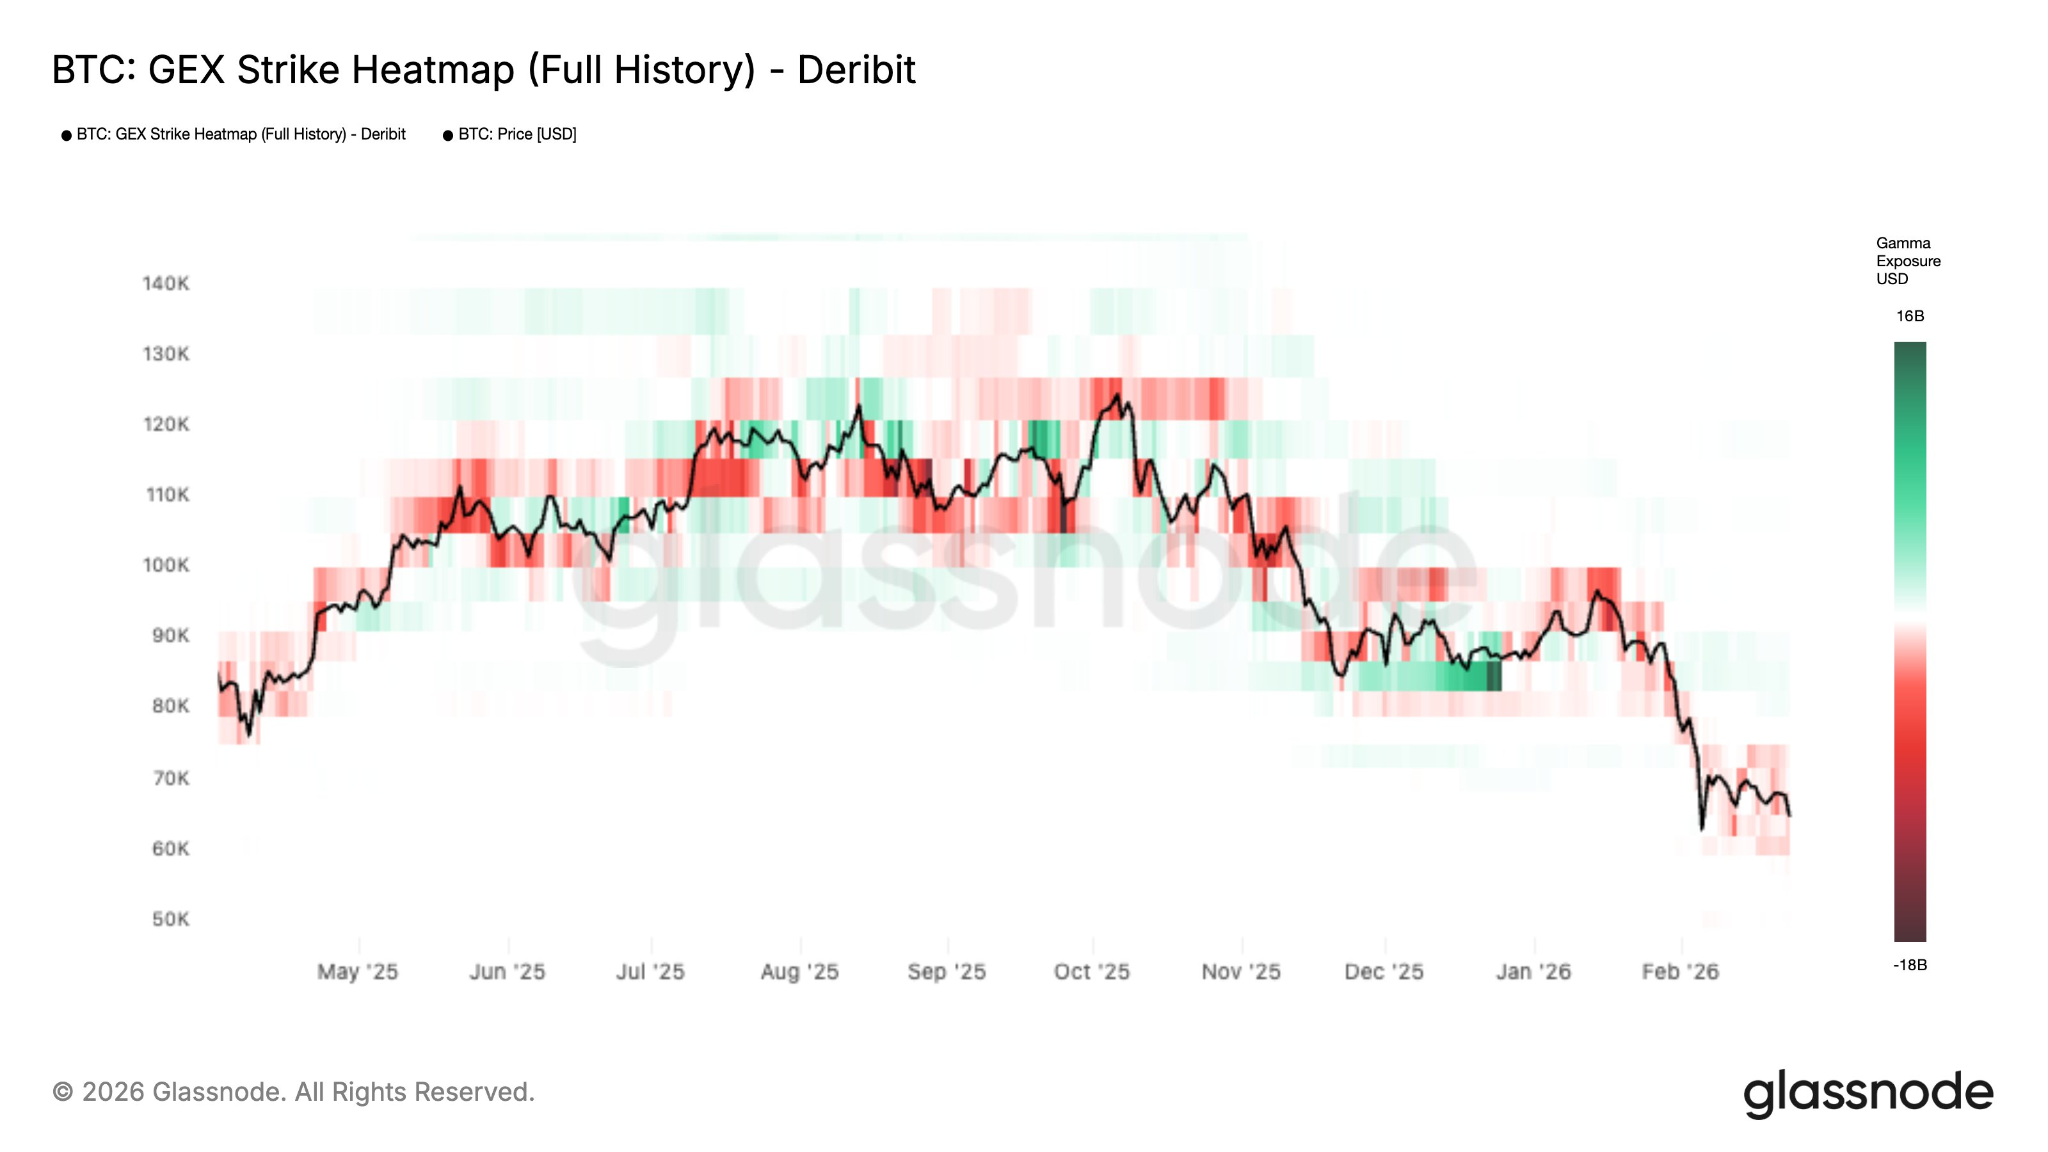
The heatmap also shows fewer strong resistance “gamma walls” above current prices. This creates less friction for upward moves, which helps explain Bitcoin’s sudden surge.
However, it also means the market lacks structural stability.
Without strong hedging support, price moves remain fragile and prone to reversal.
Bitcoin Spot Demand Is Improving for the First Time in Months
CryptoQuant data shows Bitcoin’s apparent demand, which measures net accumulation versus new supply, has turned positive for the first time since November.
This is an important early signal. When demand exceeds supply, it suggests buyers are stepping in and absorbing coins from sellers.
However, one positive shift does not confirm a full reversal. During past bear markets, temporary demand increases often occurred before further consolidation.
A sustained trend of rising demand over several weeks would provide stronger confirmation.
Short-Term Holders Are Still Selling at Losses
Another key indicator comes from CryptoQuant’s short-term holder profit and loss data, which tracks whether newer investors are selling at gains or losses.
The data shows short-term holders have been selling at losses consistently since late January. Several major loss spikes occurred in early February and again recently.
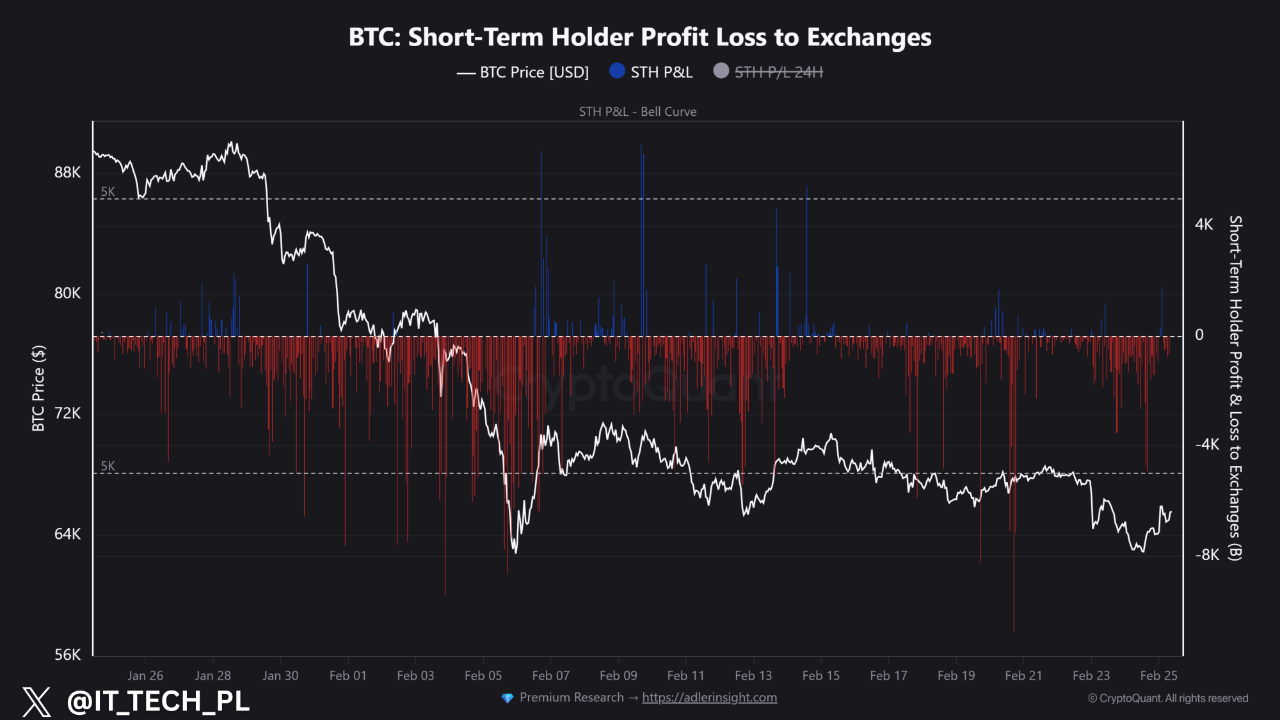
This pattern is known as capitulation, where weaker investors exit the market. Capitulation is common near market bottoms, because stronger buyers absorb those losses.
However, the signal has not fully reversed.
Until short-term holders begin selling at profits again, analysts warn that rallies can become “exit liquidity,” where trapped investors sell into strength rather than holding.
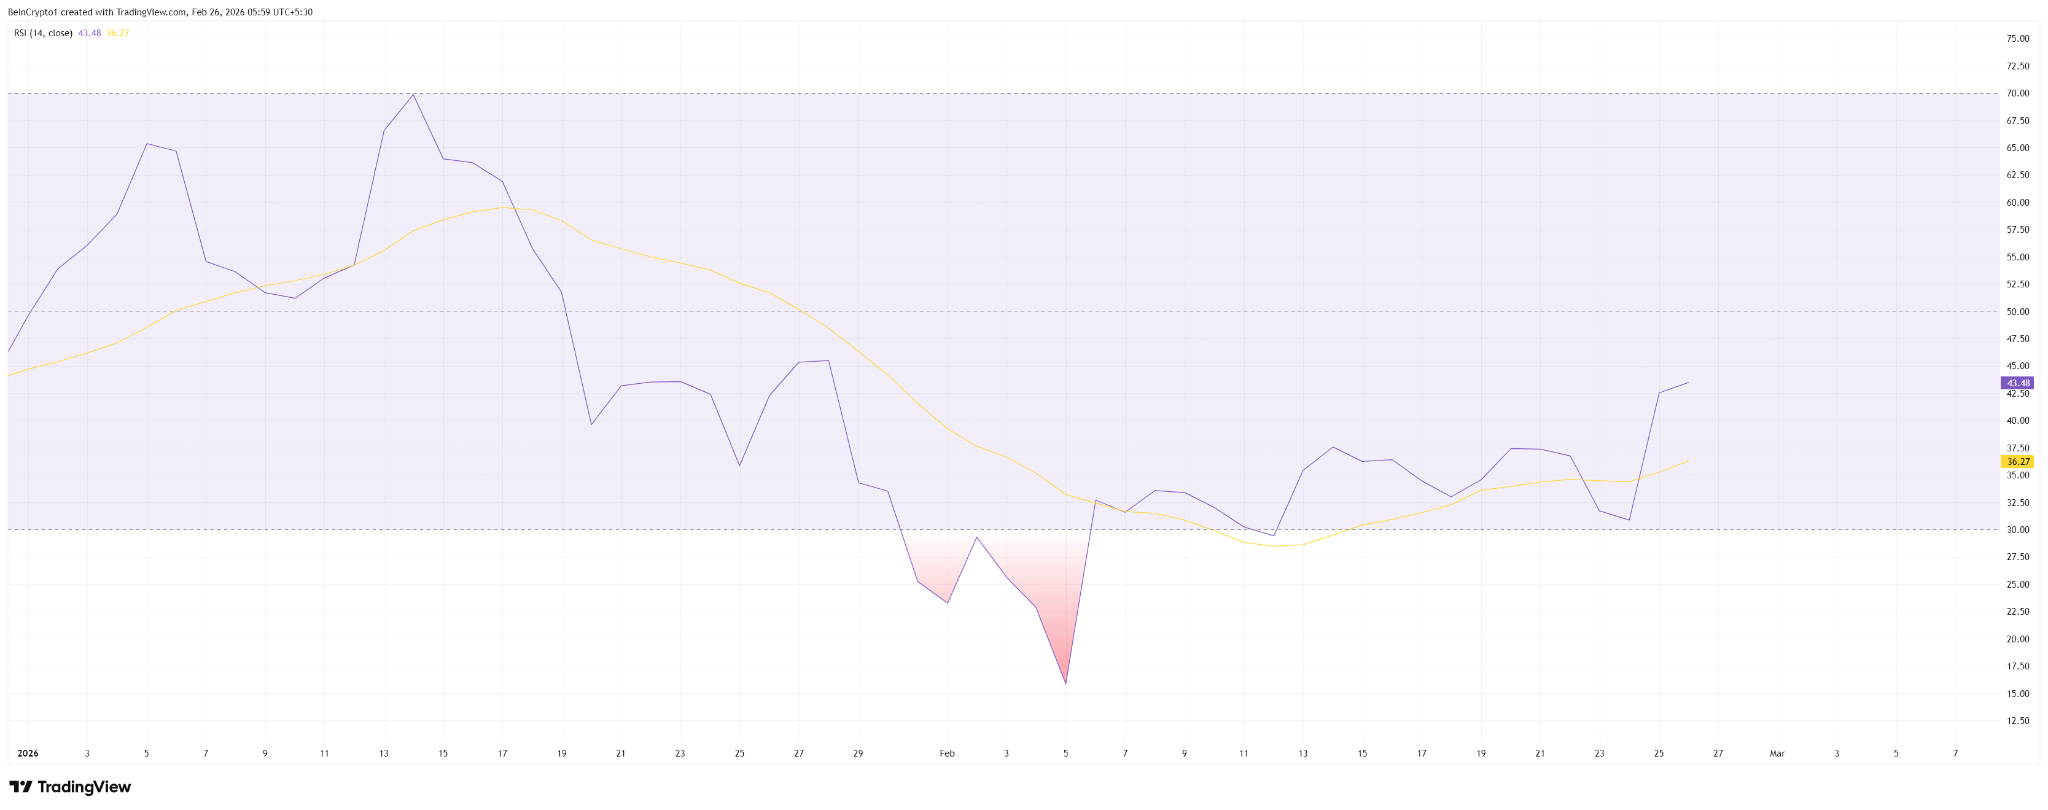
Technical and Historical Data Suggest Selling Pressure Is Easing
Bitcoin’s relative strength index (RSI), a momentum indicator, recently recovered after reaching extremely oversold levels in early February. This suggests selling pressure has weakened.
Historically, such RSI recoveries often lead to short-term rebounds.
Quarterly performance data also shows Bitcoin rarely experiences multiple consecutive quarters of heavy losses.
While this pattern does not guarantee a bottom, it supports the view that the market may be entering a stabilization phase.
Institutional Flows Still Show Weakness
Institutional positioning remains a key concern. Earlier data showed Bitcoin ETFs experienced sustained outflows, and SEC filings revealed large investment advisors and hedge funds reduced exposure significantly in late 2025.
This suggests institutional demand has not fully returned. Strong bull markets typically require consistent inflows from large investors.
Early Bottoming Signs, But Bull Market Not Confirmed
Bitcoin is showing several early bottoming signals. Spot demand is improving, capitulation appears to be getting absorbed, and technical indicators suggest selling pressure is fading.
However, key confirmation signals are still missing.
Short-term holders remain in loss territory, institutional flows remain weak, and options market structure shows fragile conditions.
For now, Bitcoin’s rally appears more consistent with a relief bounce than a confirmed bull reversal.
A sustained recovery will likely require stronger demand, renewed institutional inflows, and price stability above key resistance levels.
The post Bitcoin Rebounds Toward $70,000, But Is It a Momentary Relief or Slow Bull Run Signal? appeared first on BeInCrypto.