Bitcoin price is pushing back toward the $79,510 breakout level it failed at on April 22, but three on-chain signals confirm that US institutional demand is fading even as the chart looks ready to break out.
Bitcoin (BTC) trades at $79,098 on the 8-hour chart, up 0.54%, sitting just below the upper boundary of an ascending channel that has held since late February. The setup looks bullish on the surface. Beneath it, a momentum divergence, a gradual drop in US buying, and a collapse in short-squeeze fuel all point the other way.
Bearish Divergence Warns the Breakout Could Fail Like April 22
Since late February, Bitcoin has traded inside an ascending channel, a structure where higher swing lows align with rising resistance, signaling steady accumulation. BTC tagged the channel’s upper boundary on April 22, failed to break out, and pulled back. Now, the BTC price has rallied back to the same zone for a second attempt.
Want more token insights like this? Sign up for Editor Harsh Notariya’s Daily Crypto Newsletter here.
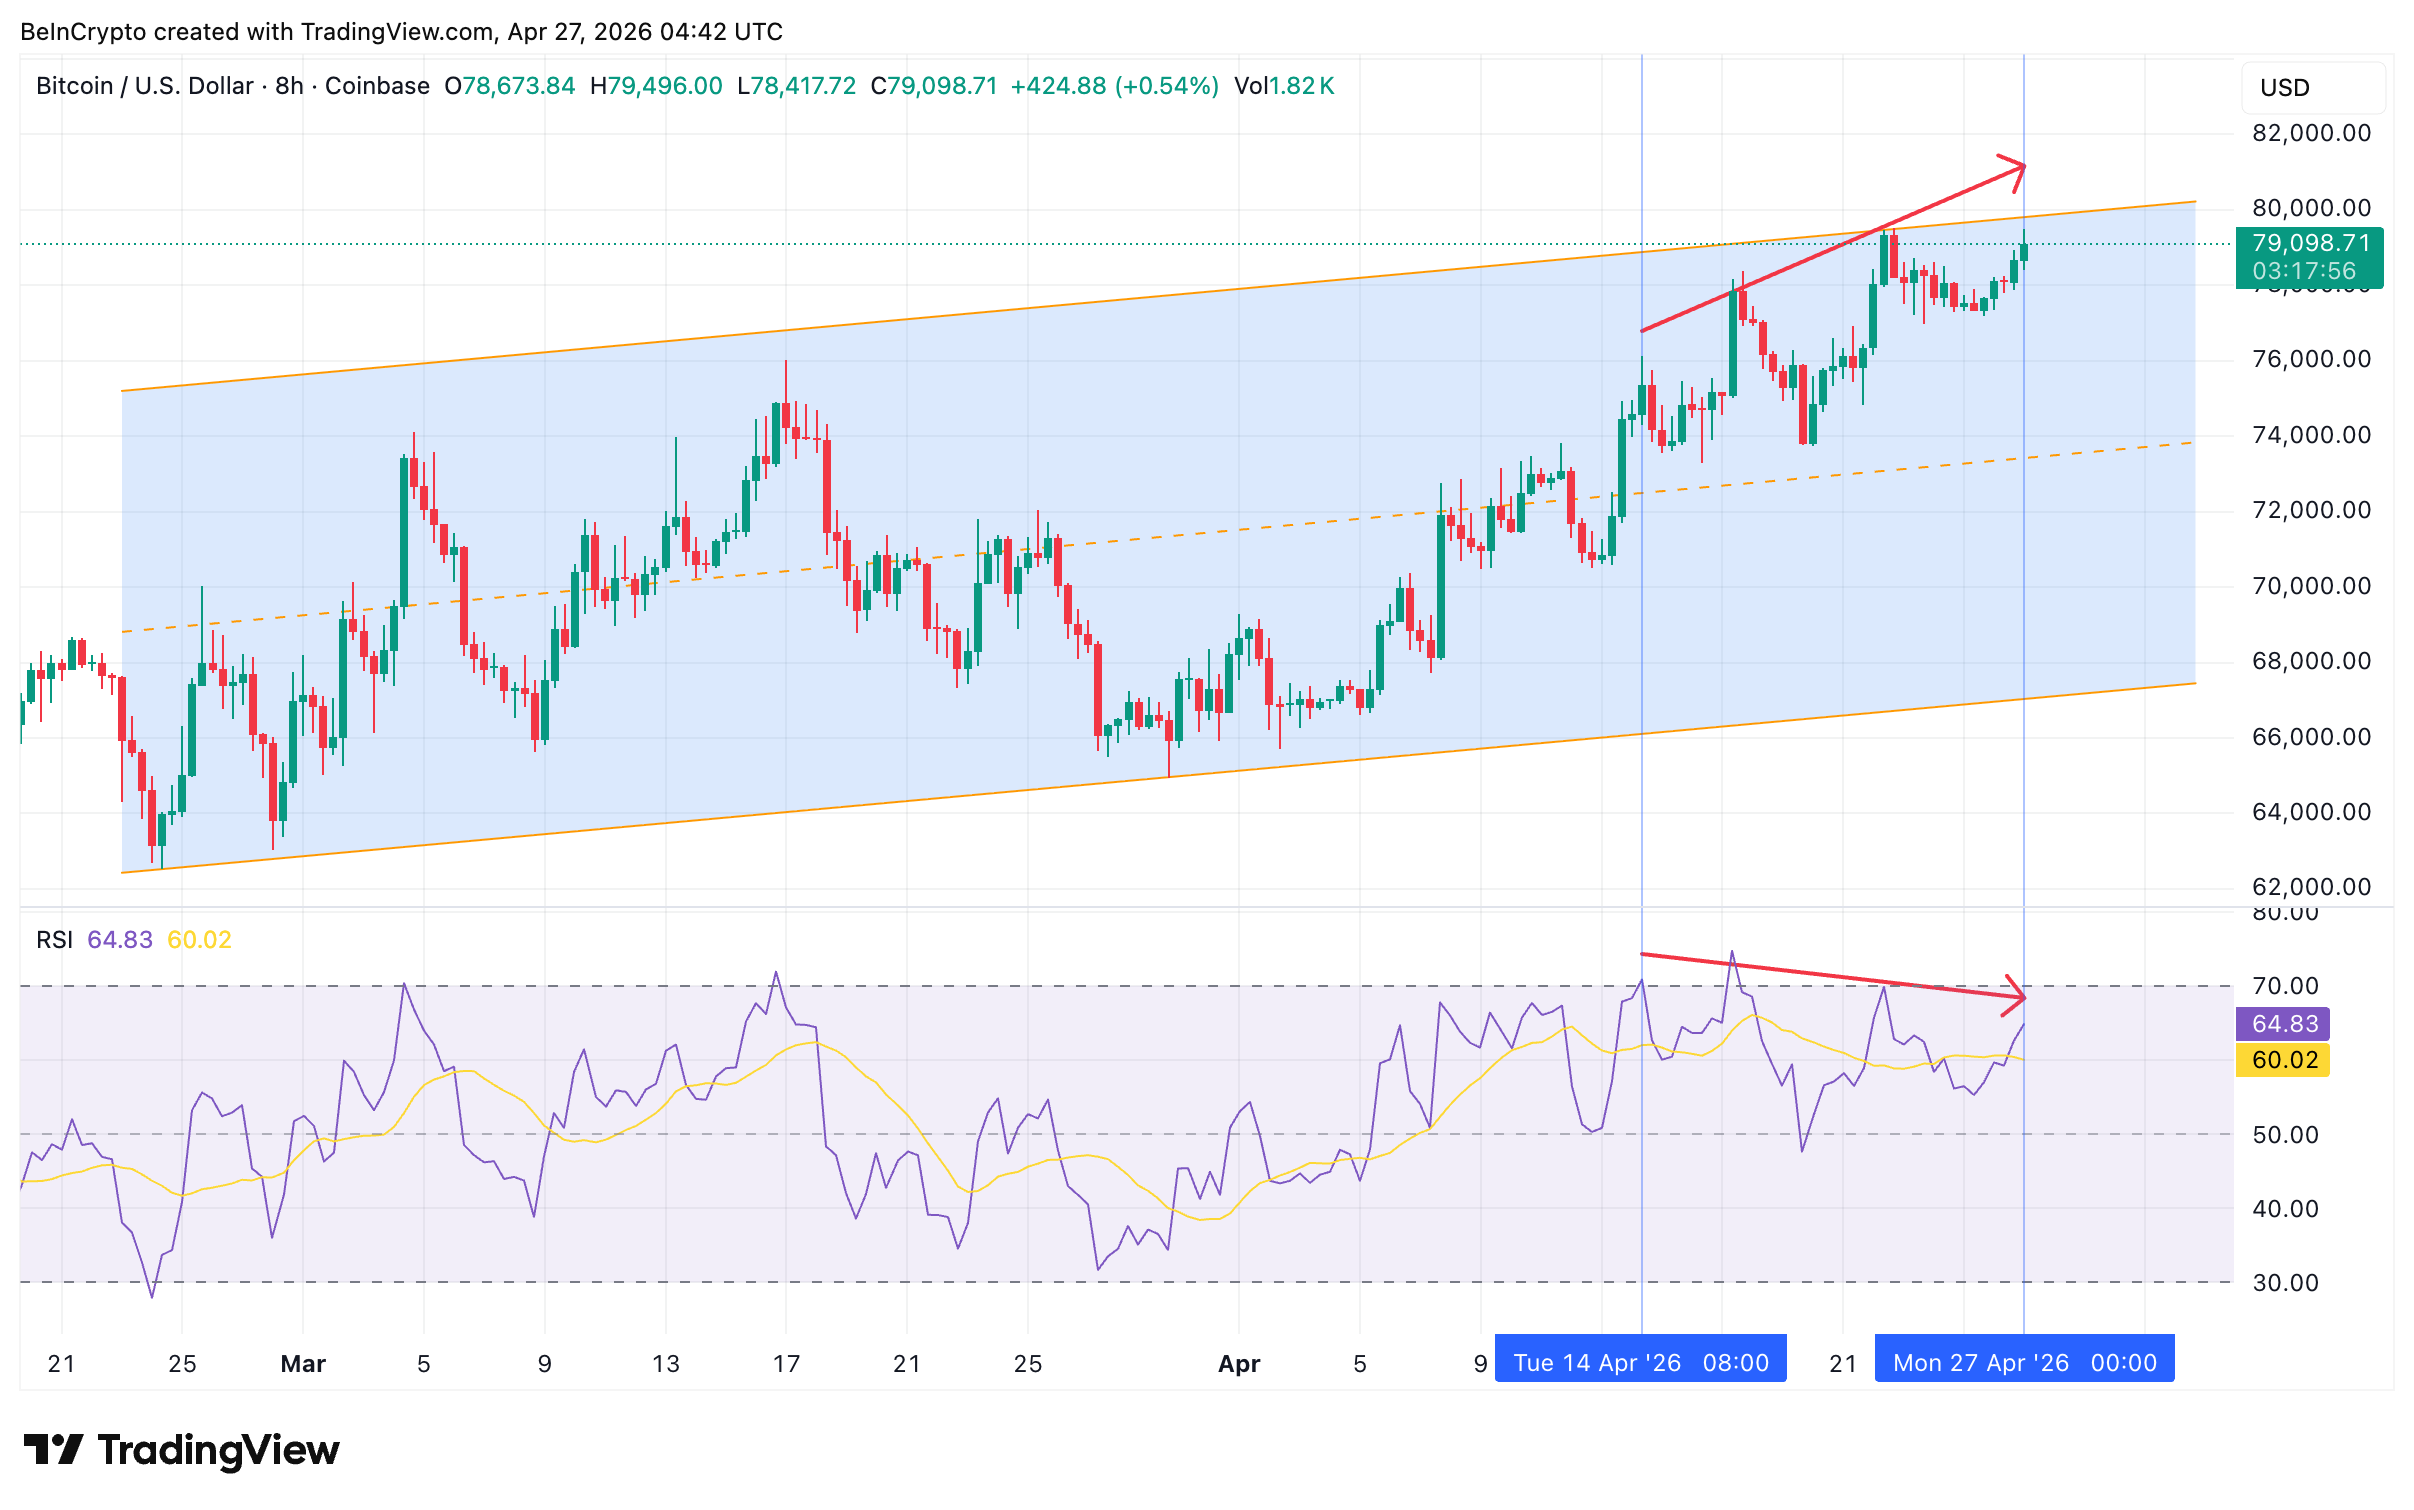
The momentum picture warns this attempt is weaker. Between April 14 and April 27, BTC has been making a higher high in price while the Relative Strength Index (RSI), a momentum indicator that measures the speed of price changes on a 0 to 100 scale, is close to confirming a lower high.
That is a standard bearish divergence, a pattern where price strength outpaces underlying momentum, often preceding a trend reversal. If the next 8-hour candle closes lower than the current one, the divergence confirms and the swing high is locked in.
Coinbase Premium Drop Is the Same Pattern That Triggered April 17 Pullback
The second warning comes from the Coinbase Premium Index, an on-chain metric that compares Bitcoin’s price on Coinbase against other exchanges and serves as a proxy for US demand. On April 22, when BTC attempted its latest breakout, the premium index sat at 0.038. By April 27, it has dropped to 0.020 even as price climbed back. US buyers are walking away while the chart looks bullish.
History shows this divergence resolves with price catching down to demand. Between April 14 and April 16, the Coinbase Premium fell from 0.064 to 0.011 while BTC kept rising. Price held up for one more day, then dropped from $77,089 on April 17 to $73,820 in the next session.
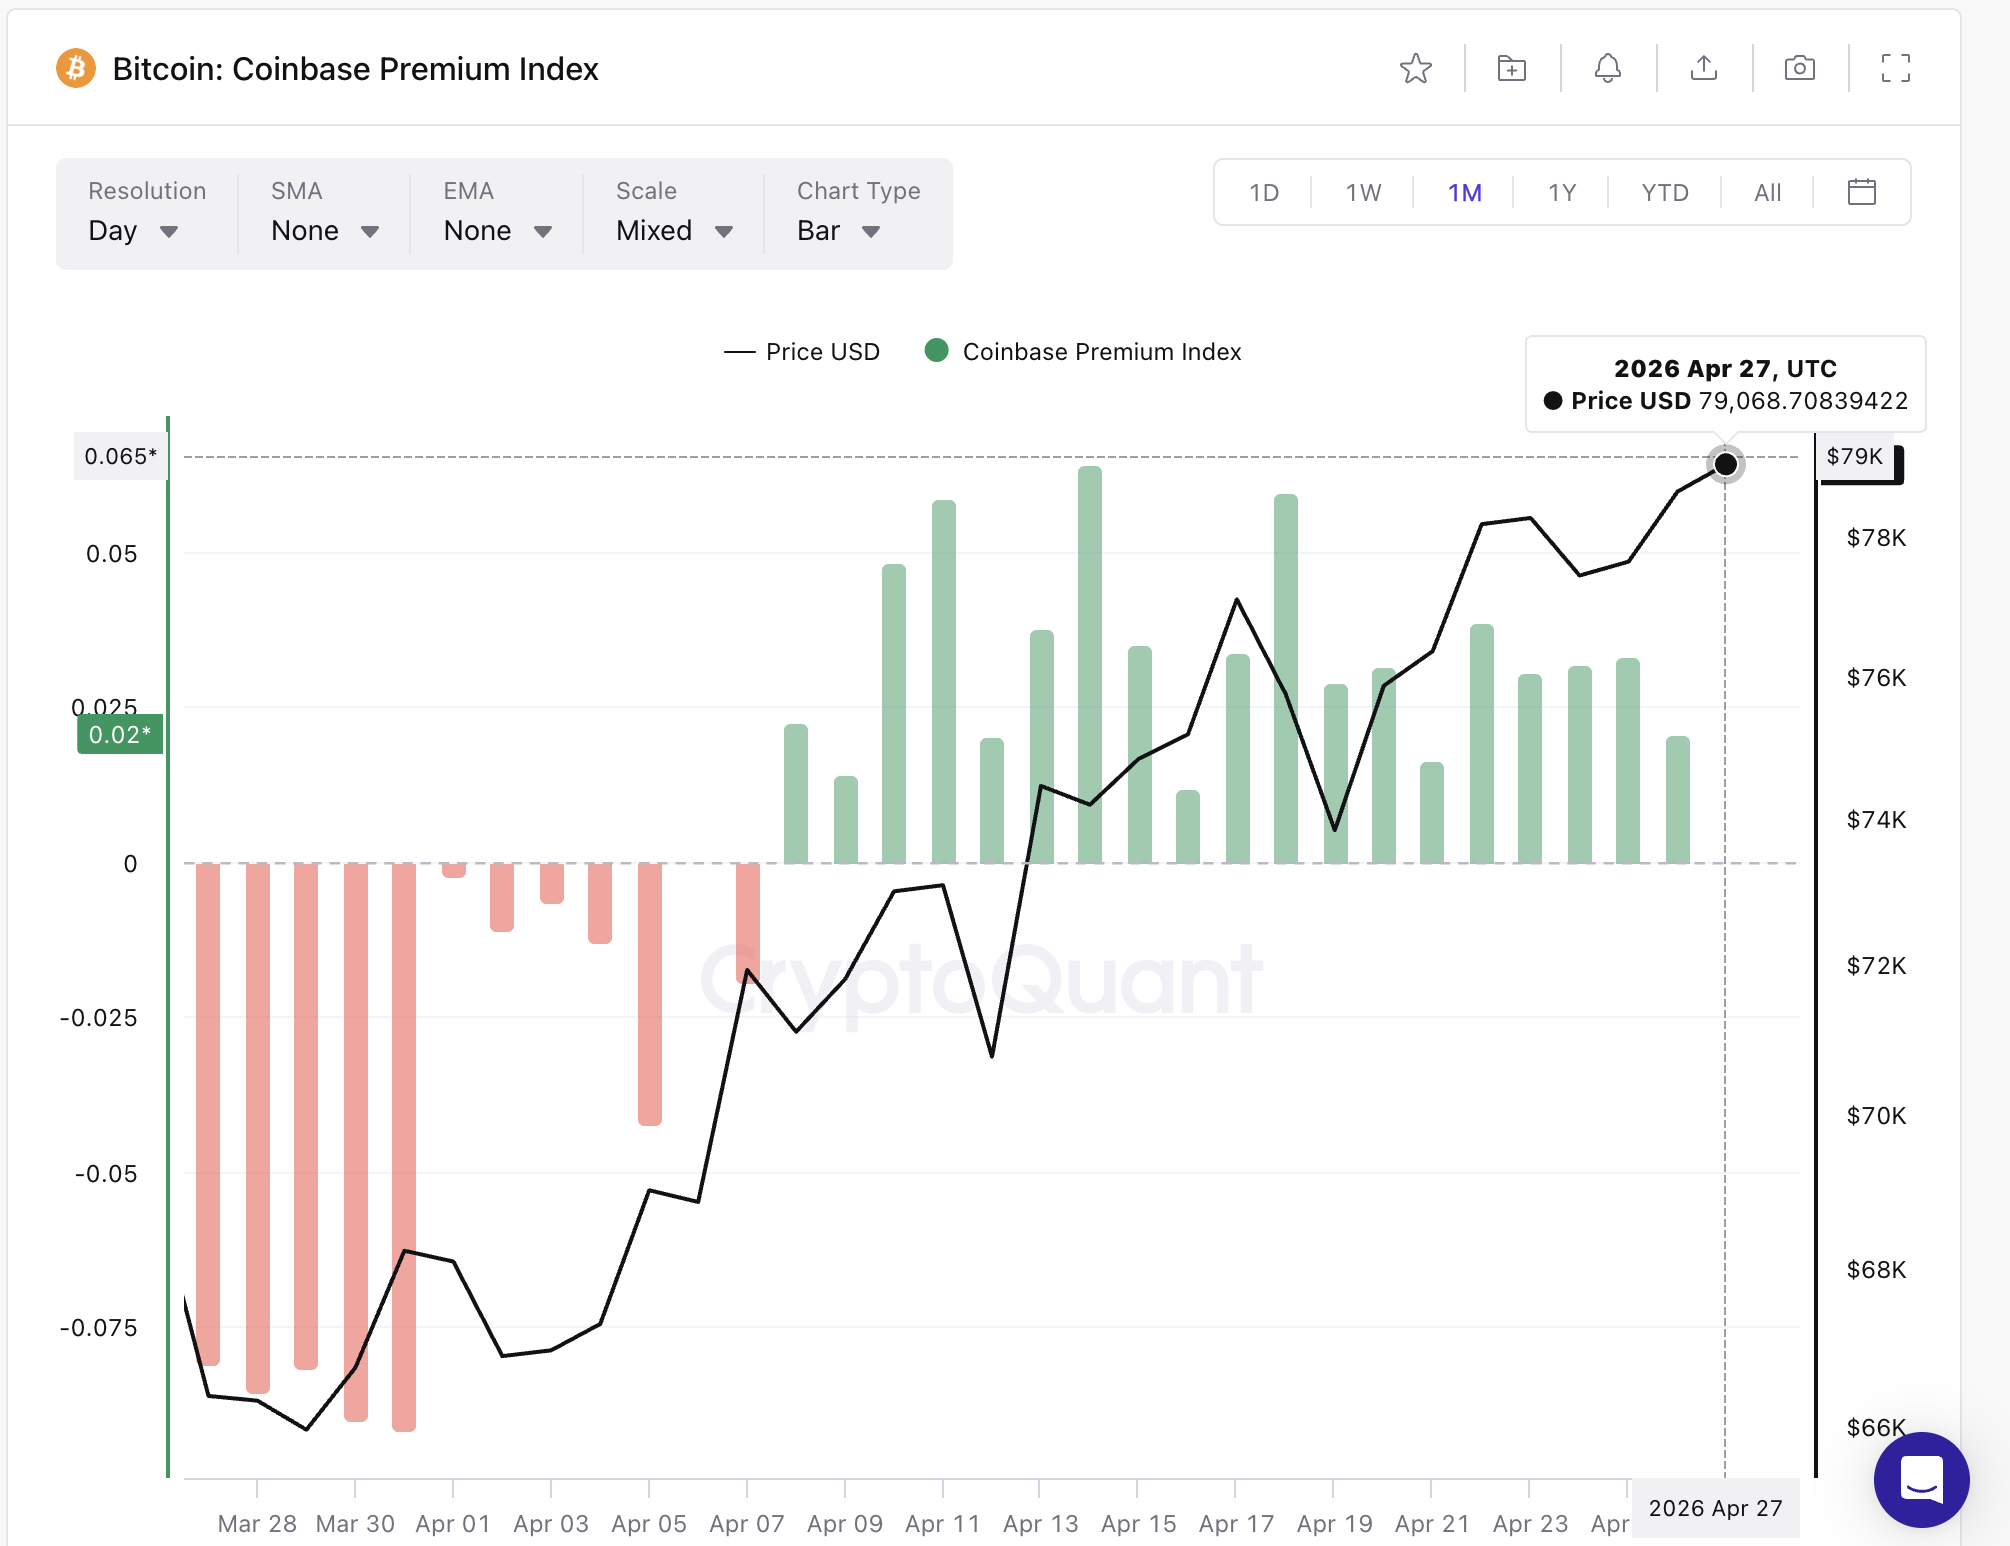
The premium index acts as a leading indicator. When US demand fades, the BTC price usually follows within days. The current setup mirrors that exact sequence, with the premium dropping into a price rally that has not yet broken structure.
Open Interest and Funding Rates Show the Short-Squeeze Fuel Is Drying Up
A breakout sometimes needs no demand. If shorts are heavily positioned, a squeeze can carry price through resistance even when buyers are absent. That fuel is now drying up. Open Interest (OI), the total dollar value of outstanding futures contracts, sat at $34.02 billion on April 22 with the funding rate, a periodic payment between perpetual futures longs and shorts that signals positioning bias, deeply negative at -0.021%.
Heavy short positioning failed to spark a squeeze that day, and the breakout died.
Today’s setup is structurally weaker. OI has dropped to $32.89 billion as $1.13 billion in positions closed out. The funding rate has compressed to -0.002%, ten times smaller than the April 22 reading.
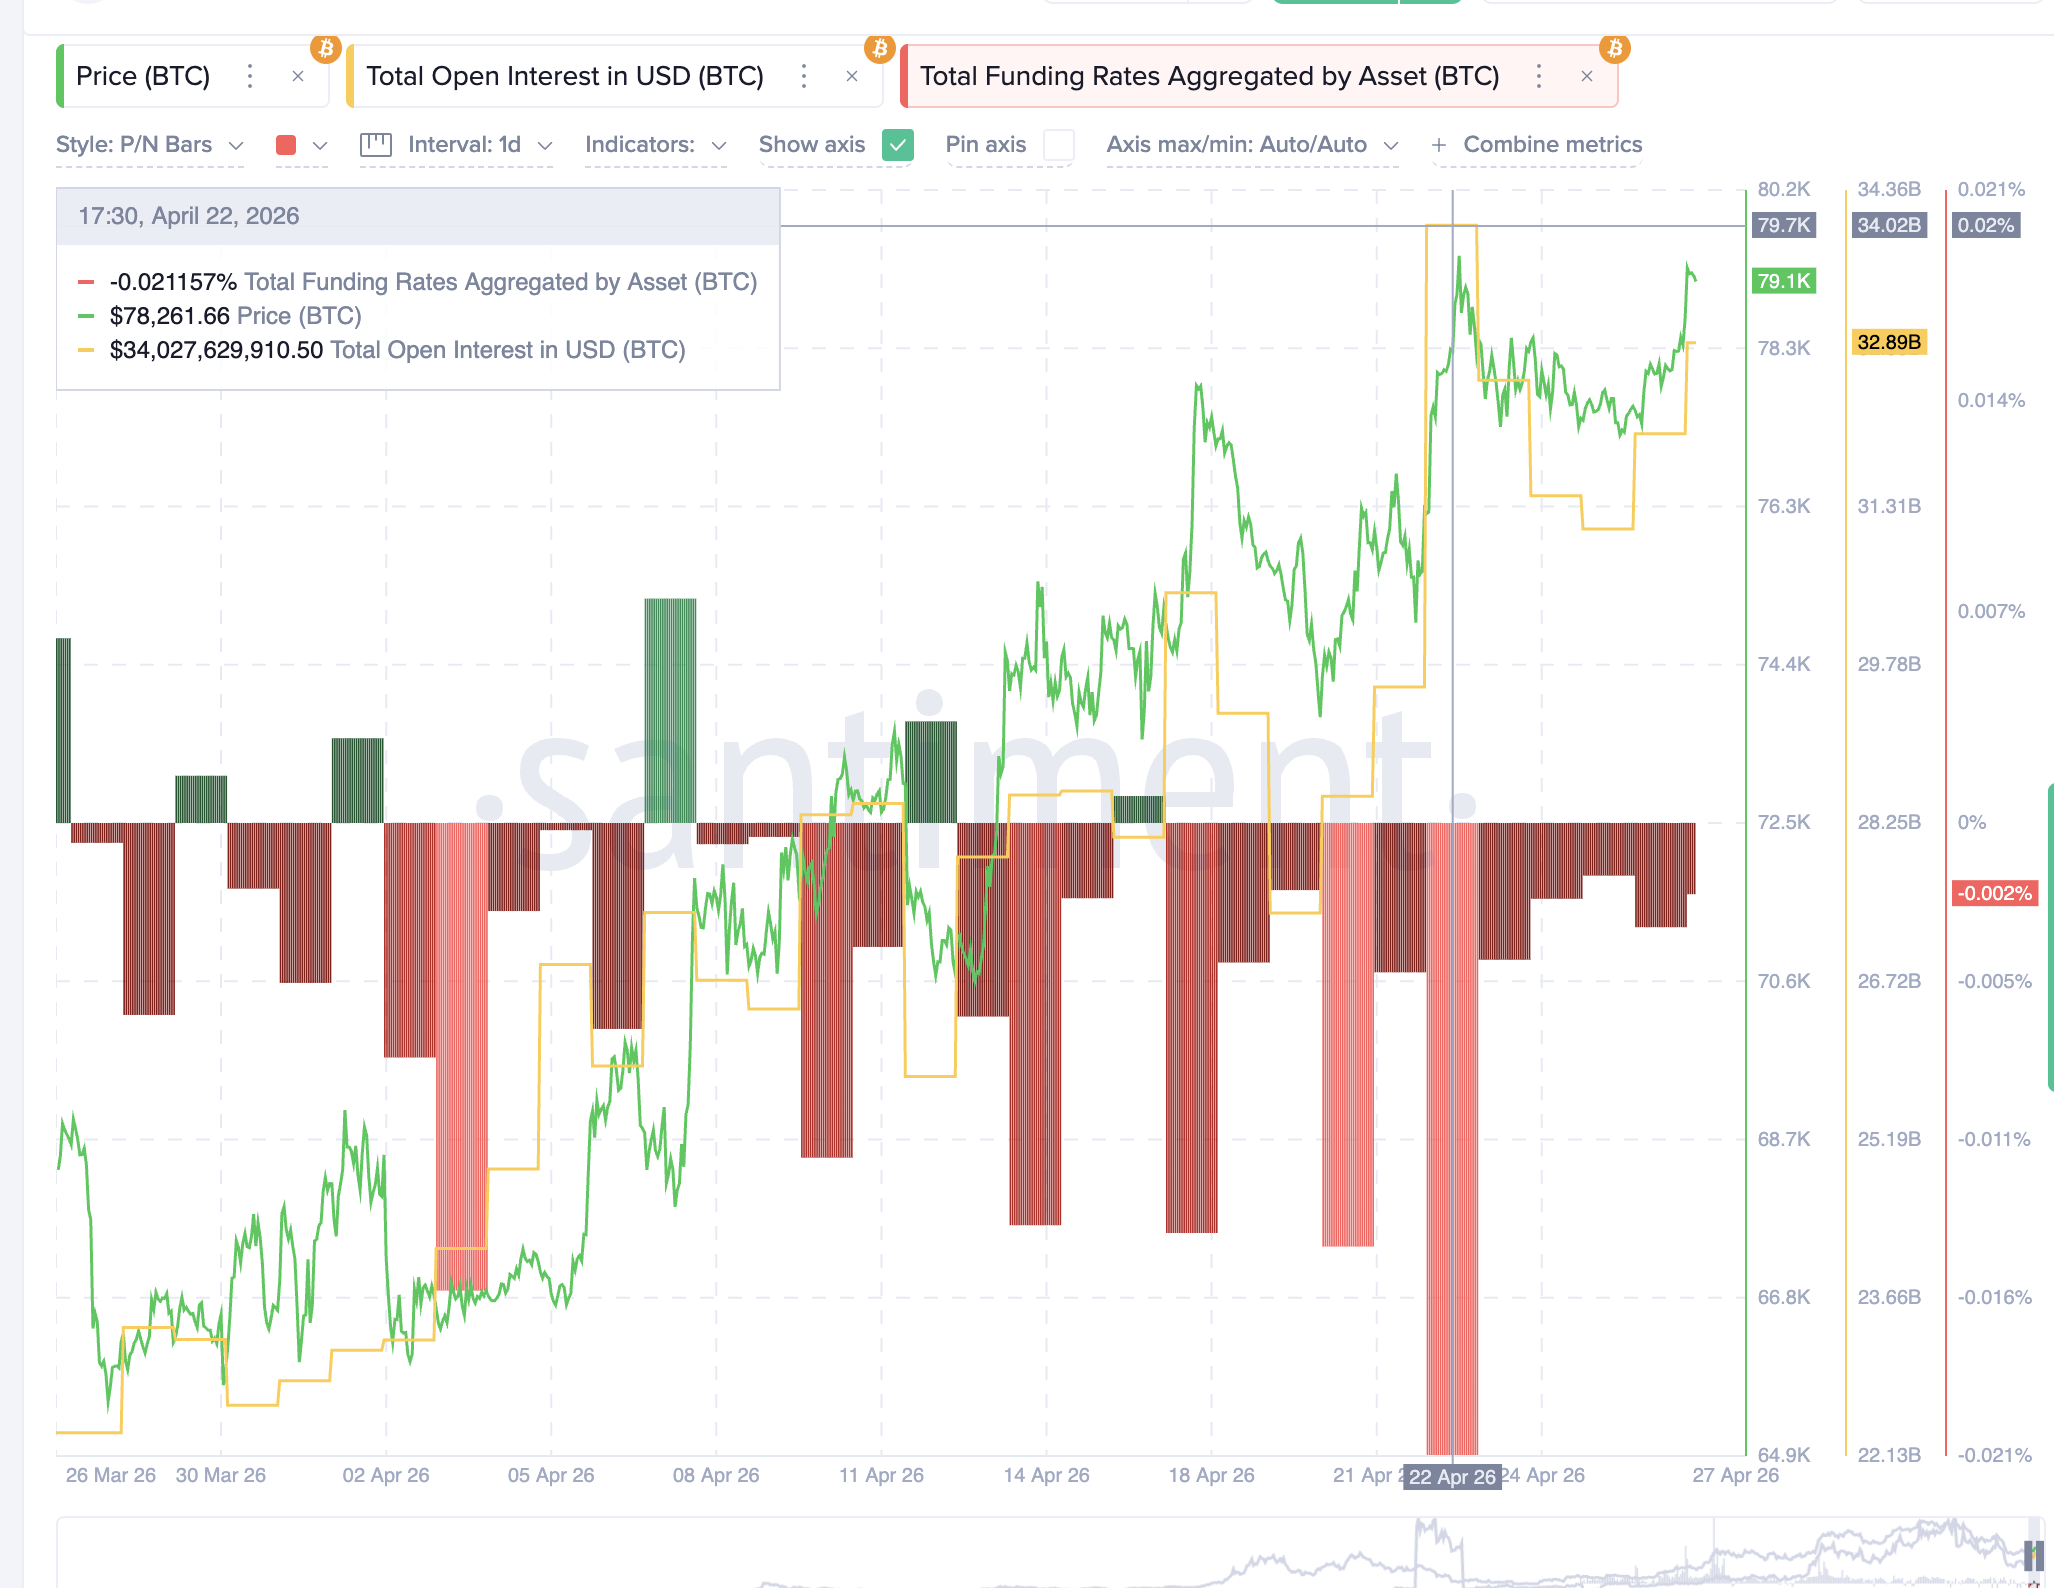
Fewer BTC shorts means less fuel, and a breakout that needs short covering to clear $79,510 has lost its most powerful trigger.
Bitcoin Price Levels: $79,510 Is the Decider, $76,074 Is the First Drop Zone
A clean 8-hour close above $79,510 confirms the breakout. It opens upside toward $80,000, and forces the divergence-based bear case to invalidate. Anything less, including a wick rejection or a daily candle that fails to close above resistance, keeps the structure intact for a pullback.
If the Coinbase Premium signal plays out the way it did between April 14 and April 17, the first downside zone is $76,074. A break below opens $73,948 and $72,230.
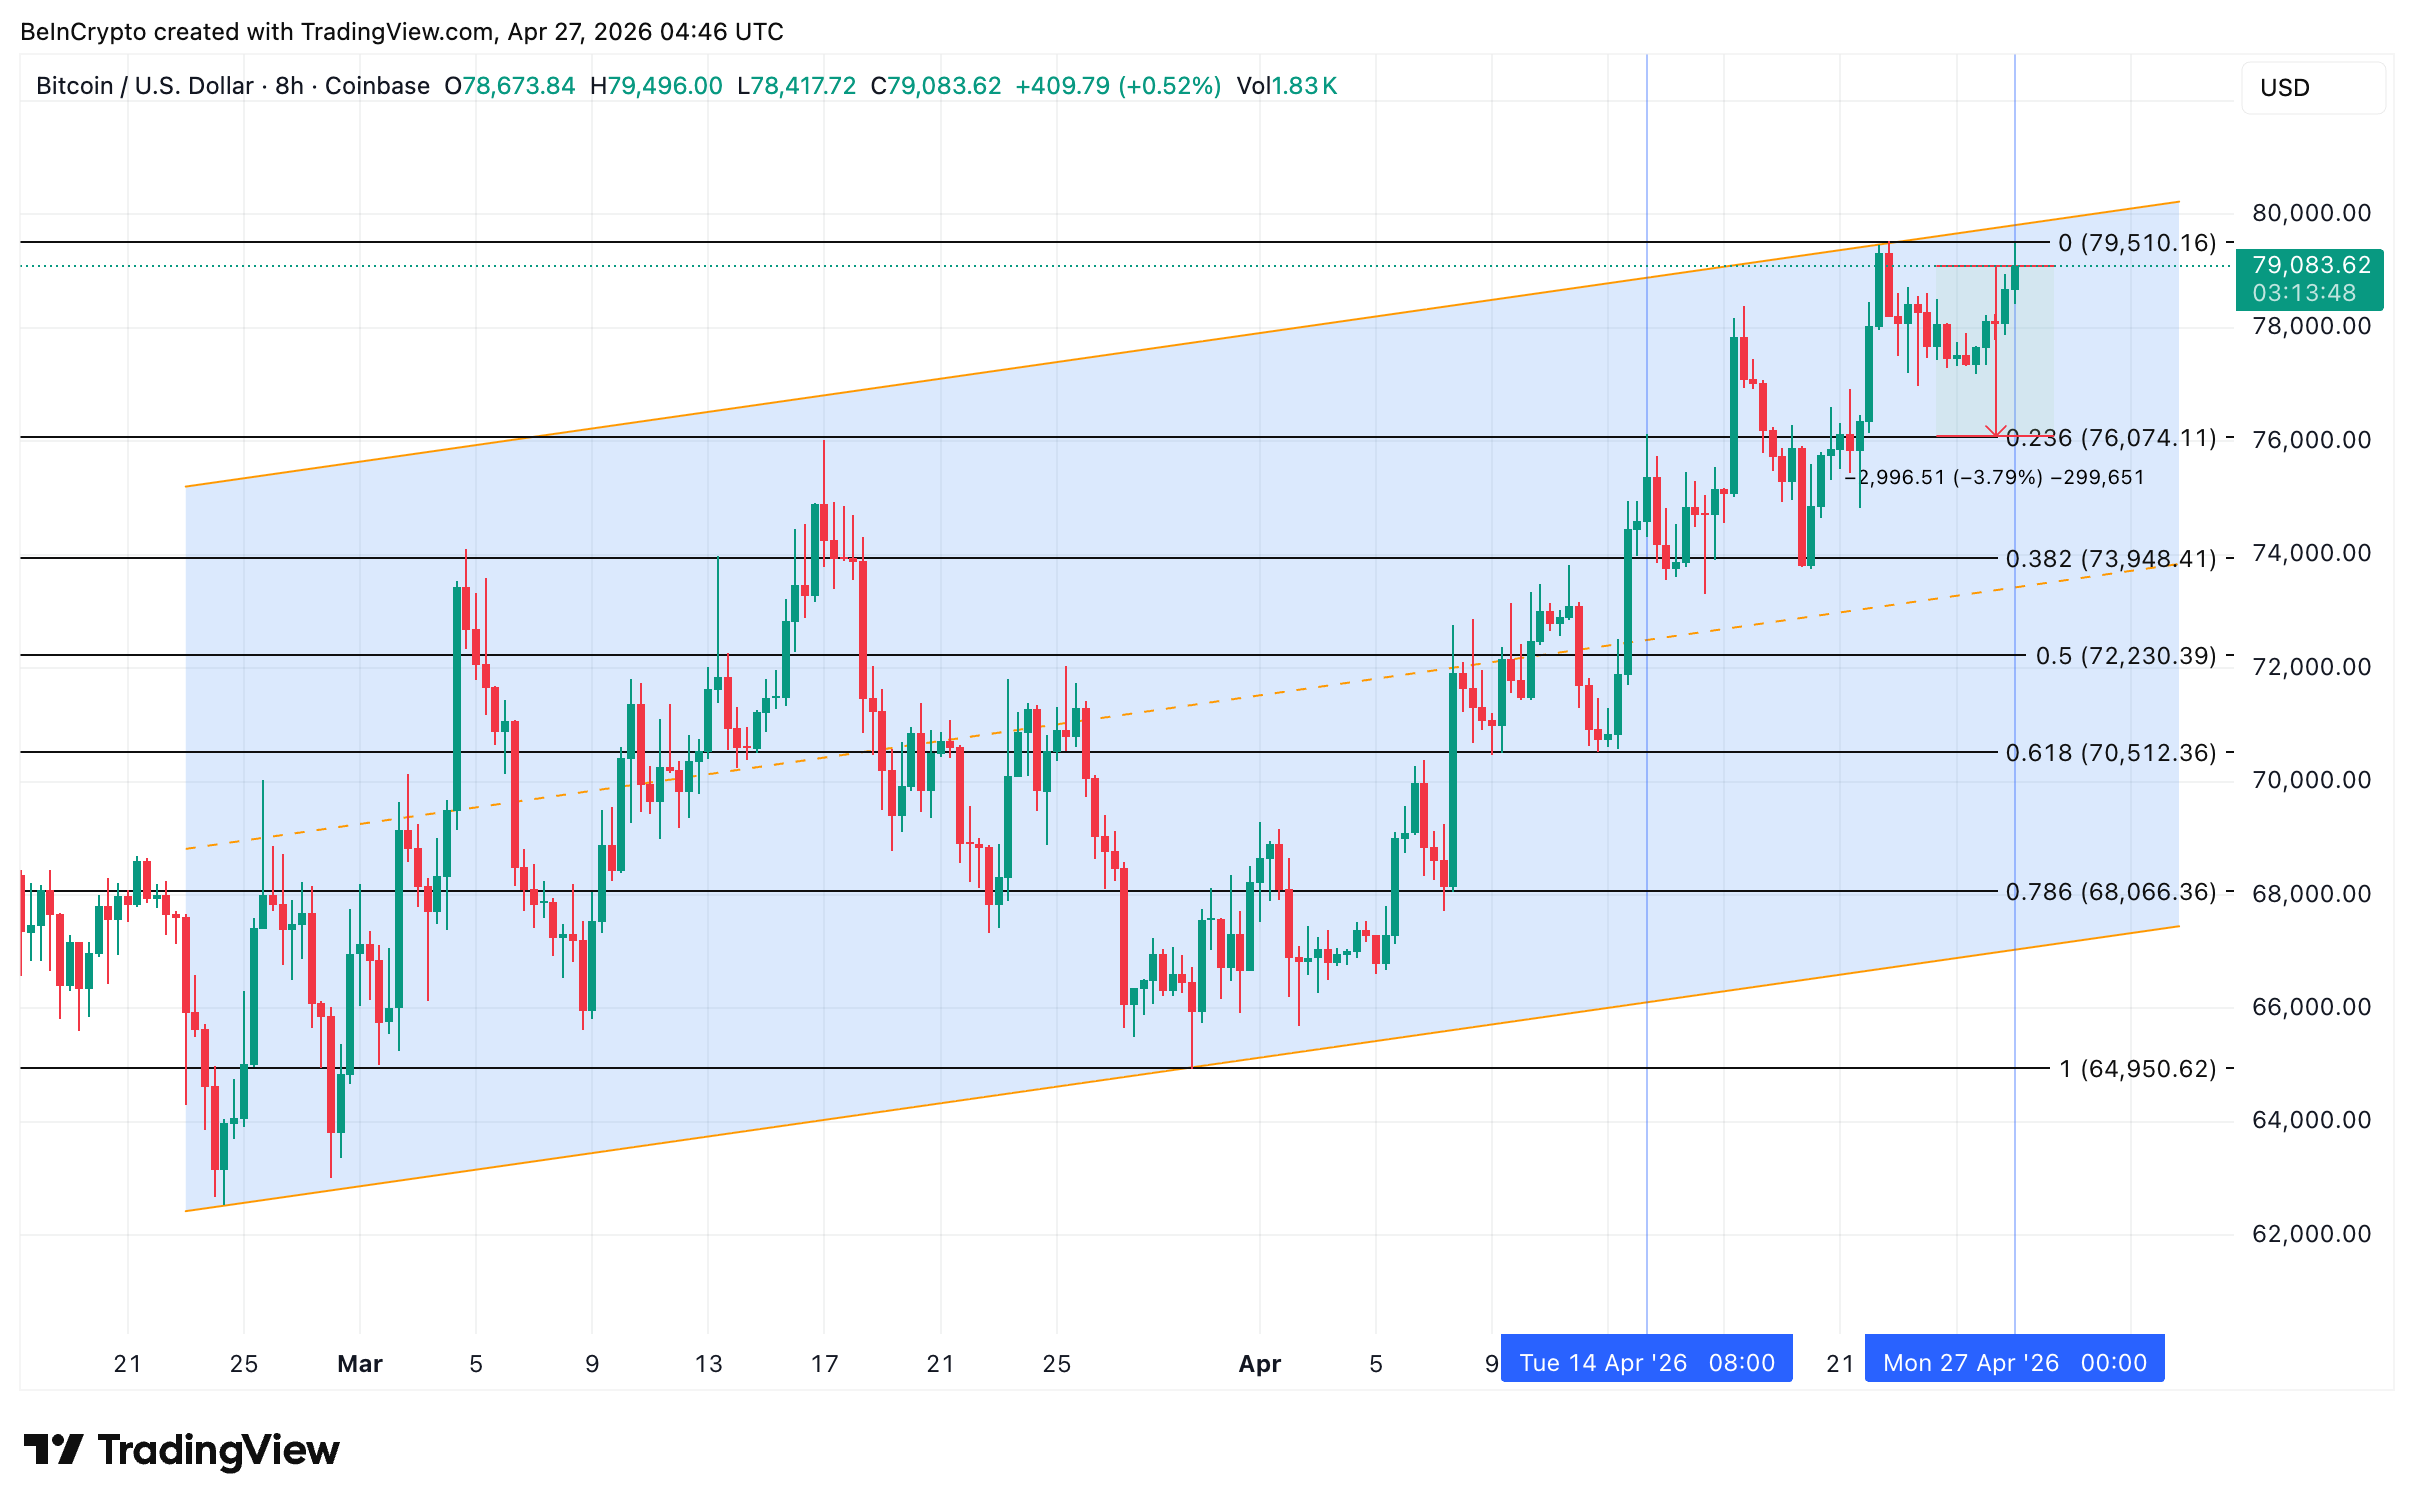
The decisive support sits at $70,512, the 0.618 Fibonacci and the strongest support cluster on the daily chart. A loss of $70,512 weakens the ascending channel structure considerably. For now, the divergence, the demand drop, and the dry squeeze fuel make the breakout hard.
The post Why Bitcoin’s Latest Breakout Attempt Could Fail on a US Demand Problem appeared first on BeInCrypto.