
Solana (SOL) price trades at $84.15 on the 12-hour chart, attempting a rebound from the $82.93 support. A hidden bullish divergence has formed between April 15 and April 19, signaling that selling momentum may be exhausting.
However, rising sell volume and a massive spike in exchange inflows complicate the setup. Someone is consistently offloading SOL into each rebound attempt, and the DeFi contagion spreading from Ethereum explains why.
Price Flashes a Rebound Signal but Sell Volume Tells a Different Story
Solana price peaked at $90.79 on April 17 before pulling back sharply. The low at $82.93 on April 19 marked a higher low compared a level reached on April 15. During that same window, the Relative Strength Index (RSI) printed a lower low. RSI is a momentum indicator that measures the speed of recent price changes.
That pattern is a hidden bullish divergence. Price made a higher low while RSI made a lower low, which typically signals that selling pressure is weakening. A rebound attempt has already started from that level.
Want more token insights like this? Sign up for Editor Harsh Notariya’s Daily Crypto Newsletter here.
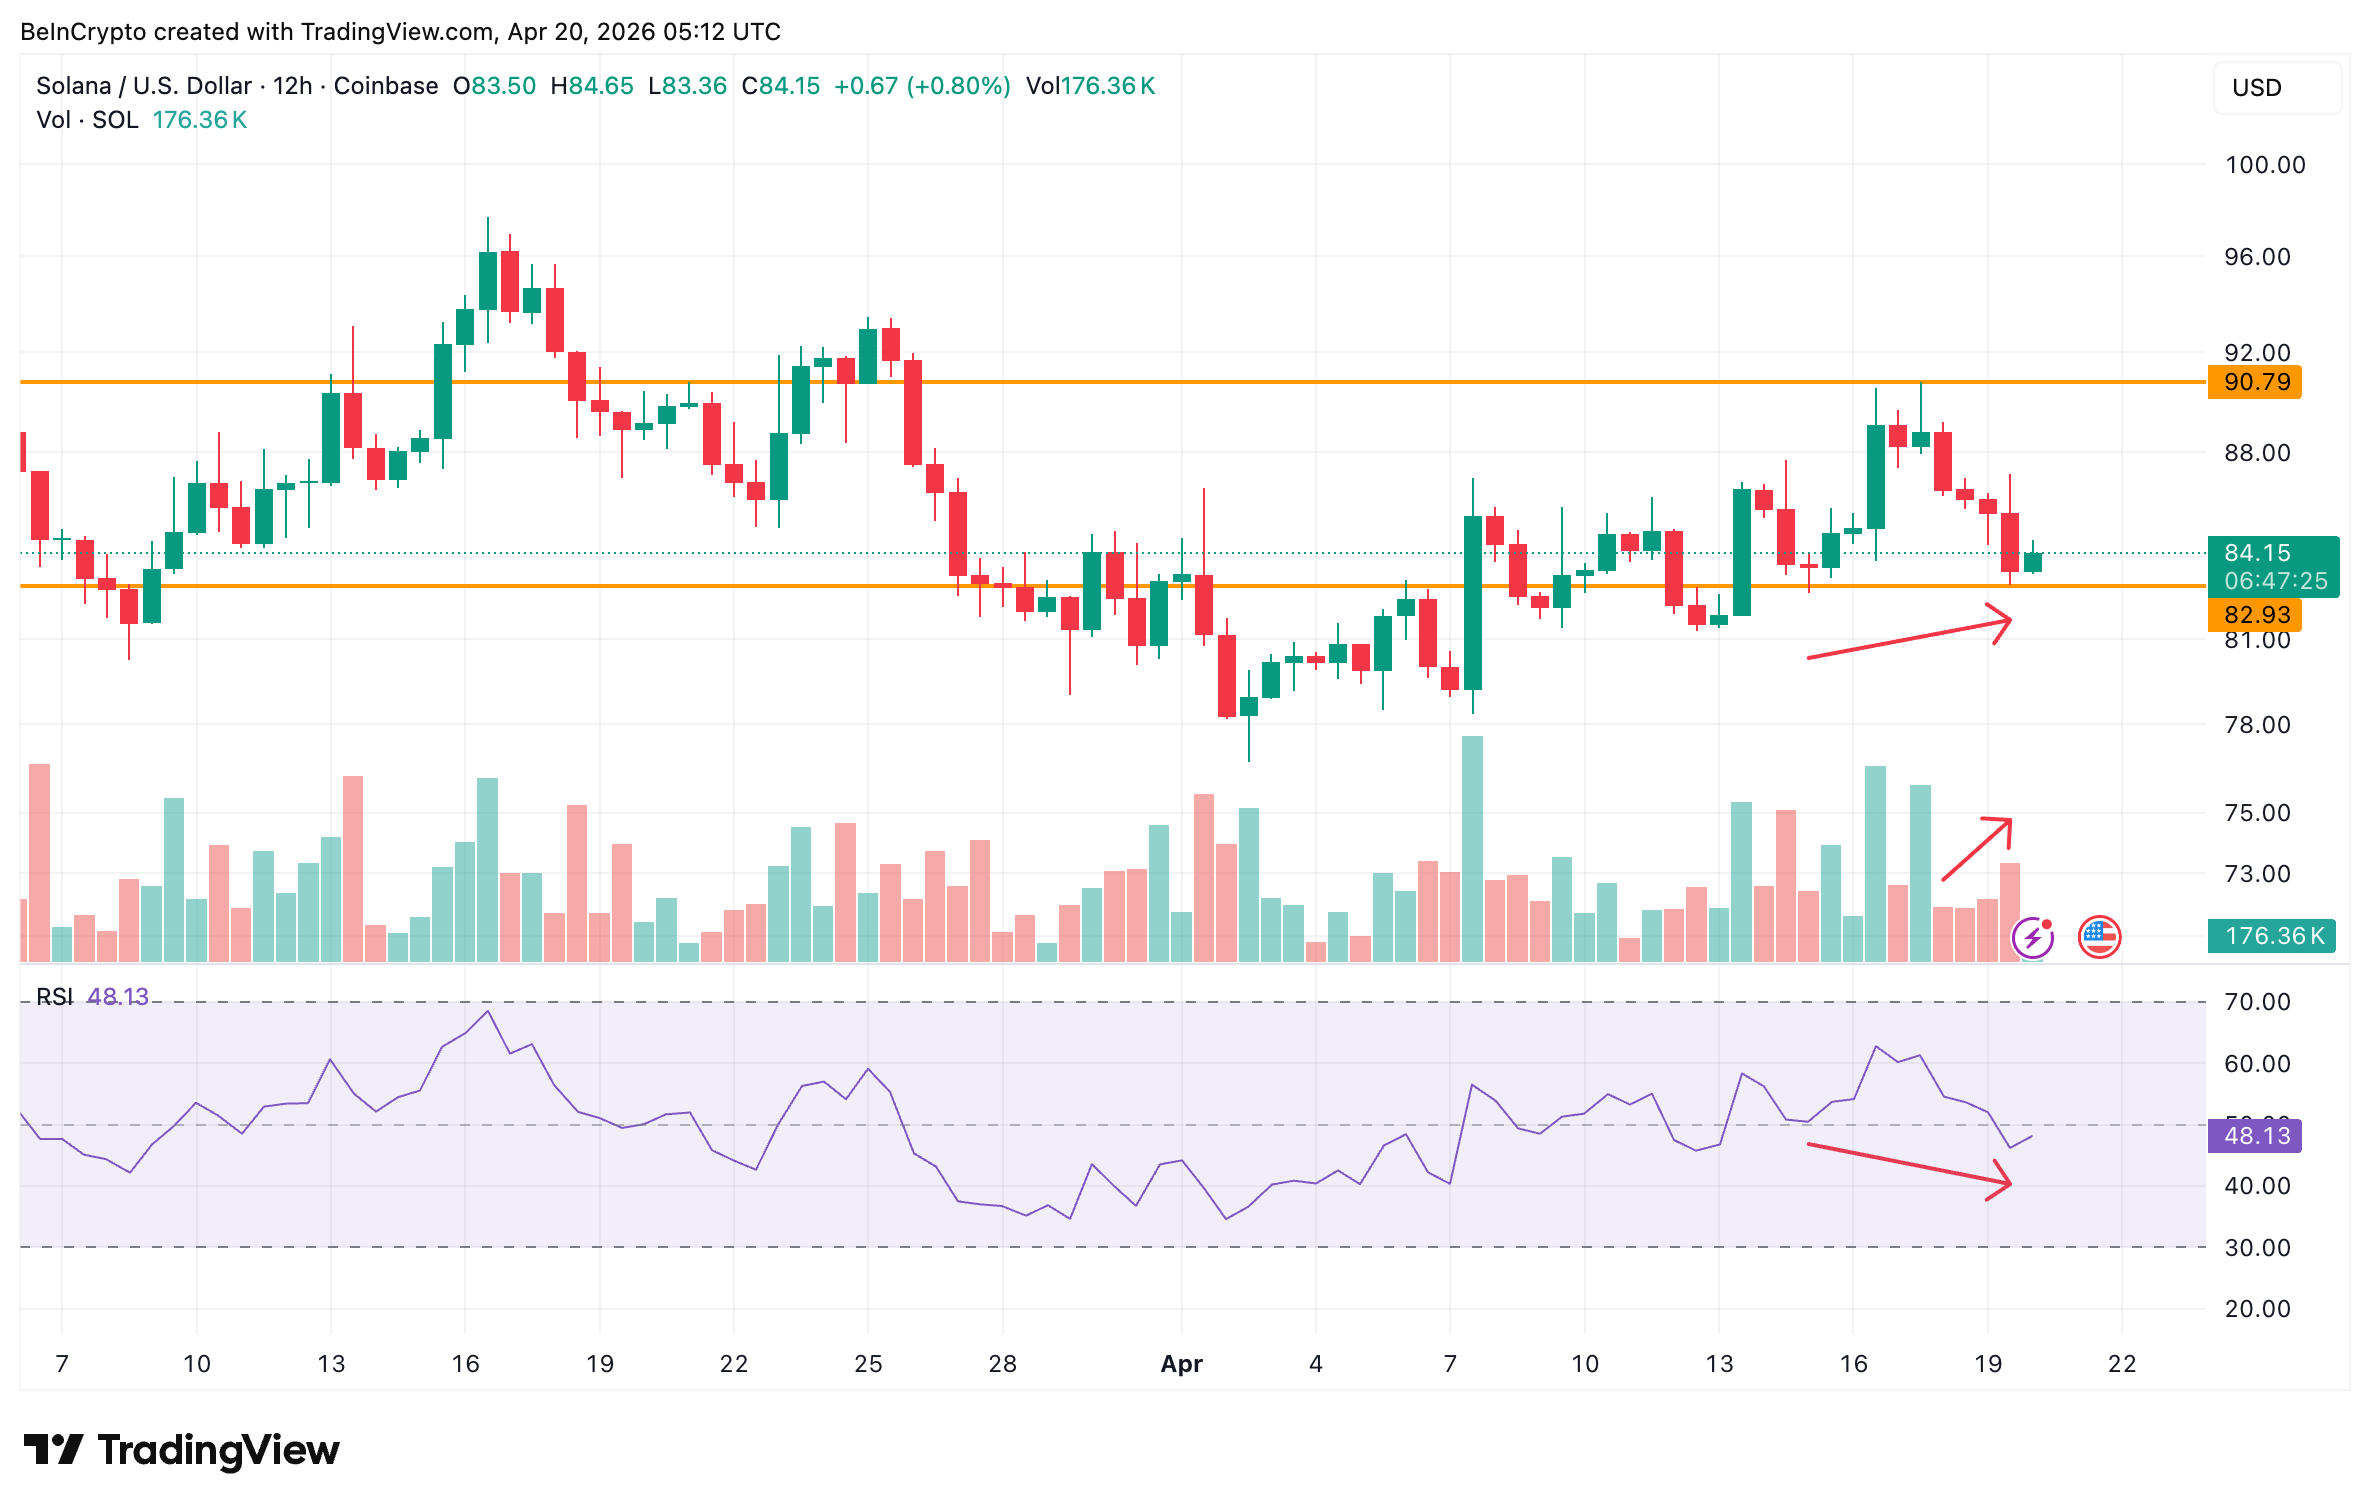
Yet volume tells the opposite story. Sell-side volume has been rising since April 18, even as RSI suggests momentum is fading. That combination carries a specific meaning. Fewer percentage moves per sell wave, paired with more participants, points to distribution rather than panic. Someone is consistently unloading SOL into each small rebound.
Meanwhile, the likely source is the spreading DeFi contagion. Following the KelpDAO rsETH exploit, Solana’s Kamino Prime Market USDC reserve hit 100% utilization on April 20.
Zero liquidity is available. Multiple USDC vaults are above 95% utilization. Funds with stuck USDC positions may be selling SOL on spot markets to raise cash. That pressure creates the supply cap the chart is showing.
Exchange Inflows Surge 1,102% as Hodlers Add Nearly 500K SOL
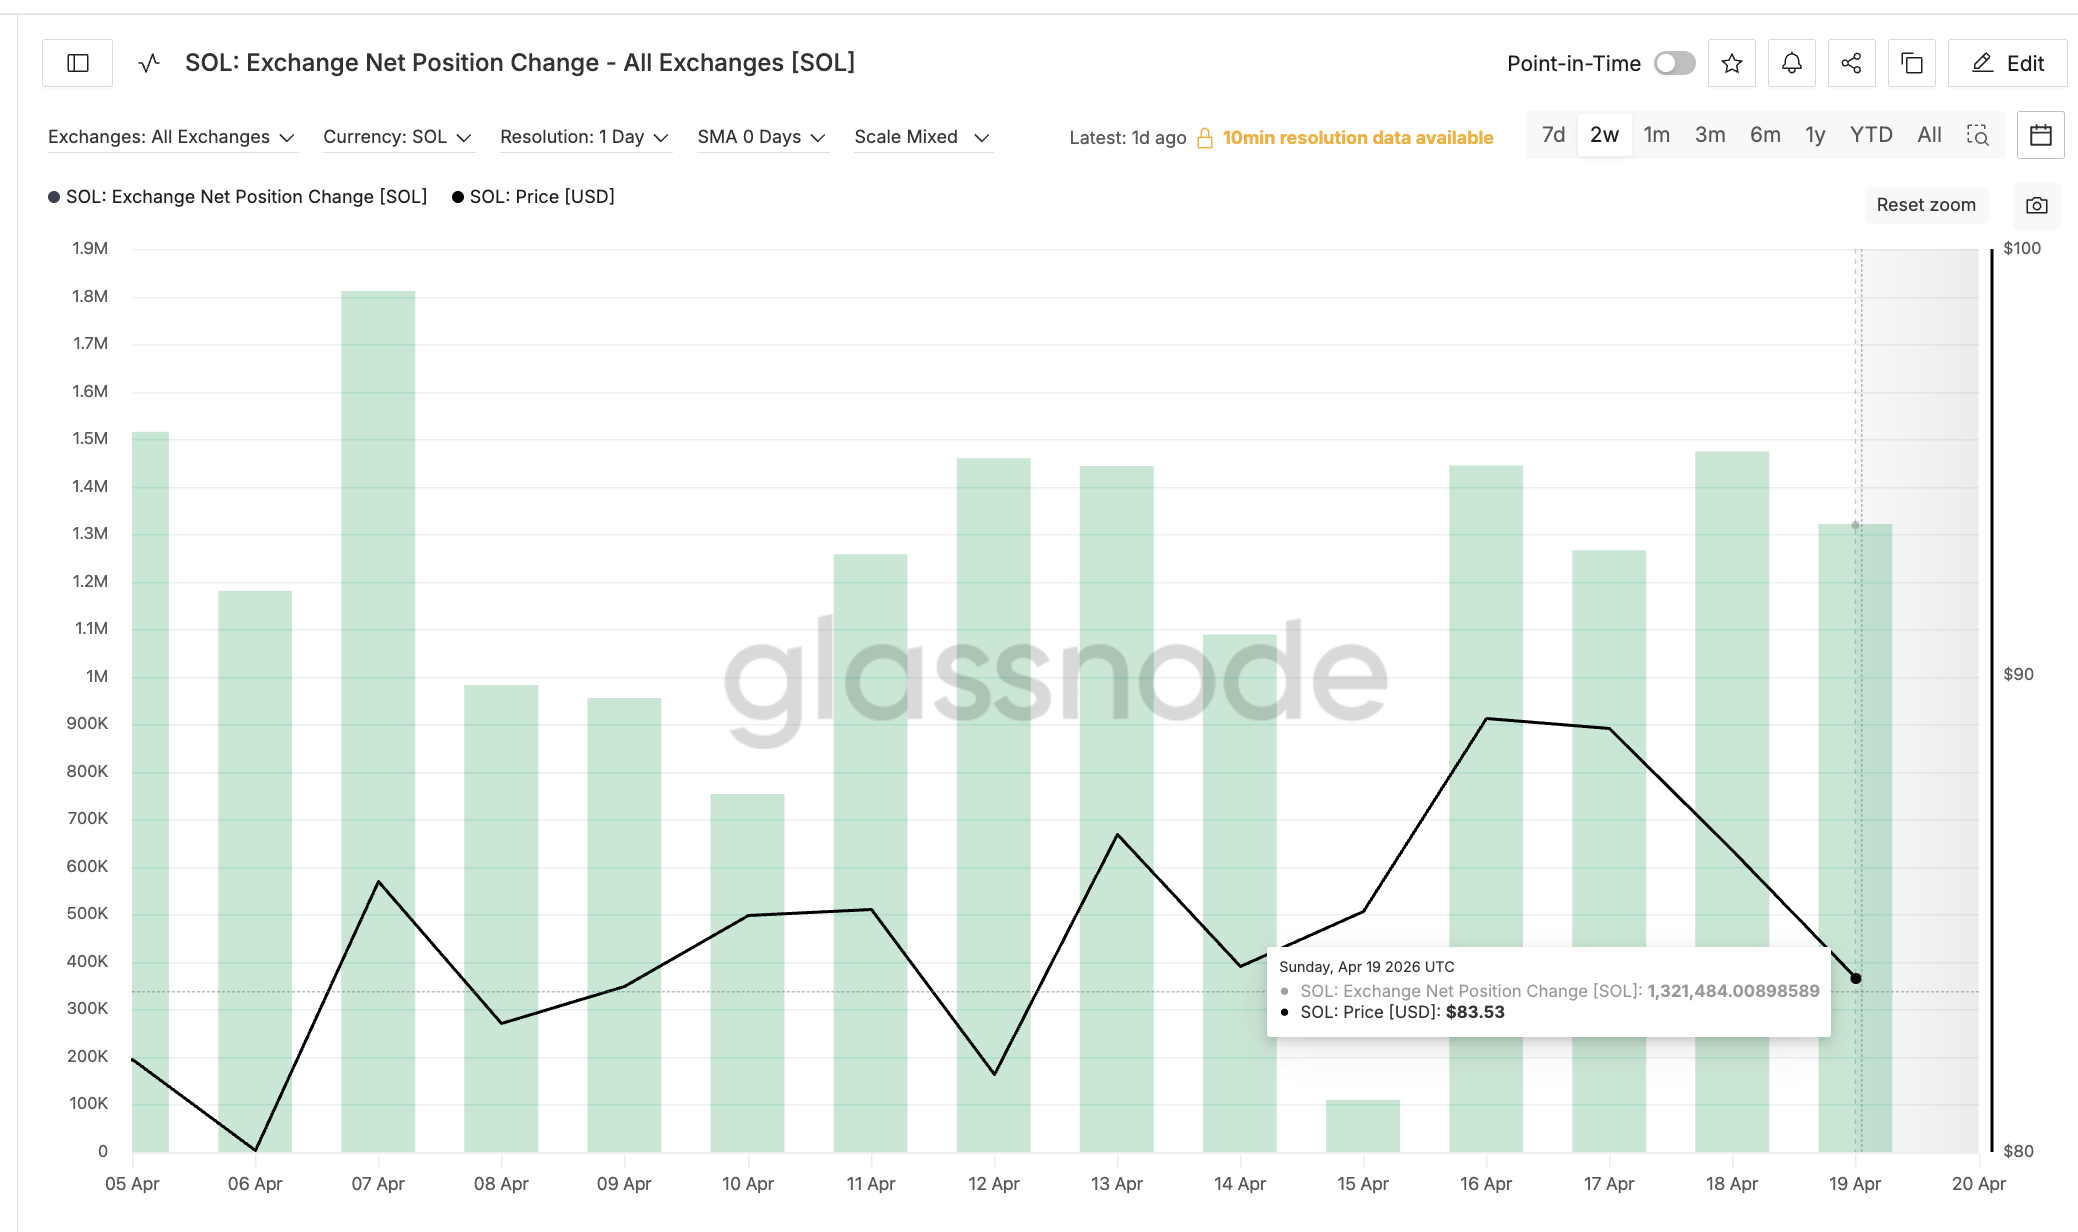
On-chain data confirms the forced-selling thesis. The SOL Exchange Net Position Change has exploded. This metric tracks the 30-day flow of coins into or out of exchange wallets.
Meanwhile, on April 15, the metric read 109,932 SOL. By April 19, it had surged to 1,321,484 SOL. That is a 1,102% increase in four days. More SOL is now sitting on exchanges, typically a precursor to selling.
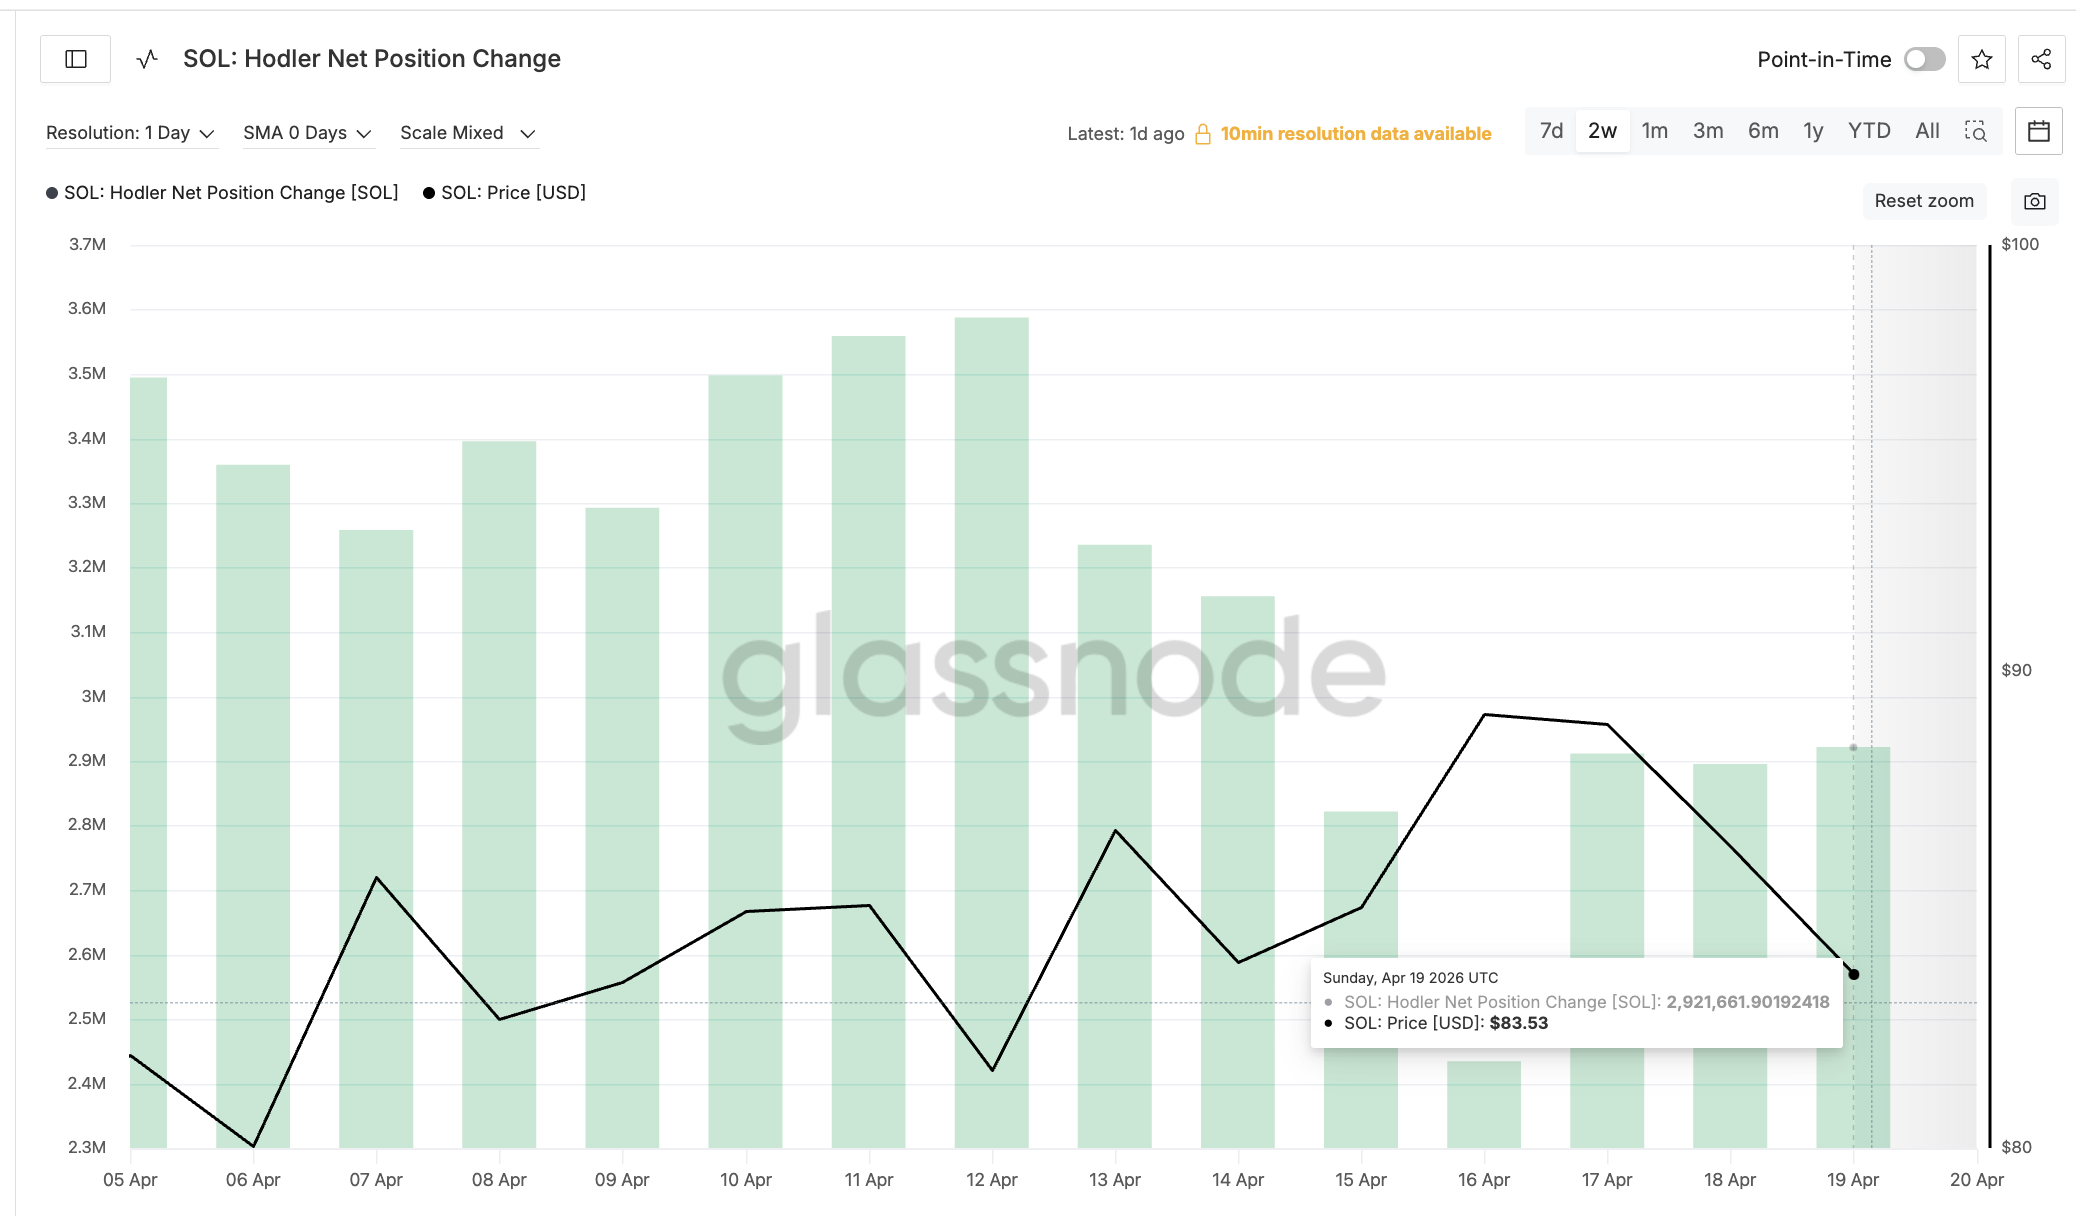
Yet the other side of the market is doing the opposite. The SOL Hodler Net Position Change is climbing. This metric tracks the 30-day change in supply held by wallets older than 155 days.
On April 16, hodlers held a net 2,434,566 SOL added over the prior month. By April 19, that figure had climbed to 2,921,661 SOL. Long-term holders added roughly 487,000 SOL in three days, a 20% jump.
The split is the key to the entire picture. Forced sellers from the DeFi crisis are possibly depositing to exchanges. Long-term holders are absorbing the supply. That structure produces a shallow rebound rather than a collapse, with each side fighting for control at specific price levels.
Solana Price Levels That Decide Between a Shallow Bounce and a Breakdown
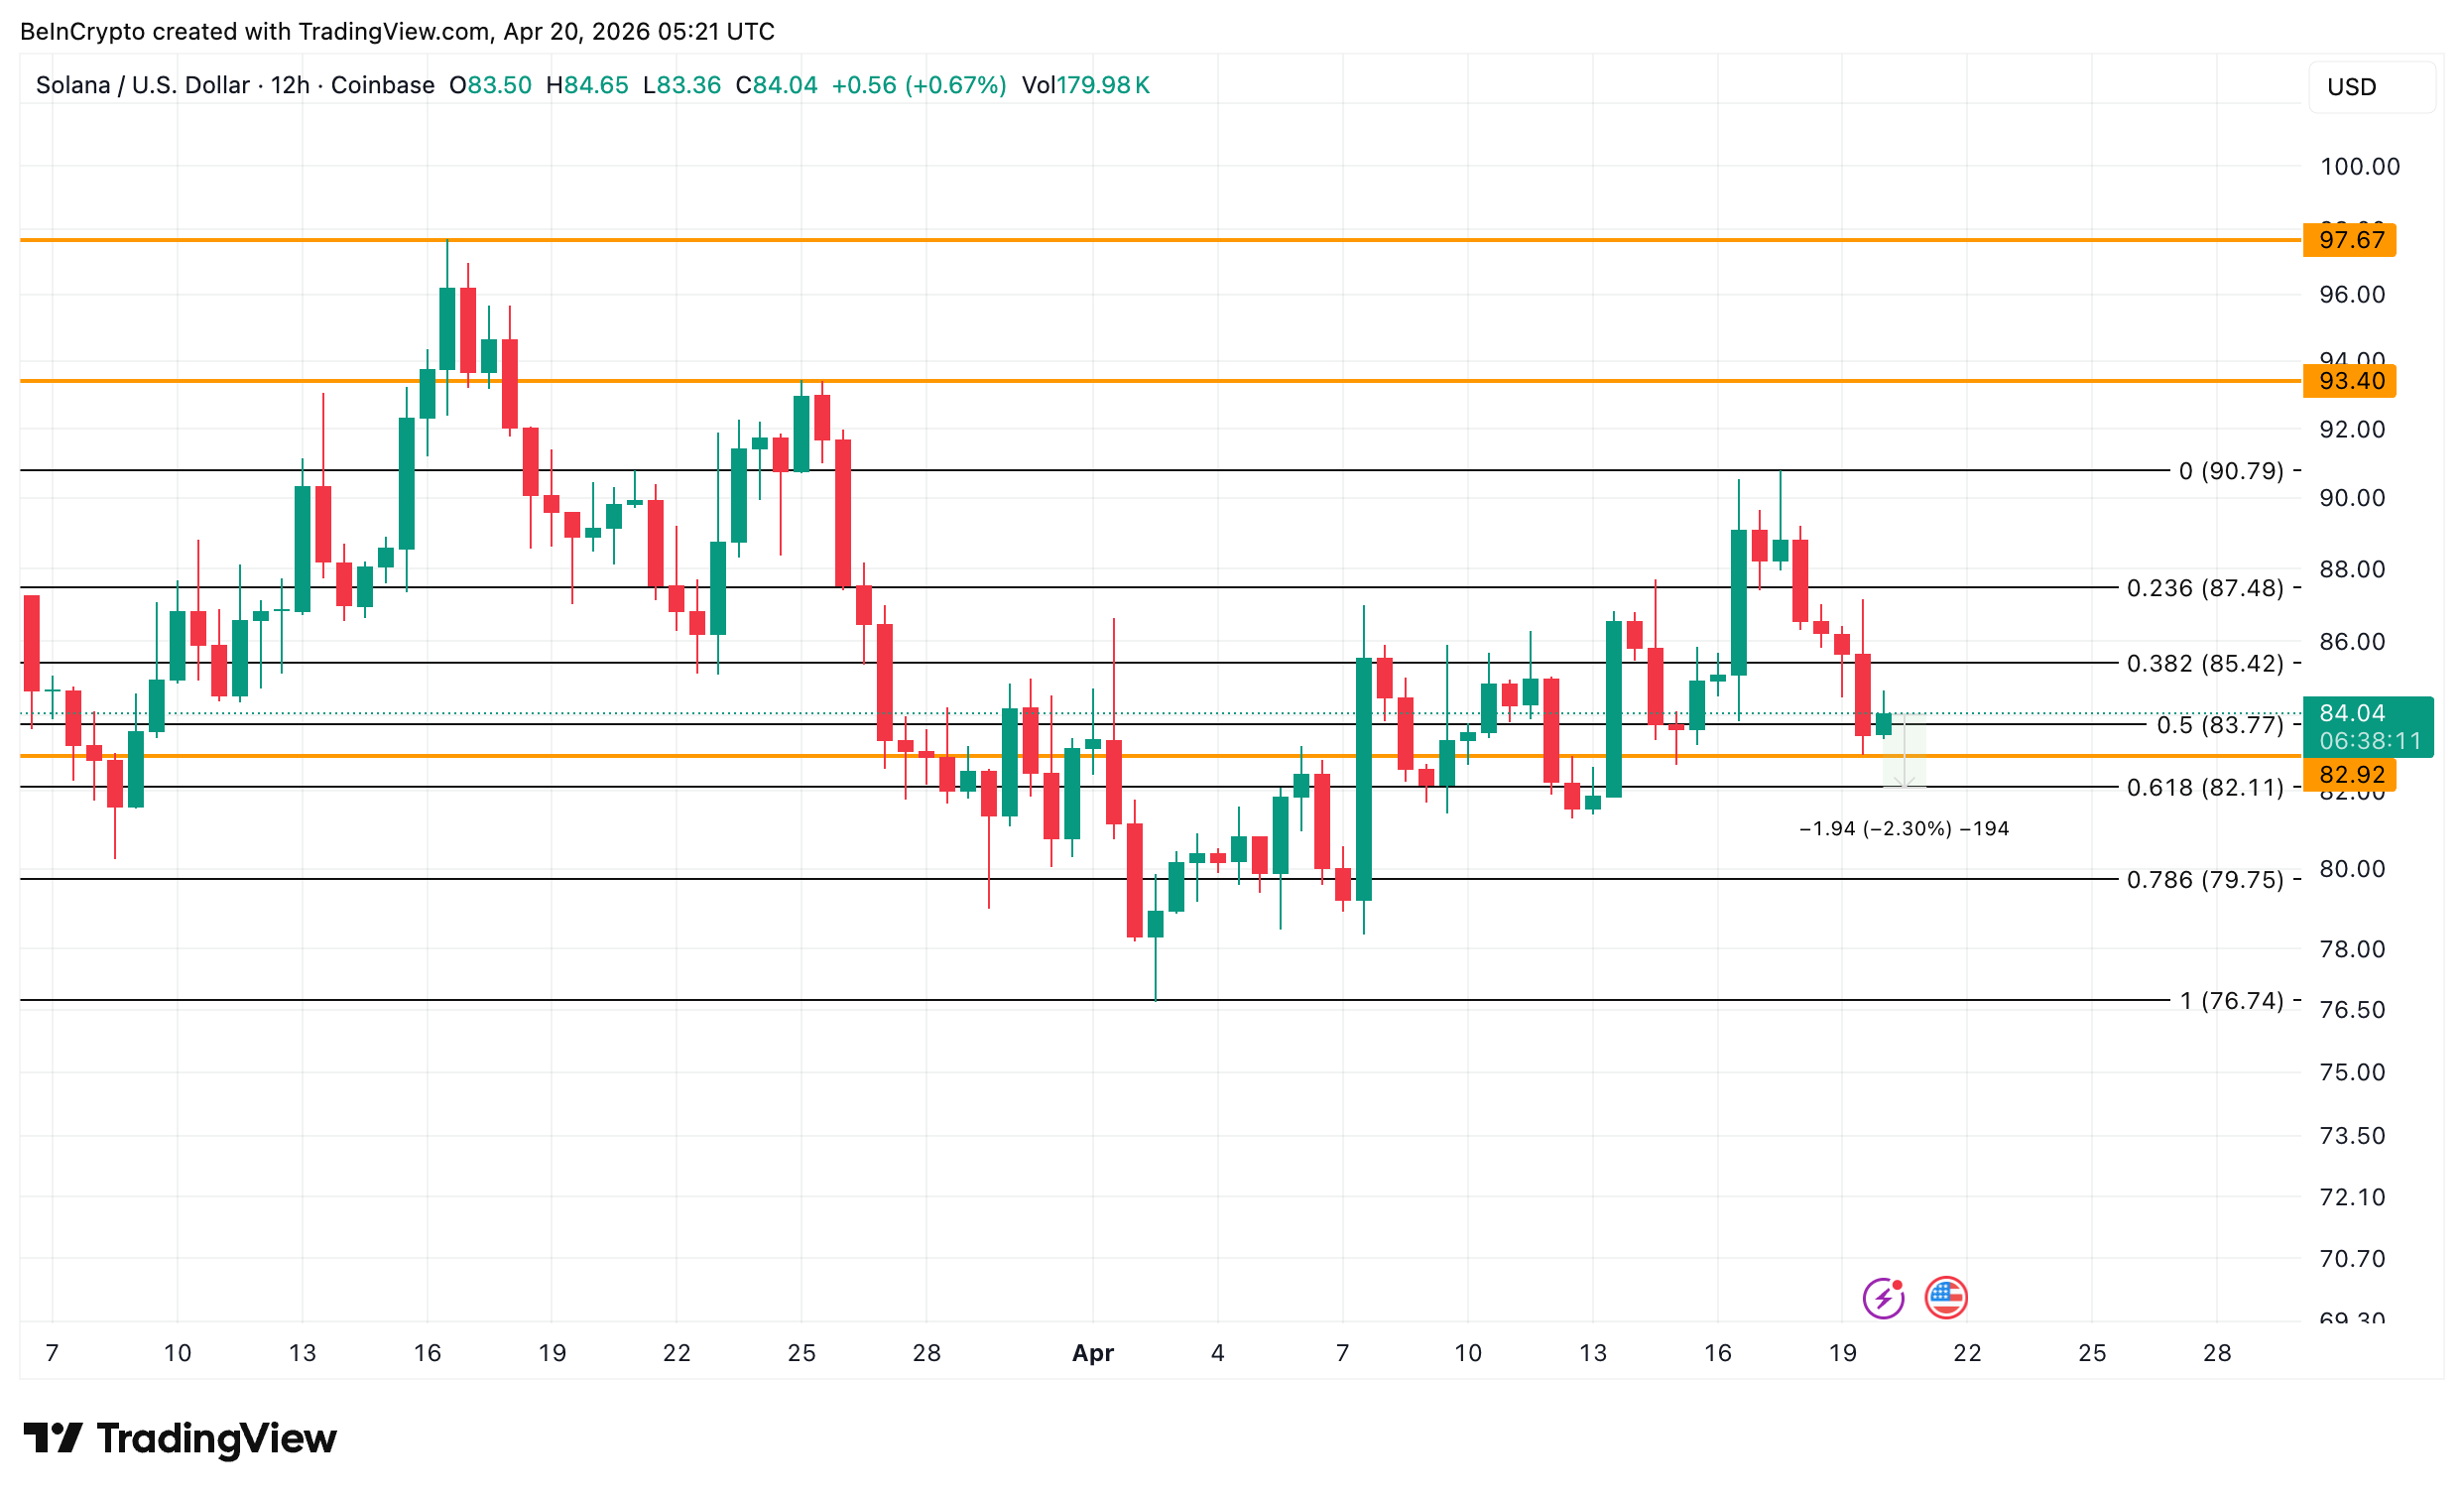
Solana price at $84.15 sits between two tight levels. The first upside test is $85.42. A clean move above that strengthens the rebound. However, the next resistance at $90.79 is the April 17 high, a level that already rejected once. A reclaim there would neutralize the current weakness and open a path toward $93.40.
Yet if forced sellers overwhelm the hodler bid, the rebound fails. A touch of $82.93 invalidates the hidden bullish divergence. A break of $82.11, the 0.618 Fibonacci, opens $79.95 and $76.74 as the next downside targets.
Solana price at $82.93 separates a rebound that holds long-term conviction from a breakdown driven by the DeFi crisis.
The post Solana Tries to Rebound but a DeFi Contagion Sends 1.32 Million SOL to Exchanges appeared first on BeInCrypto.