
SIREN surged 151% on Thursday to reach $2.25 before a sharp correction pulled the token back near $1.66. The rally broke a multi-week consolidation beneath the 20-day moving average.
Daily chart indicators remain firmly bullish, yet hourly signals flash a warning as momentum cools and sellers step in. Traders now watch the $1.37 Fibonacci level as the first test of demand.
Daily Chart Signals Sustained Bullish Momentum
The SIREN price prediction on a logarithmic daily chart shows the token has respected its 20-day moving average as dynamic support since late January. Four green arrows mark successful bounces before the trend broke on March 31.
A -67% daily red candle that day breached the moving average and triggered a sharp correction. Price eventually bottomed at the 0.786 Fibonacci retracement at $0.173, drawn from the January 21 low of $0.07 to the March 22 all-time high of $4.73.
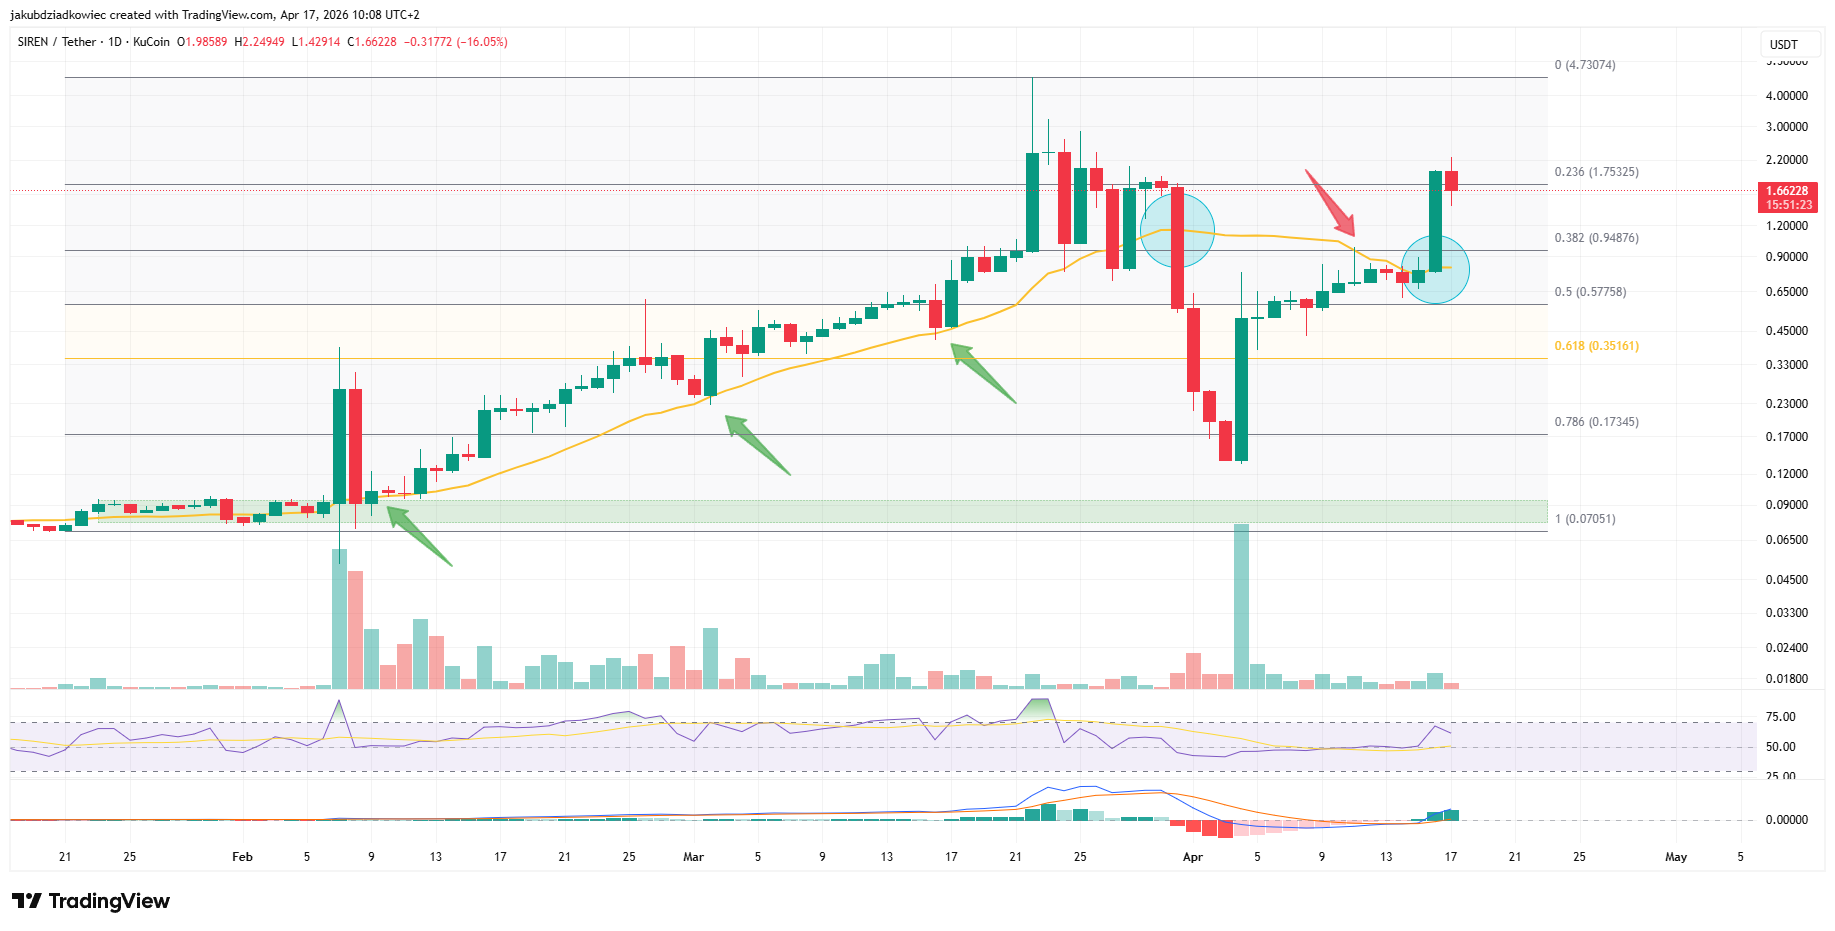
SIREN/USDT daily chart / Source: Tradingview
Following that bounce, SIREN retested the 20-day moving average as resistance (red arrow) and consolidated beneath it. Yesterday’s 151% daily candle broke that resistance with conviction and tagged the 0.236 Fibonacci level at $1.75.
The Relative Strength Index (RSI) reads 61, which sits in healthy bullish territory without reaching overbought conditions. The MACD histogram is printing consecutive taller green bars, indicating upside momentum is still building on the higher timeframe.
Hourly Chart Flashes Correction Warning
The short-term picture tells a different story. SIREN tapped $2.25 during the Thursday rally before sellers took control, and Friday’s session has already produced a pullback of roughly 16%.
The first downside target sits at the 0.382 Fibonacci retracement at $1.37. If that level fails, the next supports lie at the 0.618 Golden Pocket near $1.00 and the 0.786 level at $0.81.
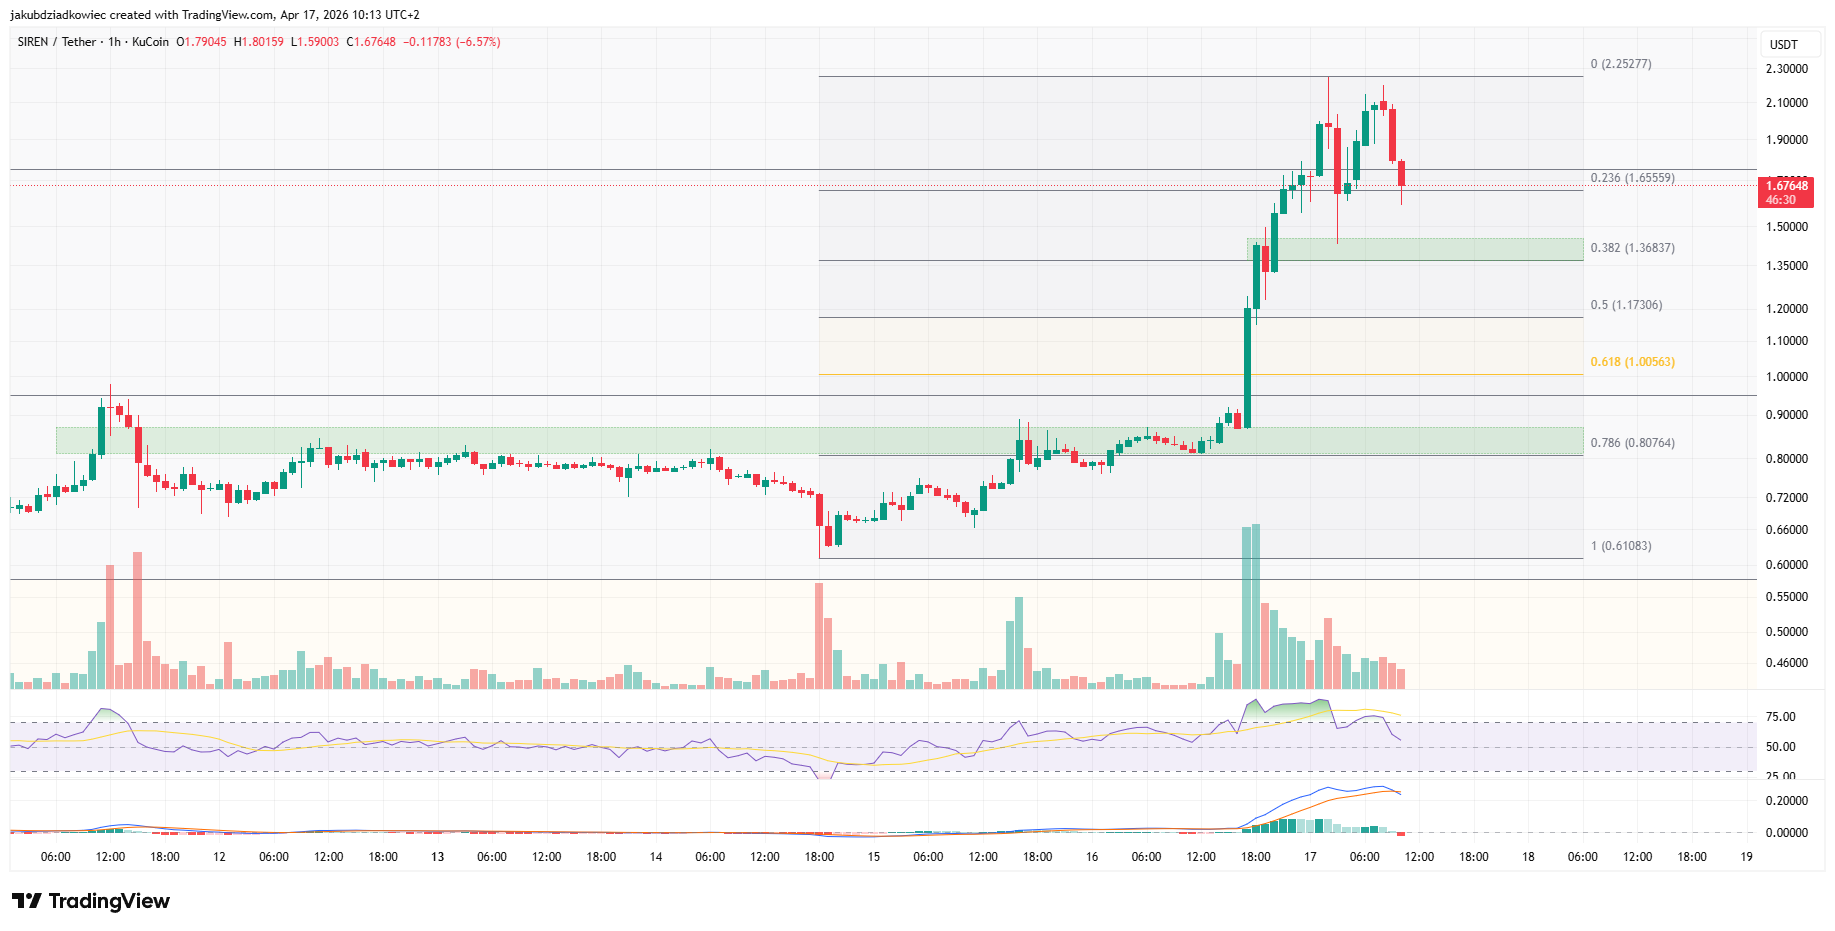
The $0.81 zone carries added weight because it previously capped price as resistance between April 11 and the breakout on April 17 before flipping into support. A reclaim of that area would place the recent breakout structure in jeopardy.
Momentum oscillators on the hourly confirm the caution. RSI is sliding back toward the neutral zone and MACD has produced a bearish crossover, signaling near-term cooling after the vertical surge.
SIREN Price Prediction Centers on $1.37 Defense
Price action analyst Finora_EN published an independent daily read on X pointing to a long bias. Their work flags $2.2380 as the first target, followed by $2.8920, with extensions toward $3.6556 and $4.8107 if the trend extends.
The suggested entry zone sits between $1.4258 and $1.4446, almost exactly overlapping with the 0.382 hourly Fibonacci retracement identified earlier. That convergence strengthens $1.37 to $1.45 as the critical decision band for buyers.
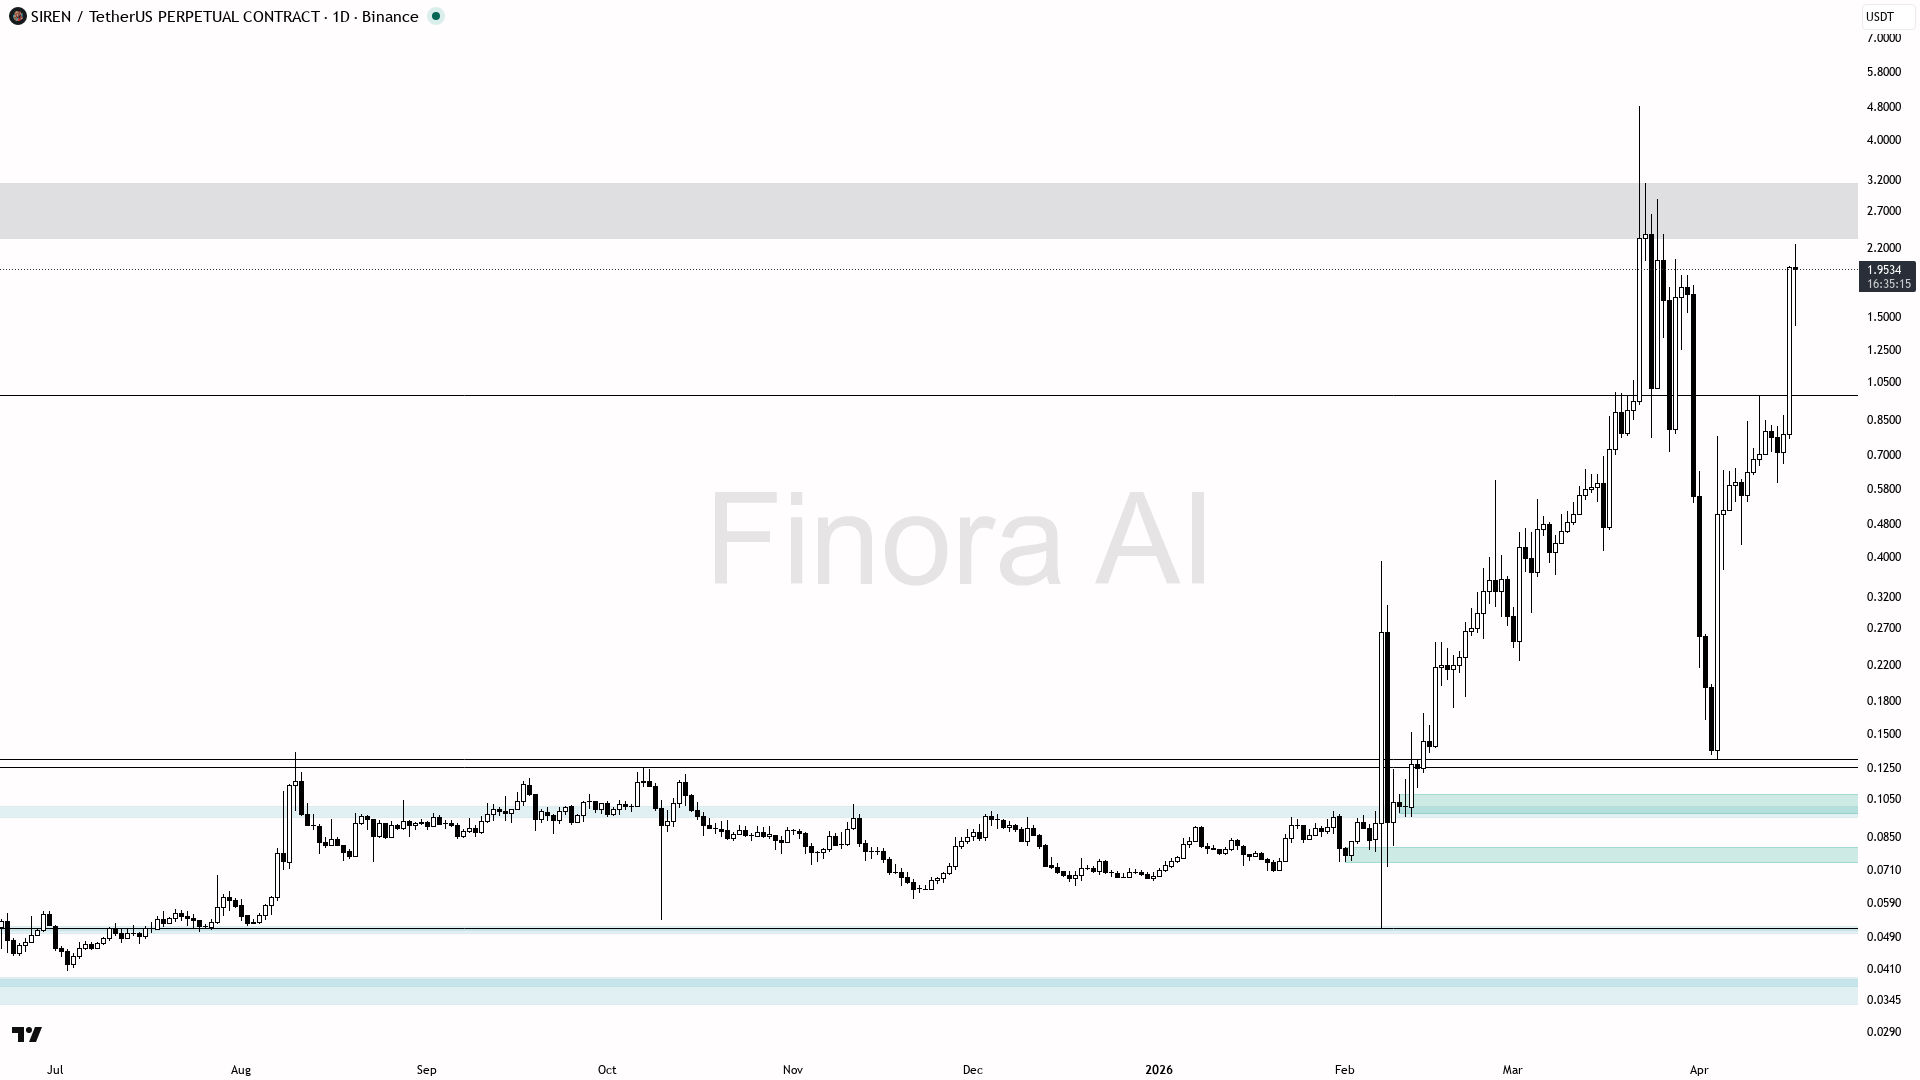
The analyst’s invalidation level of $1.1220 on a daily close aligns with the broader trend structure. A sustained move below that threshold would open downside toward $0.9754 and possibly $0.6001, wiping out most of the April recovery across the altcoin segment.
For now the binary setup is clear. Holding above the $1.37 Fib zone keeps the measured path toward $2.24 and the prior swing high at $2.87 in play, while losing it exposes SIREN to a full retest of the $0.81 breakout base.
The post SIREN Price Prints 151% Daily Candle, Targets $2.24 as Correction Tests $1.37 appeared first on BeInCrypto.