
Siren (SIREN) is trading at $1.04, down 55.90% on the day, after a parabolic 238% rally on March 22 sent the token to $3.60 — a whisker from its all-time high of $4.72 — before sellers crushed the advance.
The collapse did not arrive without warning. A bearish divergence on the CMF had been building for three days before the breakdown.
Investor Euphoria Drove SIREN’s Speculative Spike — Then Reversed Violently
Santiment’s weighted sentiment for SIREN peaked at approximately +7.41 on March 22–23, coinciding precisely with the price top. That reading was by far the highest in the visible chart period spanning back to late February.
Through most of March, sentiment had been oscillating in a modest range near zero. The sudden spike to +7.41 reflected retail investors piling into SIREN as the price surged — driven by short squeeze mechanics, Binance Futures listings, and a narrative of an imminent all-time high break.
That euphoria fed the price action directly. When sentiment spikes this sharply while price is at a local extreme, it signals that speculative momentum — not underlying demand — is the fuel. Retail buyers chasing the move absorbed selling from earlier holders, providing exit liquidity for those already positioned.
Want more token insights like this? Sign up for Editor Harsh Notariya’s Daily Crypto Newsletter here.
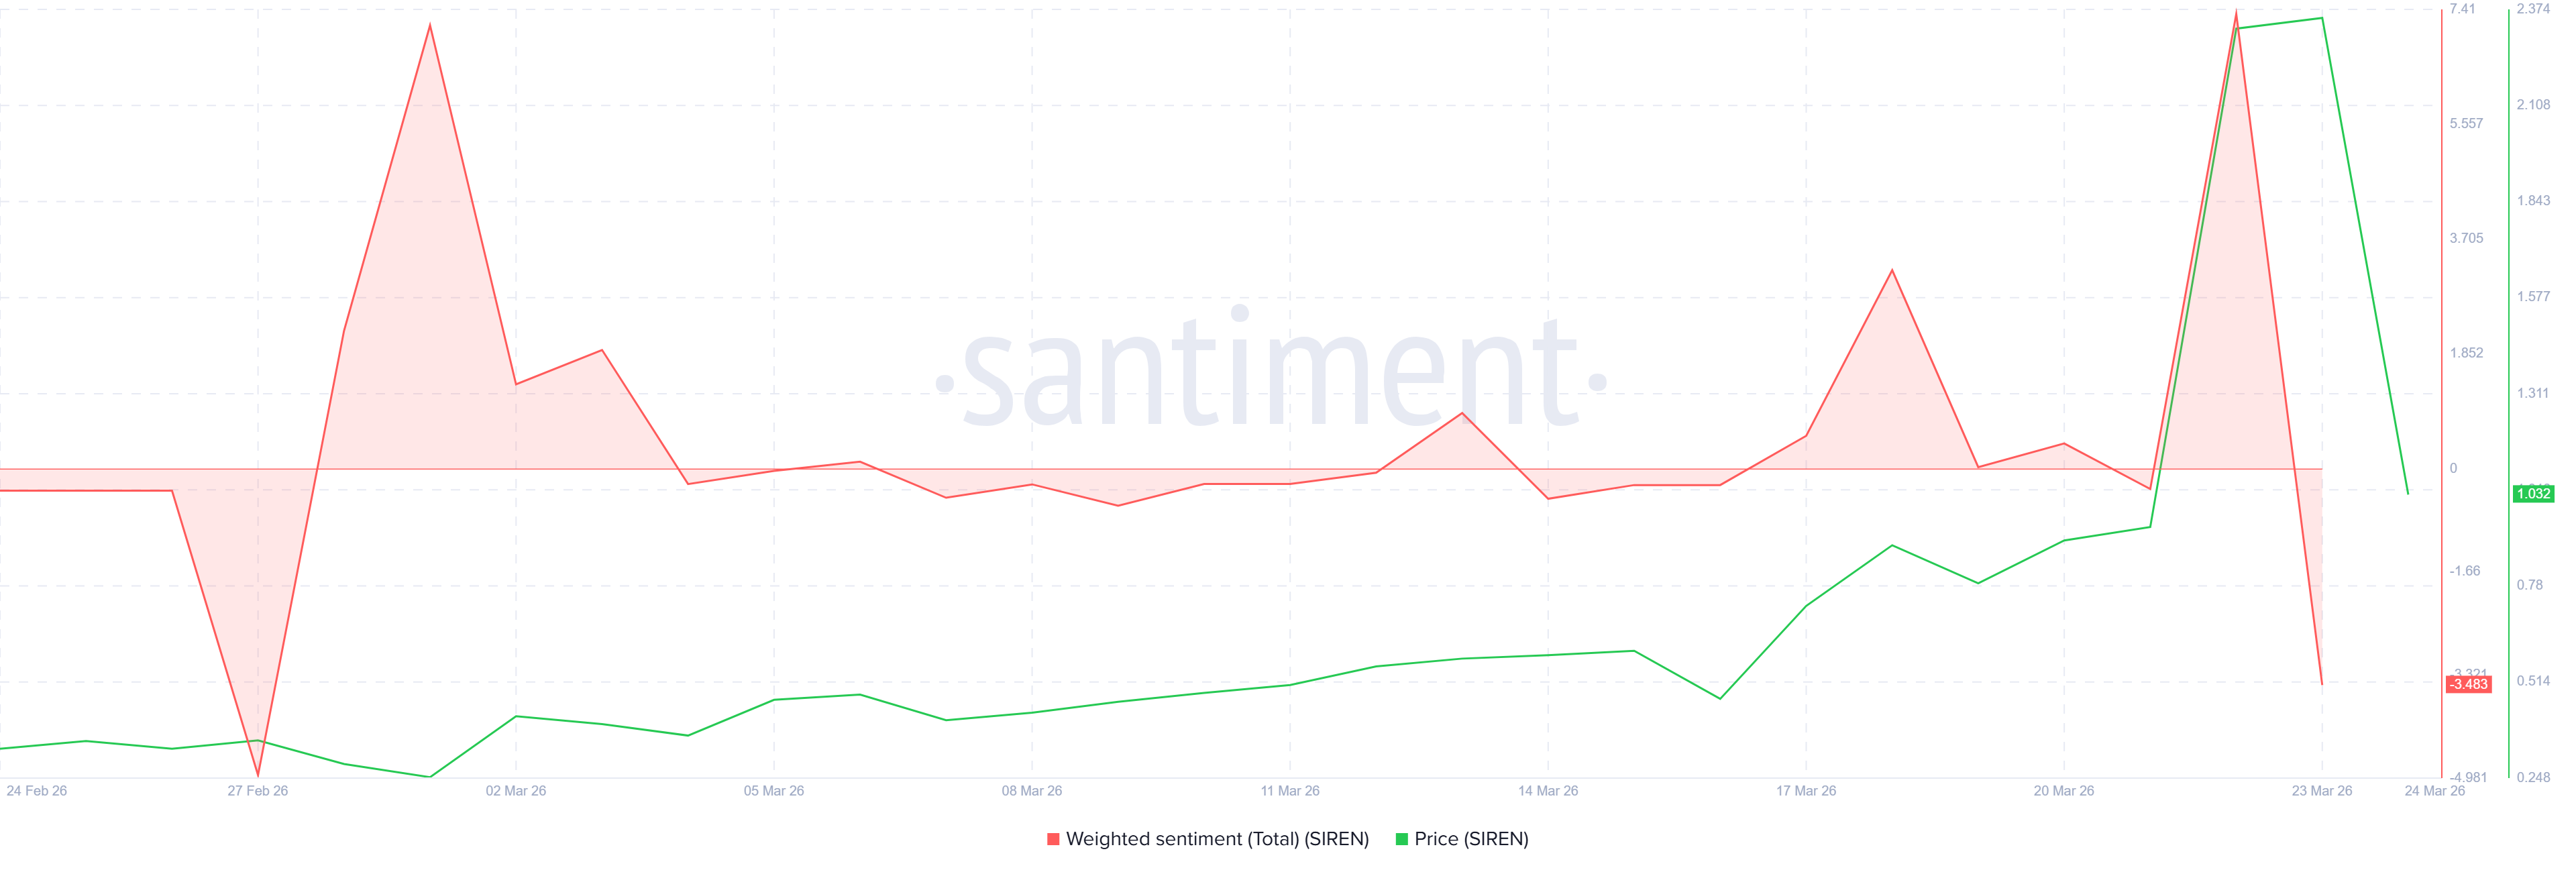
The sentiment reading has since collapsed to -3.483 on March 24 — the most negative reading in the chart’s visible history. The swing from peak euphoria to sharp pessimism in 48 hours confirms the speculative nature of the move. Participants who bought into the narrative at $2.50–$3.60 are now deep underwater.
Outflows Show SIREN’s Crash Was Long Overdue
The Chaikin Money Flow (CMF) on the 4-hour chart had been signaling distribution from the moment the rally began accelerating. On March 20–21, as prices climbed from approximately $1.00 toward $2.50, CMF peaked near +0.32 — confirming genuine buying pressure at the start of the move.
From that point, however, CMF began making lower highs even as the SIREN price continued higher. When the price was pushed to $3.50 on March 23, the CMF had already declined to approximately +0.10. A descending trendline drawn on the CMF connects these lower peaks clearly, forming a bearish divergence against the ascending price trendline running below. Volume-weighted buying pressure was fading at every successive price high.
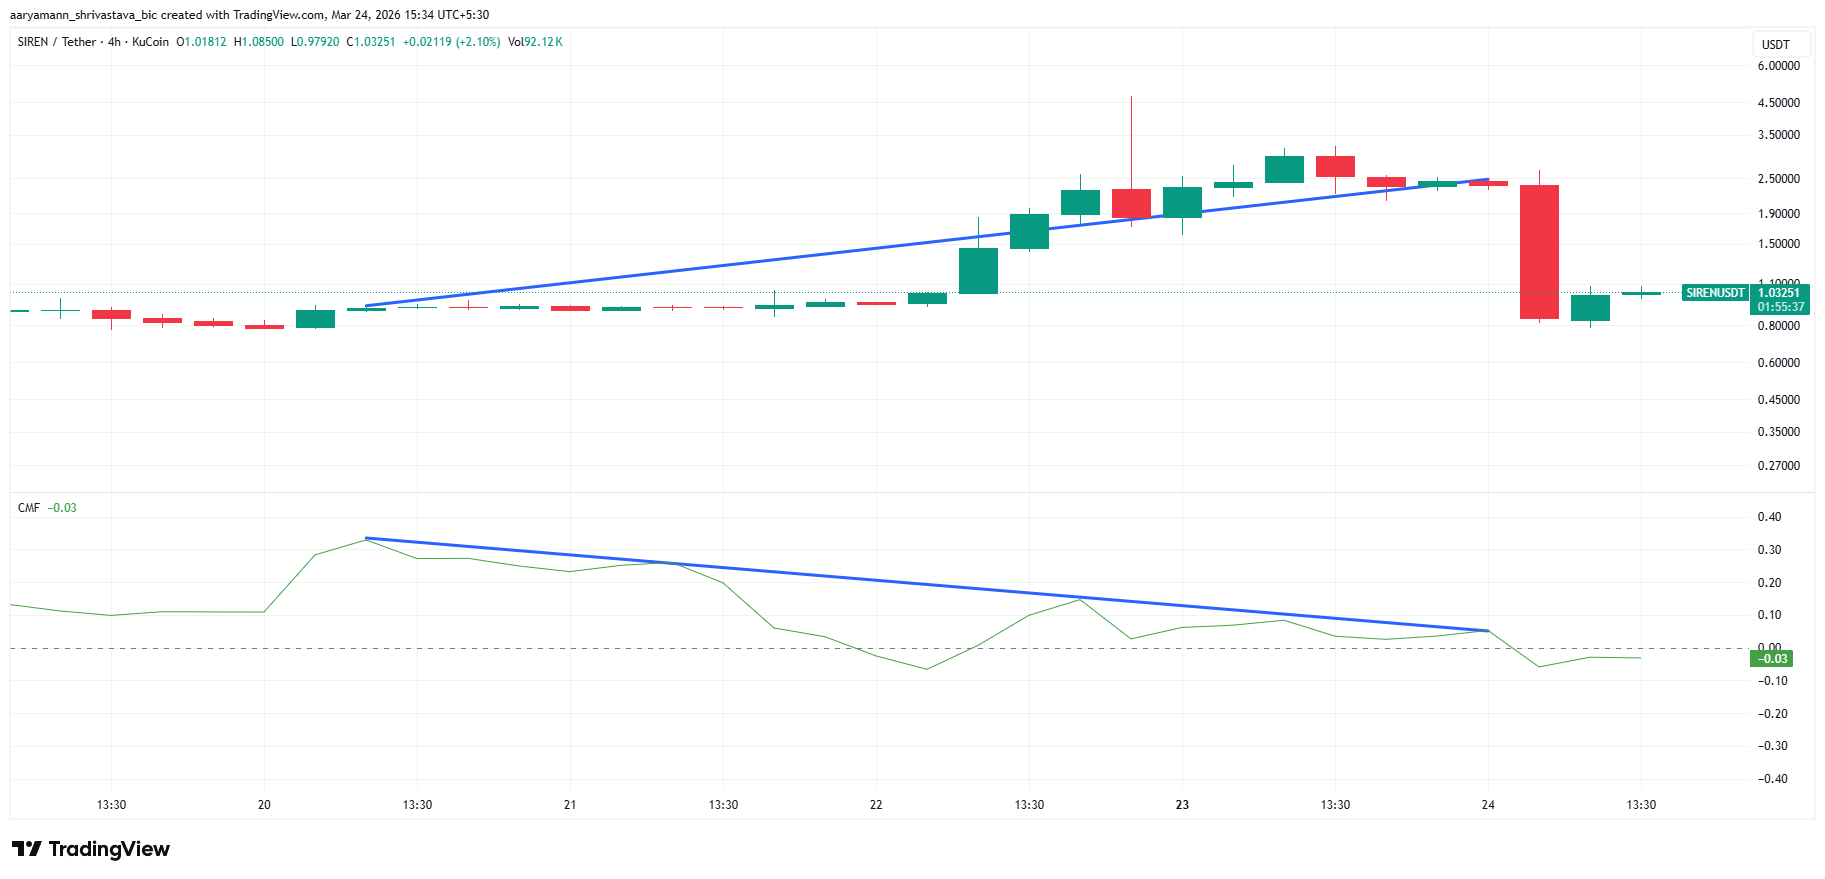
The CMF is now negative at -0.03. The divergence has fully resolved to the downside. Every session where price made a new high while CMF made a lower high was a session where sellers were systematically using the rally to exit. The token missed forming a new all-time high by approximately 24% — that gap matters because it means the $4.72 level was never tested and still represents unfinished business for bulls if a recovery materializes.
SIREN Price May Have a Shot At ATH
The daily chart shows SIREN has collapsed from its March 22 high of approximately $3.60, missing the $4.72 all-time high by a significant margin. The 67.10% measured move annotated on the chart projects a decline target of approximately $0.79, just below the $0.94183 support level now in focus.
That $0.94 level is the immediate floor. A daily close above it keeps the door open for a second attempt at the all-time high. The path from $0.94 back toward $4.72 would require reclaiming $2.00 first — the major horizontal resistance visible on the chart — before the all-time high zone becomes accessible. The annotated 48.13% measured move from $3.20 to $4.72 would only activate if the price can rebuild the base above $2.00 with sustained volume.
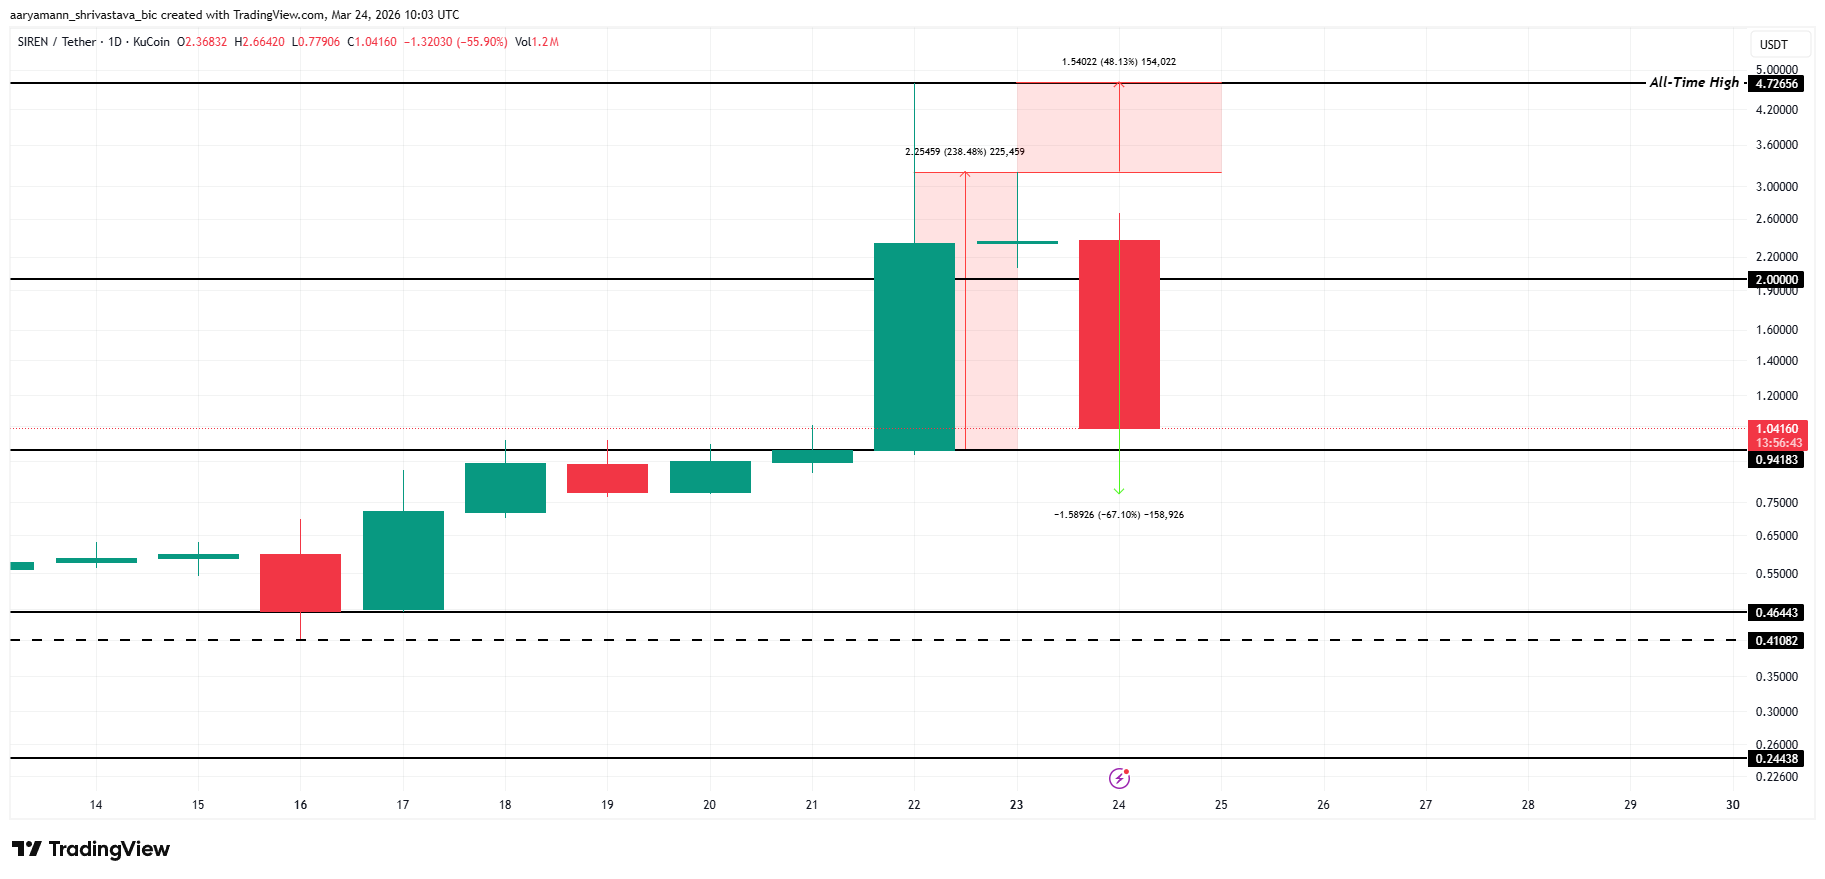
SIREN price’s close below $0.94 would expose $0.46, then $0.41, and potentially $0.24 — each level representing progressively deeper support from earlier in the rally cycle. This is only likely if the outflows continue to mount.
The post SIREN Crashed 56% in a Day: Here’s How the Charts Saw It Coming appeared first on BeInCrypto.