Crude oil prices are trading near $92 at press time. Still well above pre-conflict levels but down 31% from the $119 cycle high hit on March 8. This analysis tracks Brent crude futures because they more accurately reflect the international oil price during Middle East-centered geopolitical events.
The war-driven rally pushed oil to its highest levels since 2022, but four signals now suggest the upside may be exhausting. Plus, Iran has recently released a set of requirements for a ceasefire, which could dent the war premium further.
Record Reserve Release and Rising Iran Exports Challenge the Supply Panic
The International Energy Agency (IEA) approved a 400 million-barrel emergency release of oil reserves this week, the largest in its history, to stabilize prices.
Japan, which holds roughly 440 million barrels in stockpiles covering 204 days of imports, may also tap its reserves independently.
Meanwhile, Iran’s oil exports have actually risen by 100,000 barrels per day since the war began, reaching 2.1 million barrels per day. China continues absorbing large volumes.
Strait of Hormuz traffic is slowly resuming, with 13.7 million barrels passing through since late February, though most commercial shipping remains blocked due to ongoing missile and drone threats. However, despite these ongoing supply threats, the price action itself is telling a different story.
On the 8-hour chart, the Relative Strength Index, or RSI, a momentum indicator, is flashing a bearish divergence. Oil prices made a higher high between March 3 and March 10, but the RSI printed a lower high.
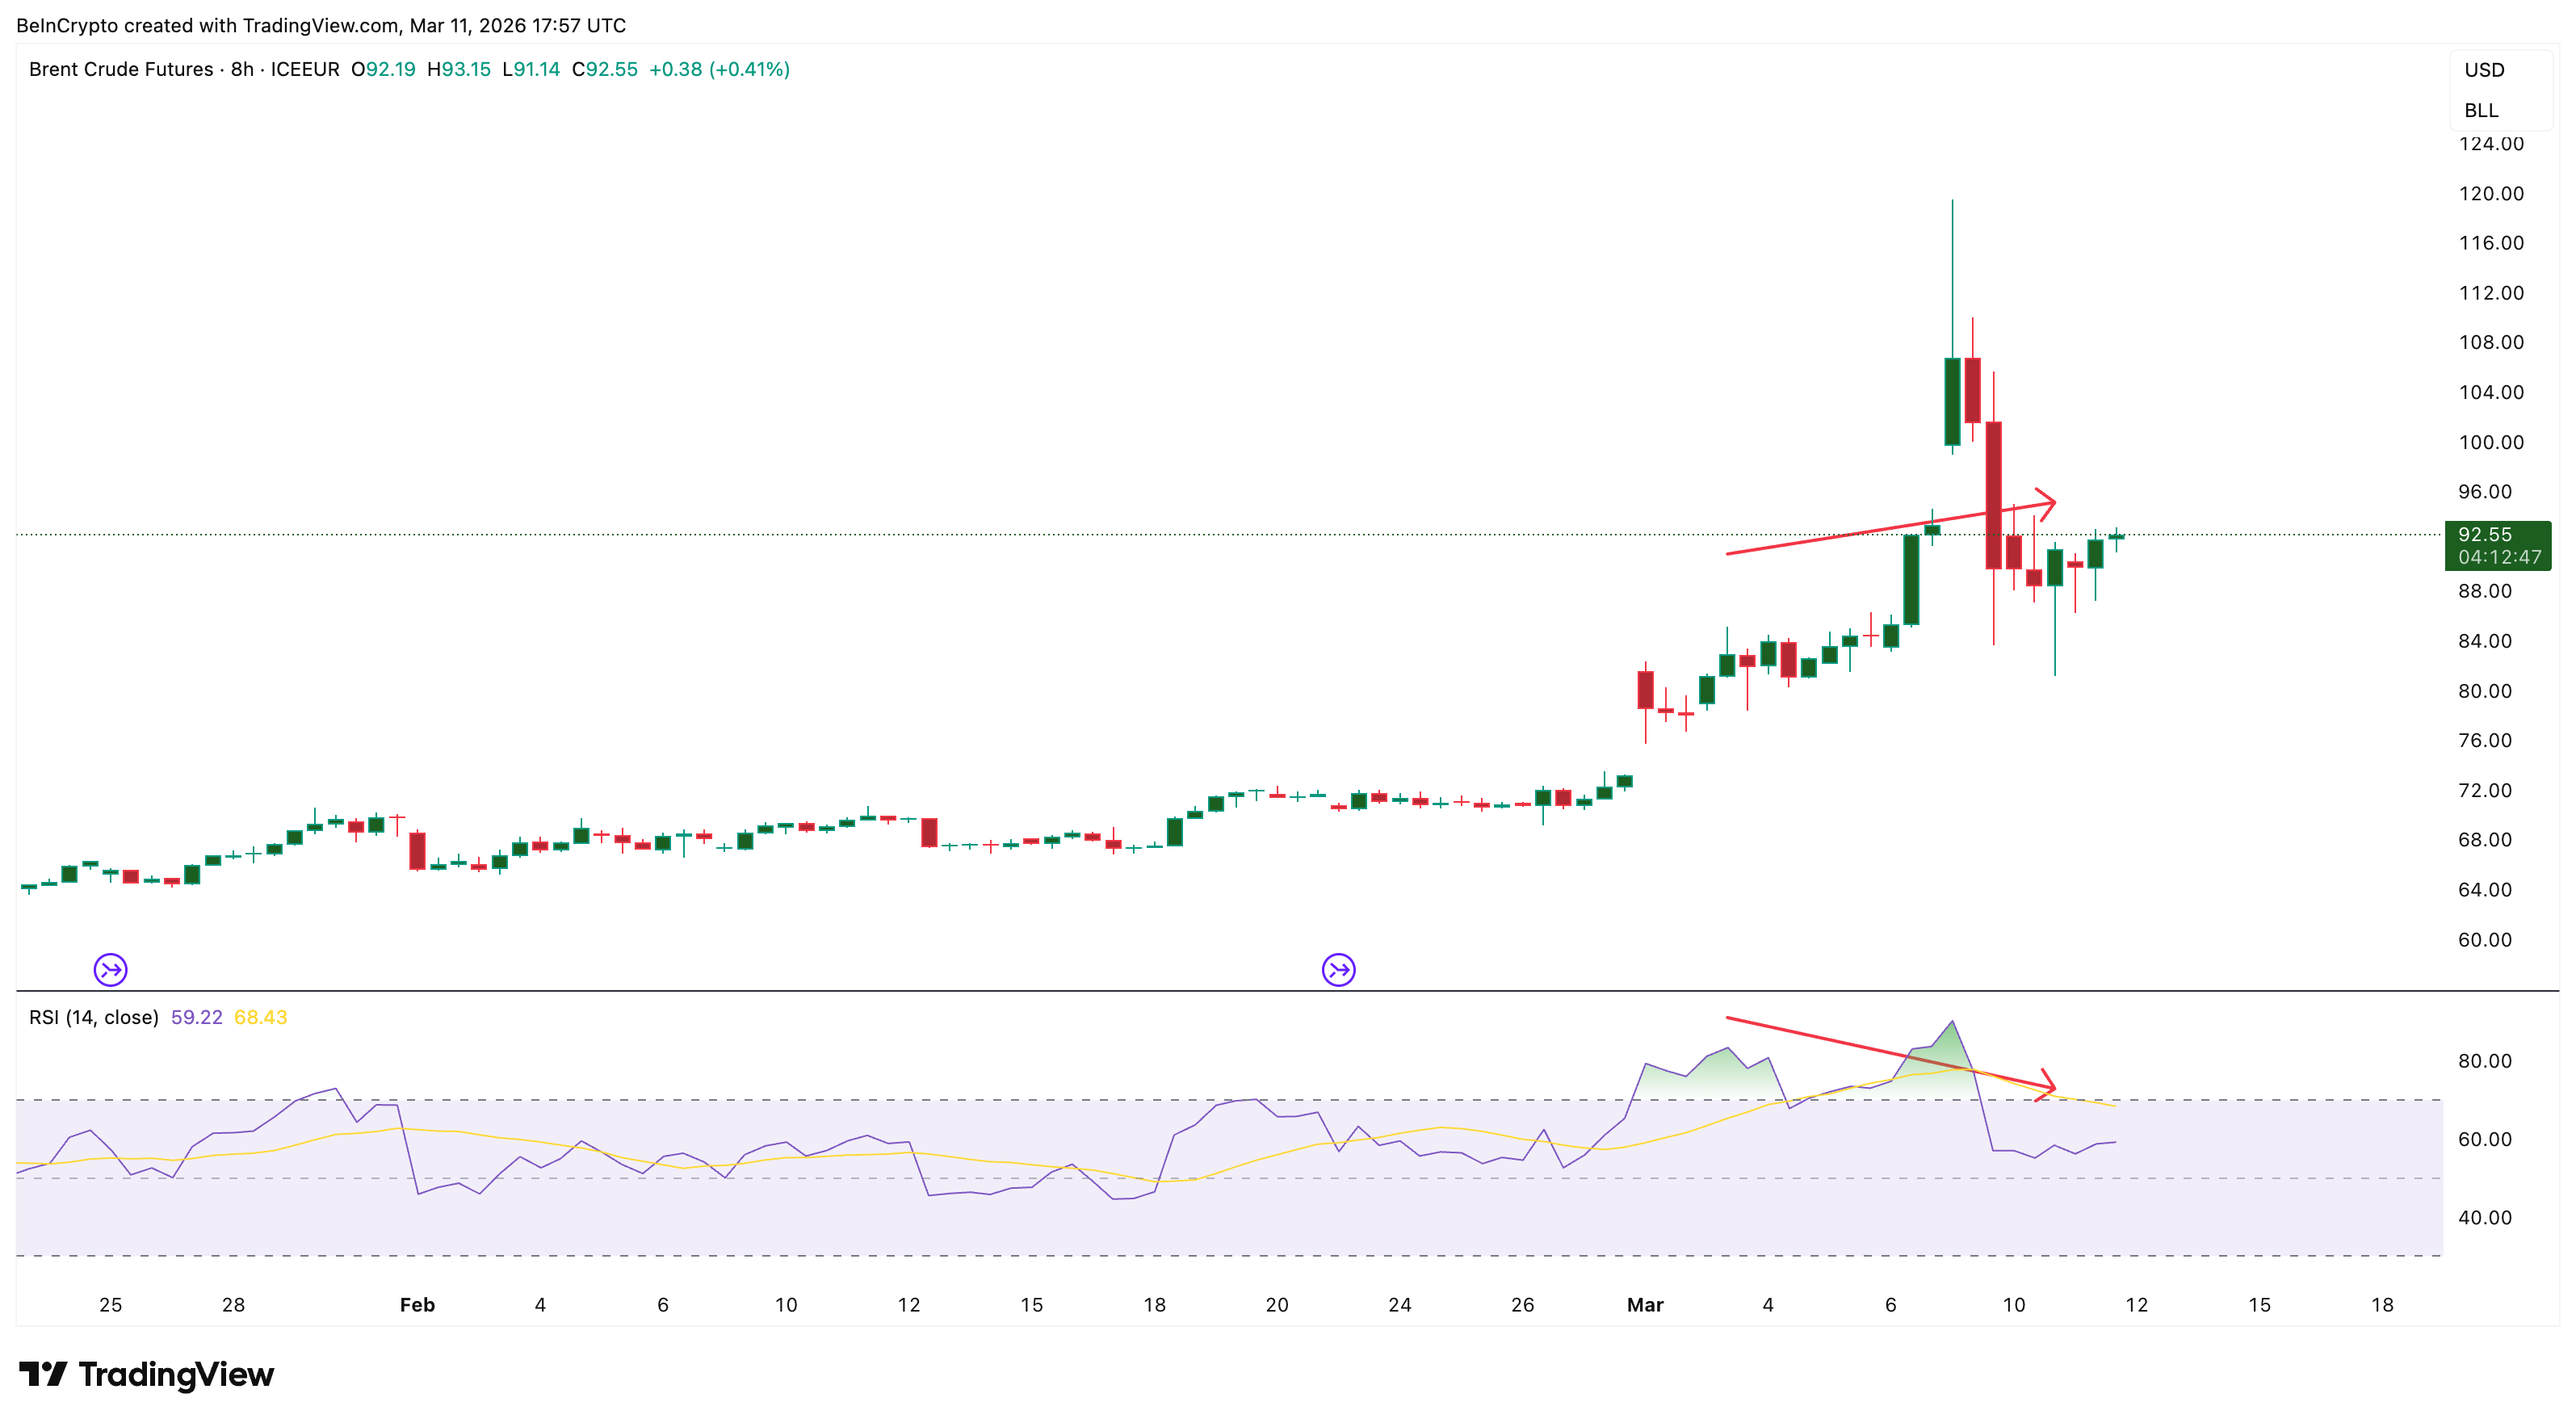
When prices rise, but momentum weakens, it typically signals an approaching reversal. This divergence also appears within a larger bearish structure forming on the chart, discussed in the final section.
Urgency for Oil Delivery is Easing
That weakening momentum is confirmed by the futures curve, which measures how delivery months are priced relative to one another.
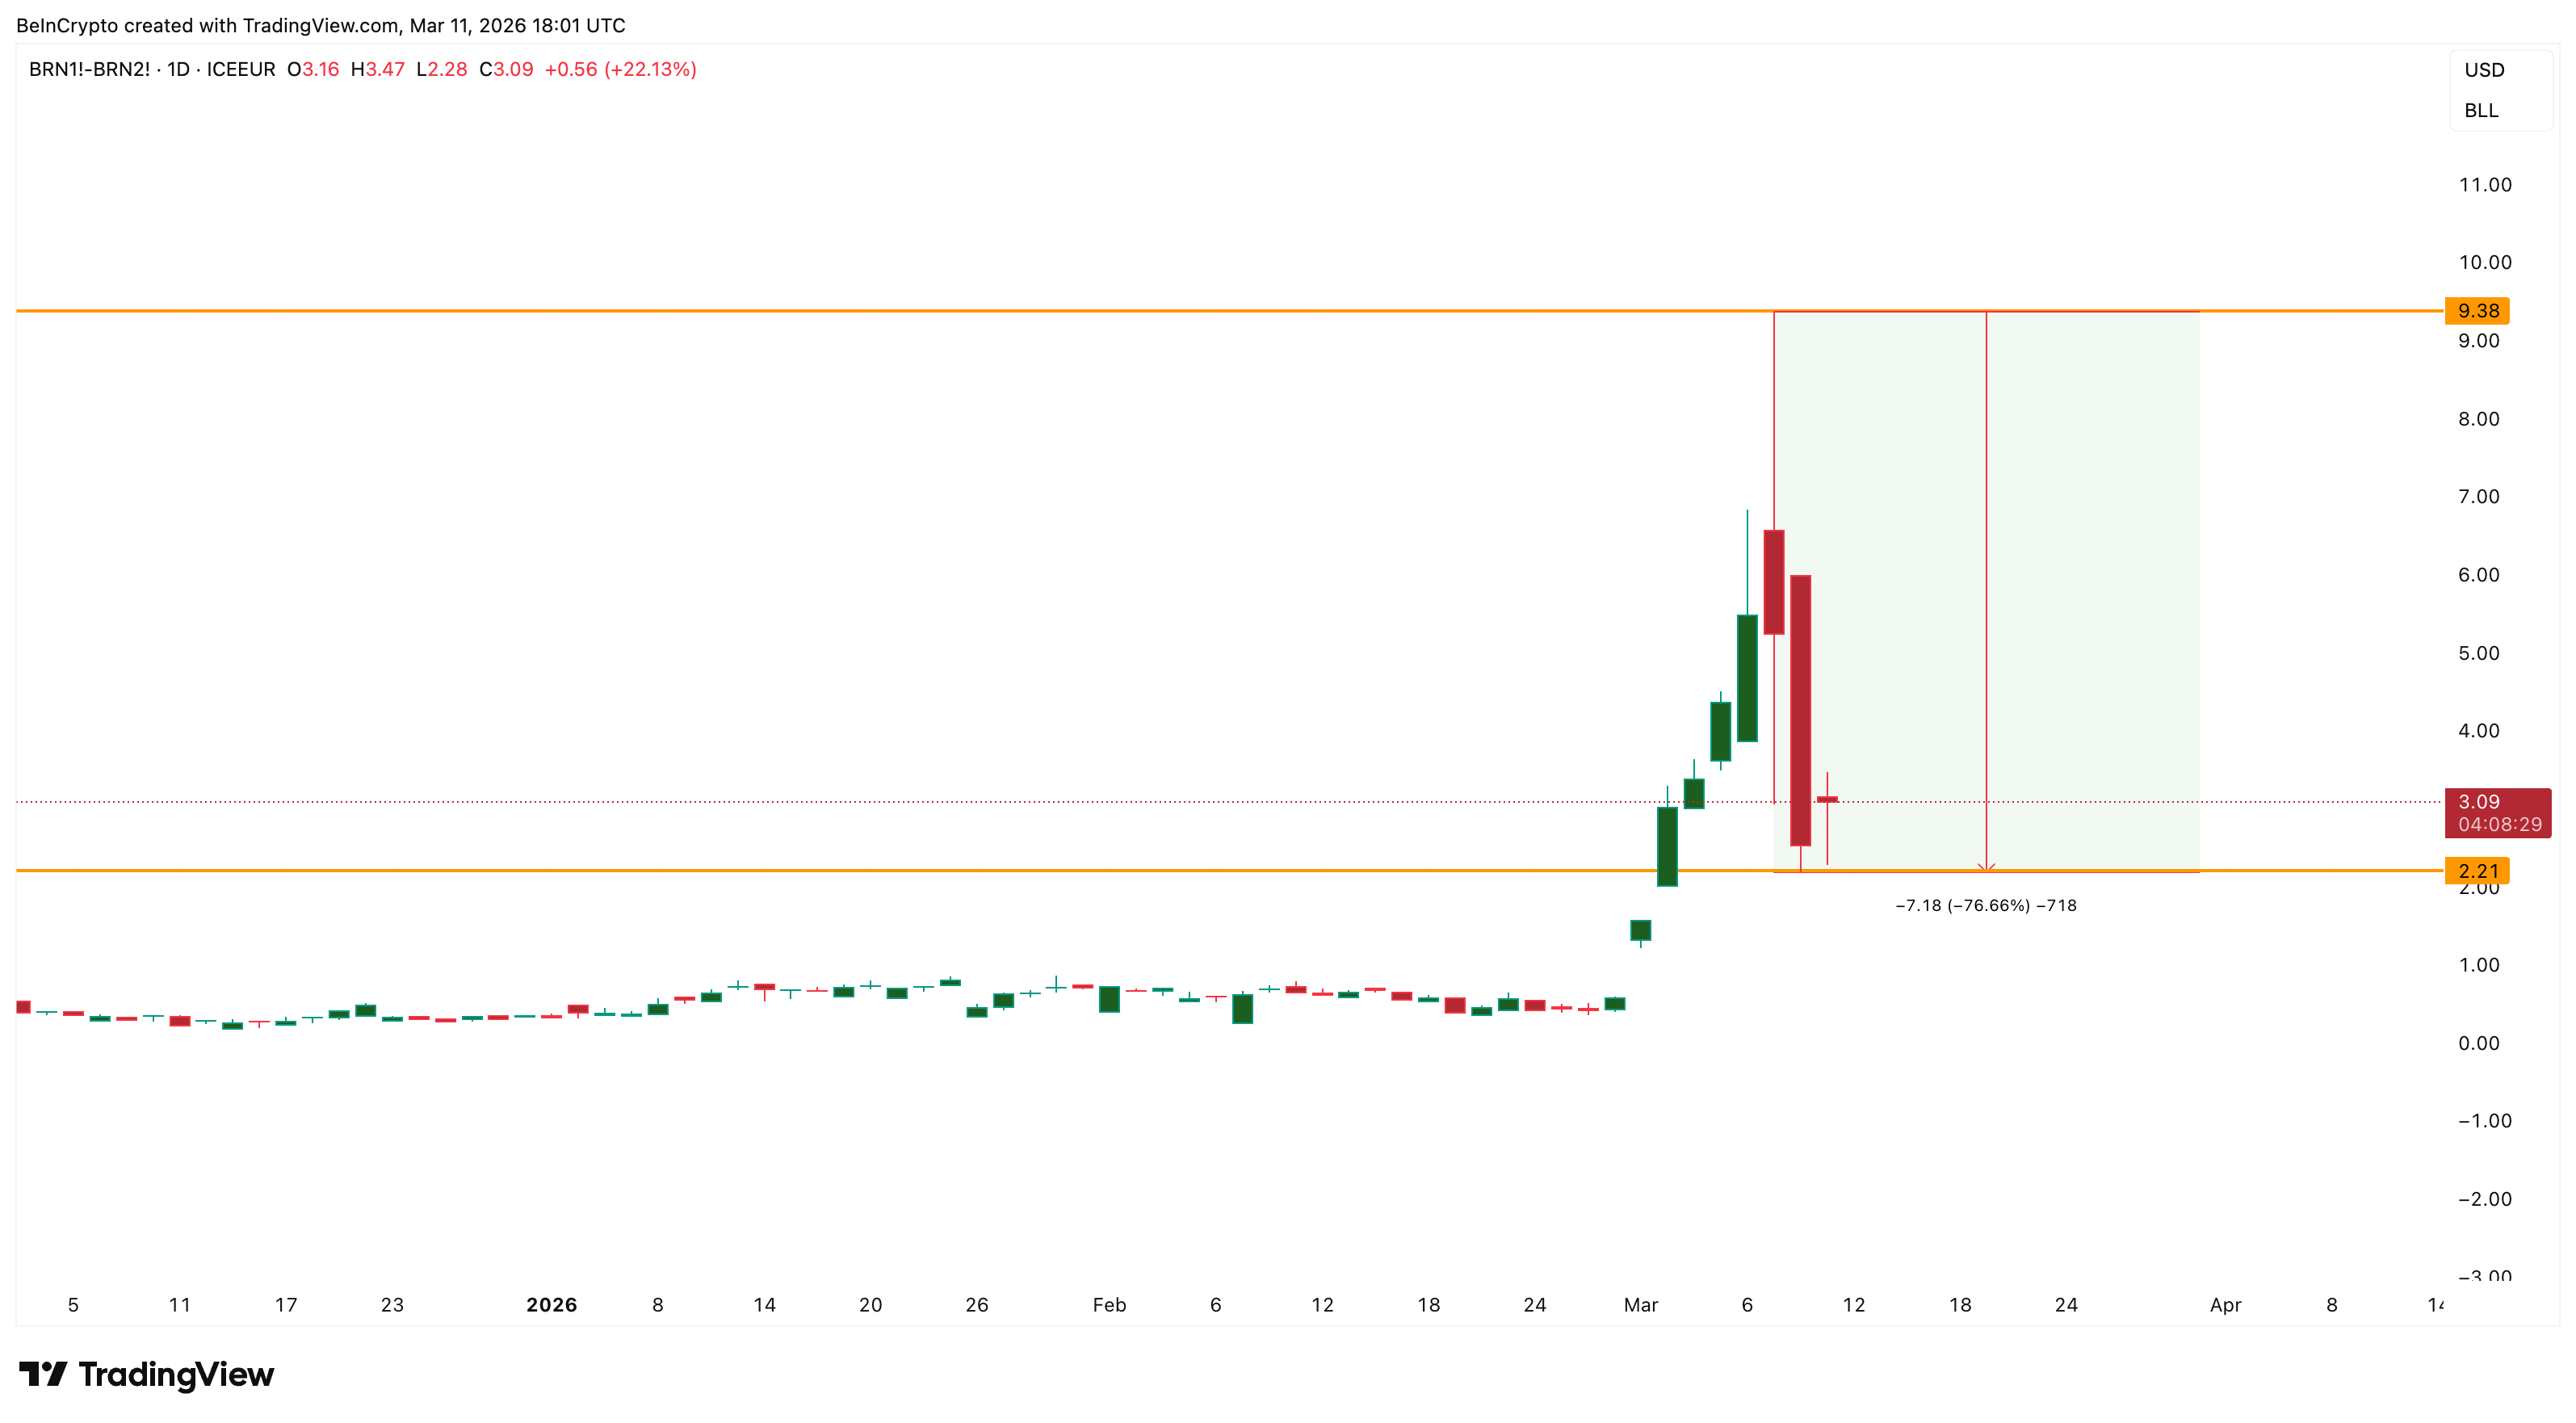
The gap between the front-month and second-month Brent contracts (BRN1! minus BRN2!) peaked at $9.38 around March 8. When this spread is positive, it means buyers are paying a premium for immediate oil delivery over next month’s delivery, a condition called backwardation that reflects supply panic.
Since that peak, the spread has collapsed roughly 76% to around $3.09. Some urgency remains, but the rapid decline shows the scramble for immediate barrels is easing fast.
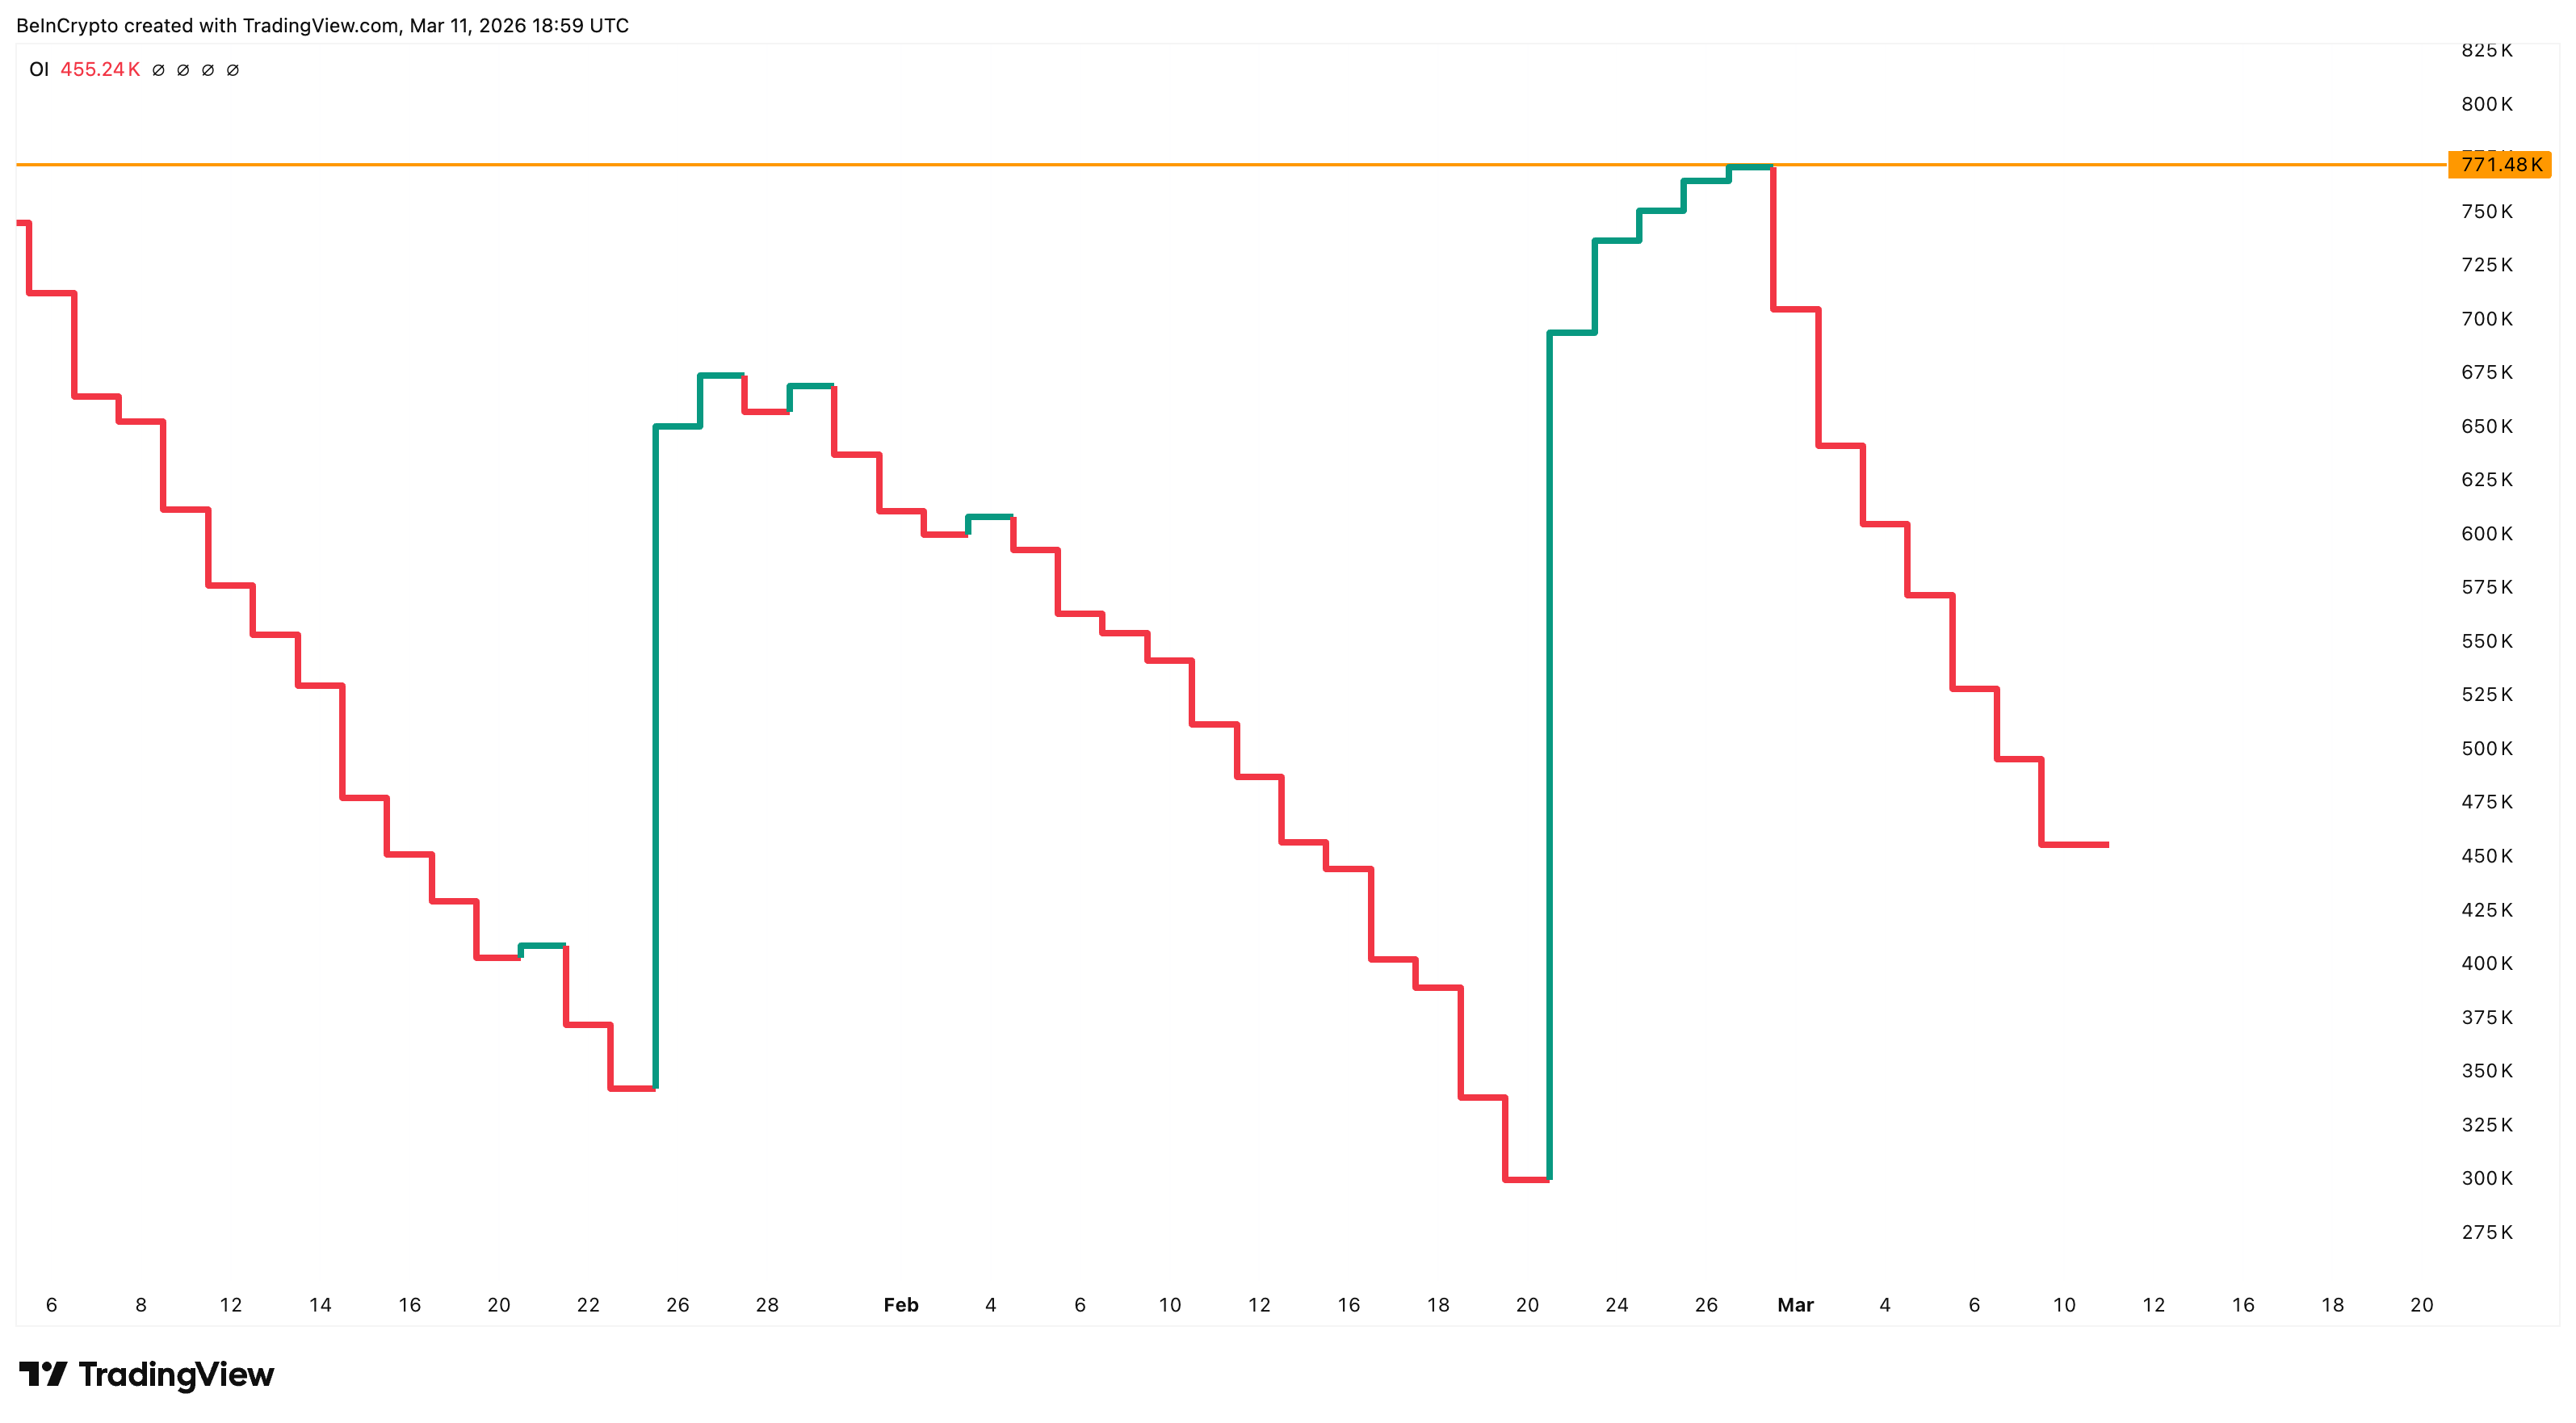
Supporting this, the total number of active Brent futures contracts has dropped to around 455,000 from over 771,000 at press time.
Rising prices while market participation shrinks usually mean the rally is fueled by traders closing old bearish bets rather than new buyers entering, a pattern that tends to run out of steam quickly.
Yet the options market tells a more cautious story. The premium traders pay for bullish oil bets over bearish ones has hit a four-year high, surpassing levels seen during the 2022 Russia-Ukraine crisis.
This gap between fading futures conviction and elevated options hedging suggests some participants are still bracing for a worst-case Hormuz shutdown, even as the broader market cools.
Dollar’s Bullish Channel Supports Oil Prices for Now but Carries Reversal Risk
The weakening futures conviction connects directly to the macro picture, where the US dollar is adding another layer of complexity.
The US Dollar Index (DXY), which tracks the dollar’s strength against a basket of major currencies. It is trading near 99.23 inside a rising channel. The $99.68 resistance has been tested and rejected twice, on March 3 and March 8.
Normally, a stronger dollar hurts oil because crude is priced in dollars globally, making it costlier for other countries to buy. But during supply crises like the current conflict, this flips.
Rising oil prices force every importing nation to buy more dollars to pay for crude, pushing the currency higher alongside oil rather than against it.
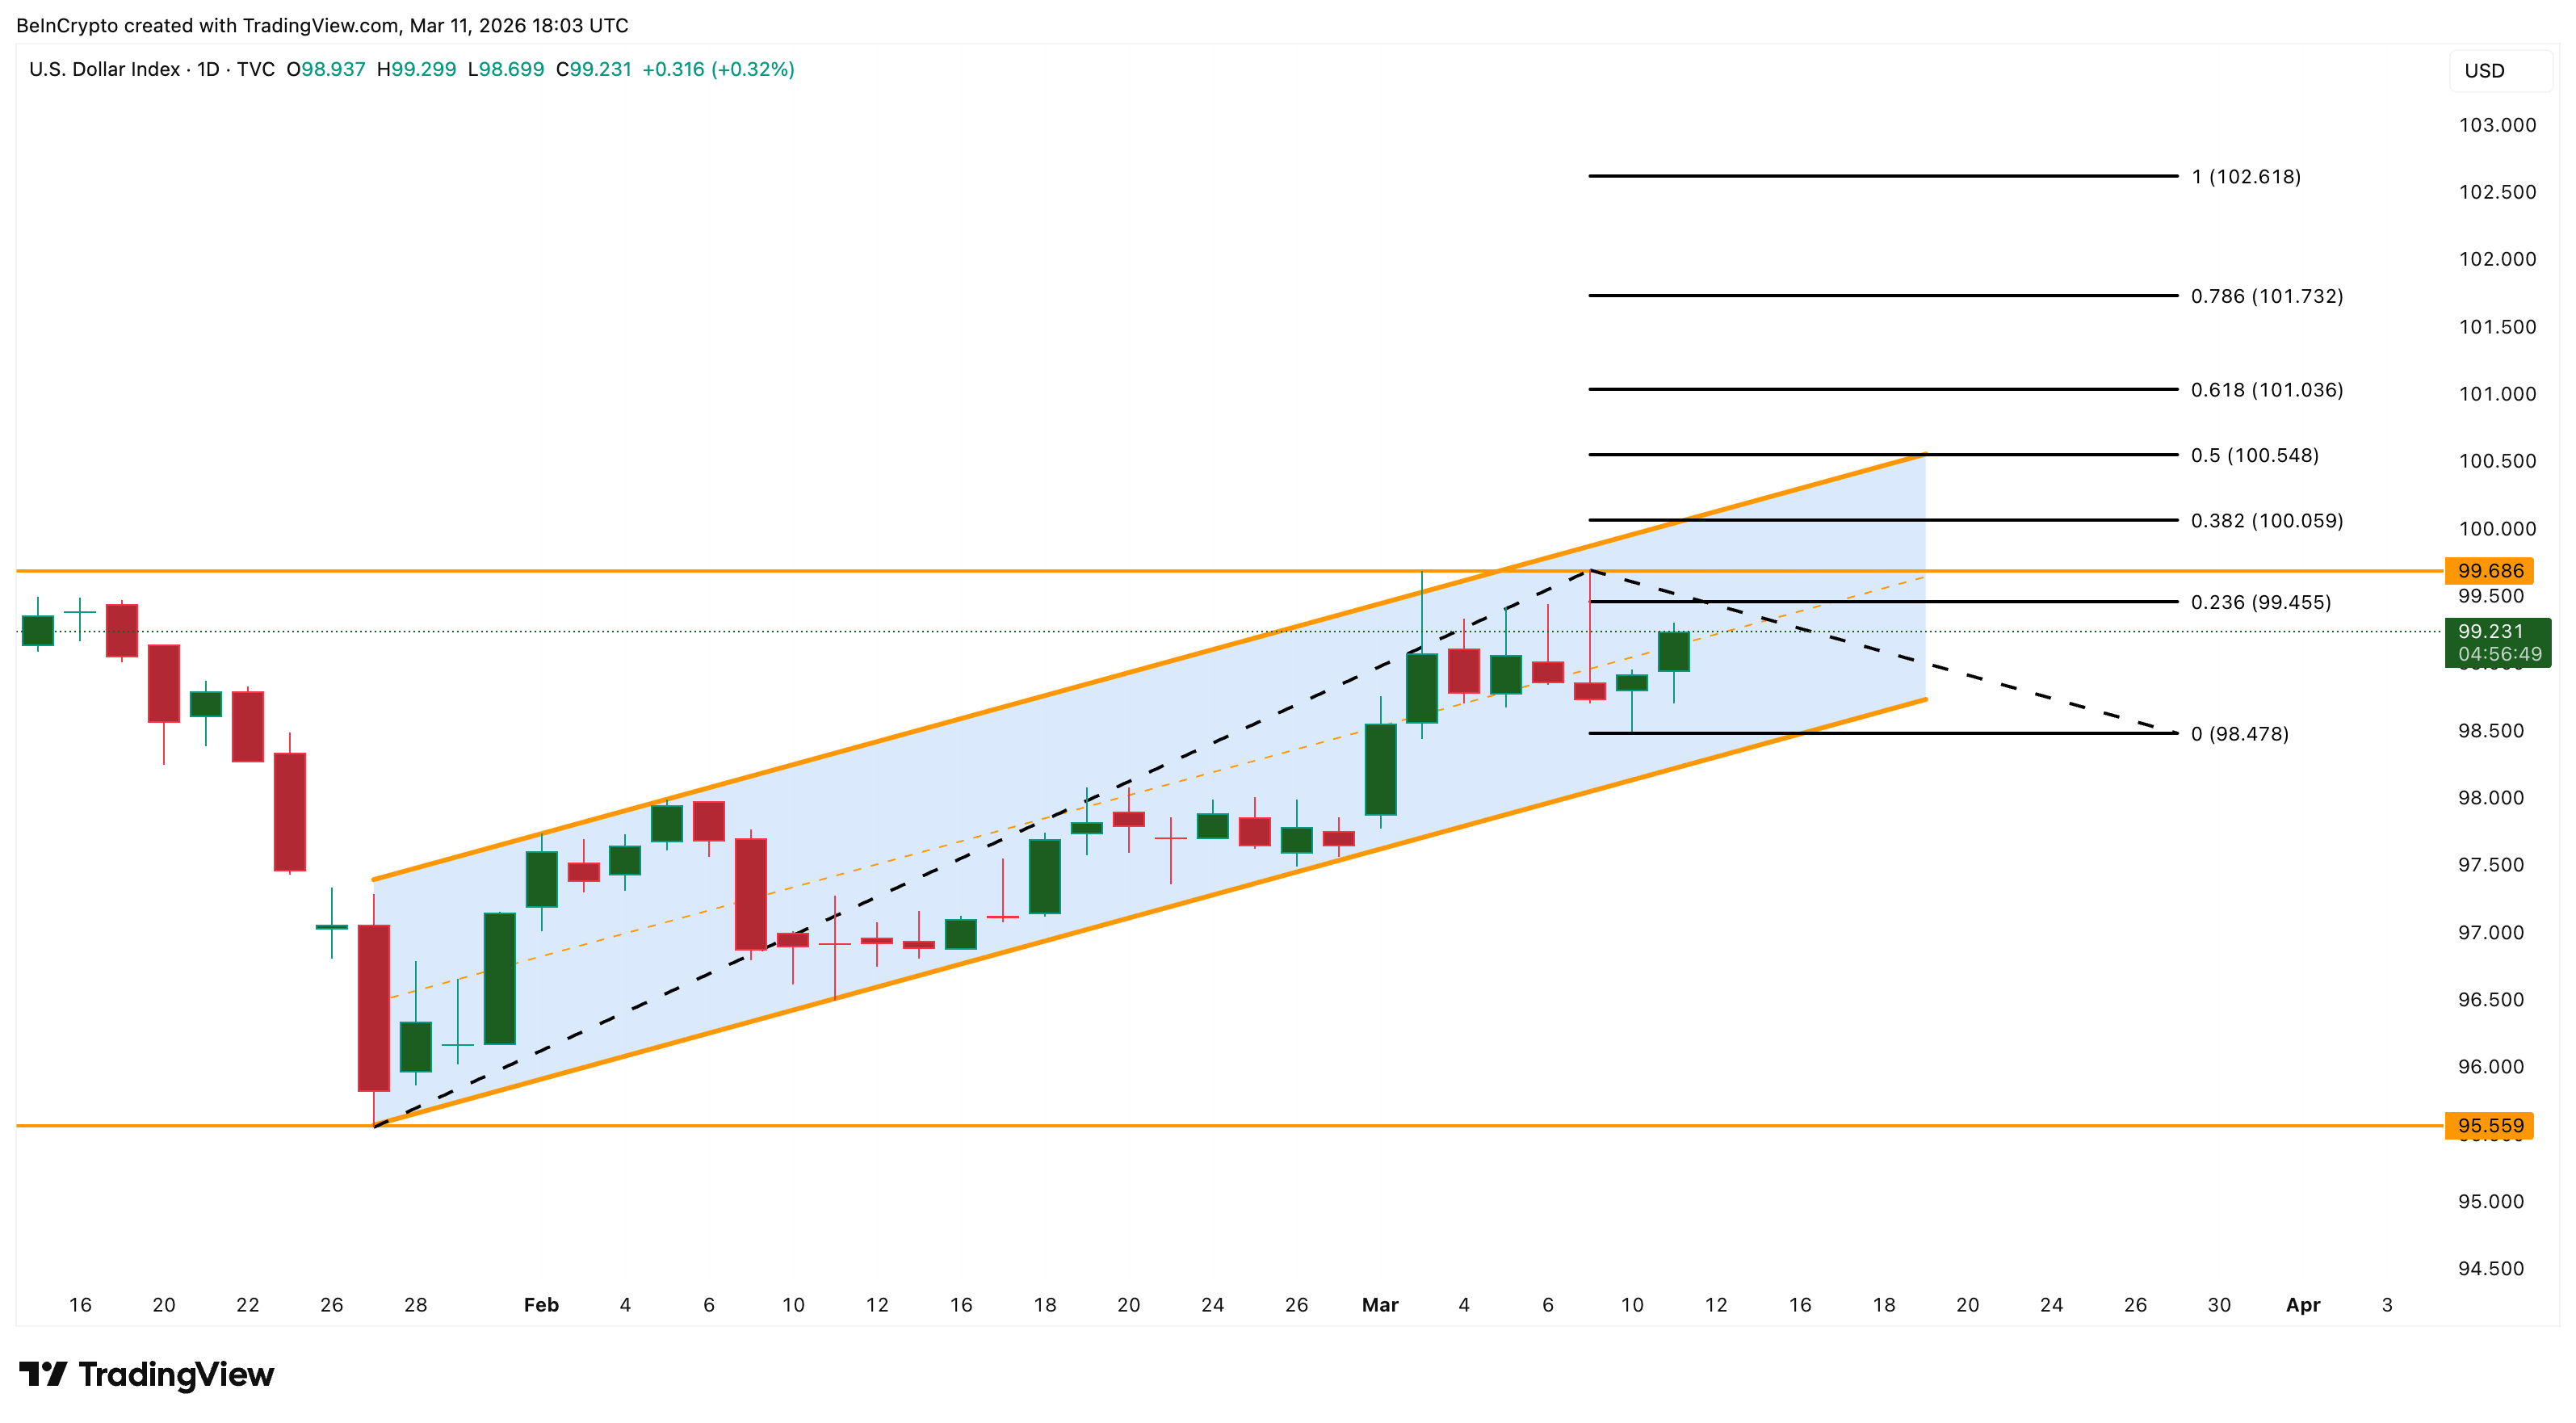
This petrodollar-driven co-movement lasts only as long as the war premium stays active. If de-escalation progresses, as Donald Trump has teased, both oil and the dollar could correct together.
A DXY breakout above $100 would signal that markets expect sustained oil-driven inflation and fewer Federal Reserve rate cuts this year. That scenario supports oil briefly but eventually weighs on global demand, circling back as a headwind.
Bearish Pattern Targets $55 for the Oil Price
The fading momentum, collapsing backwardation, shrinking participation, and a dollar poised to flip from support to risk all converge on the 8-hour chart, where a head-and-shoulders pattern is taking shape.
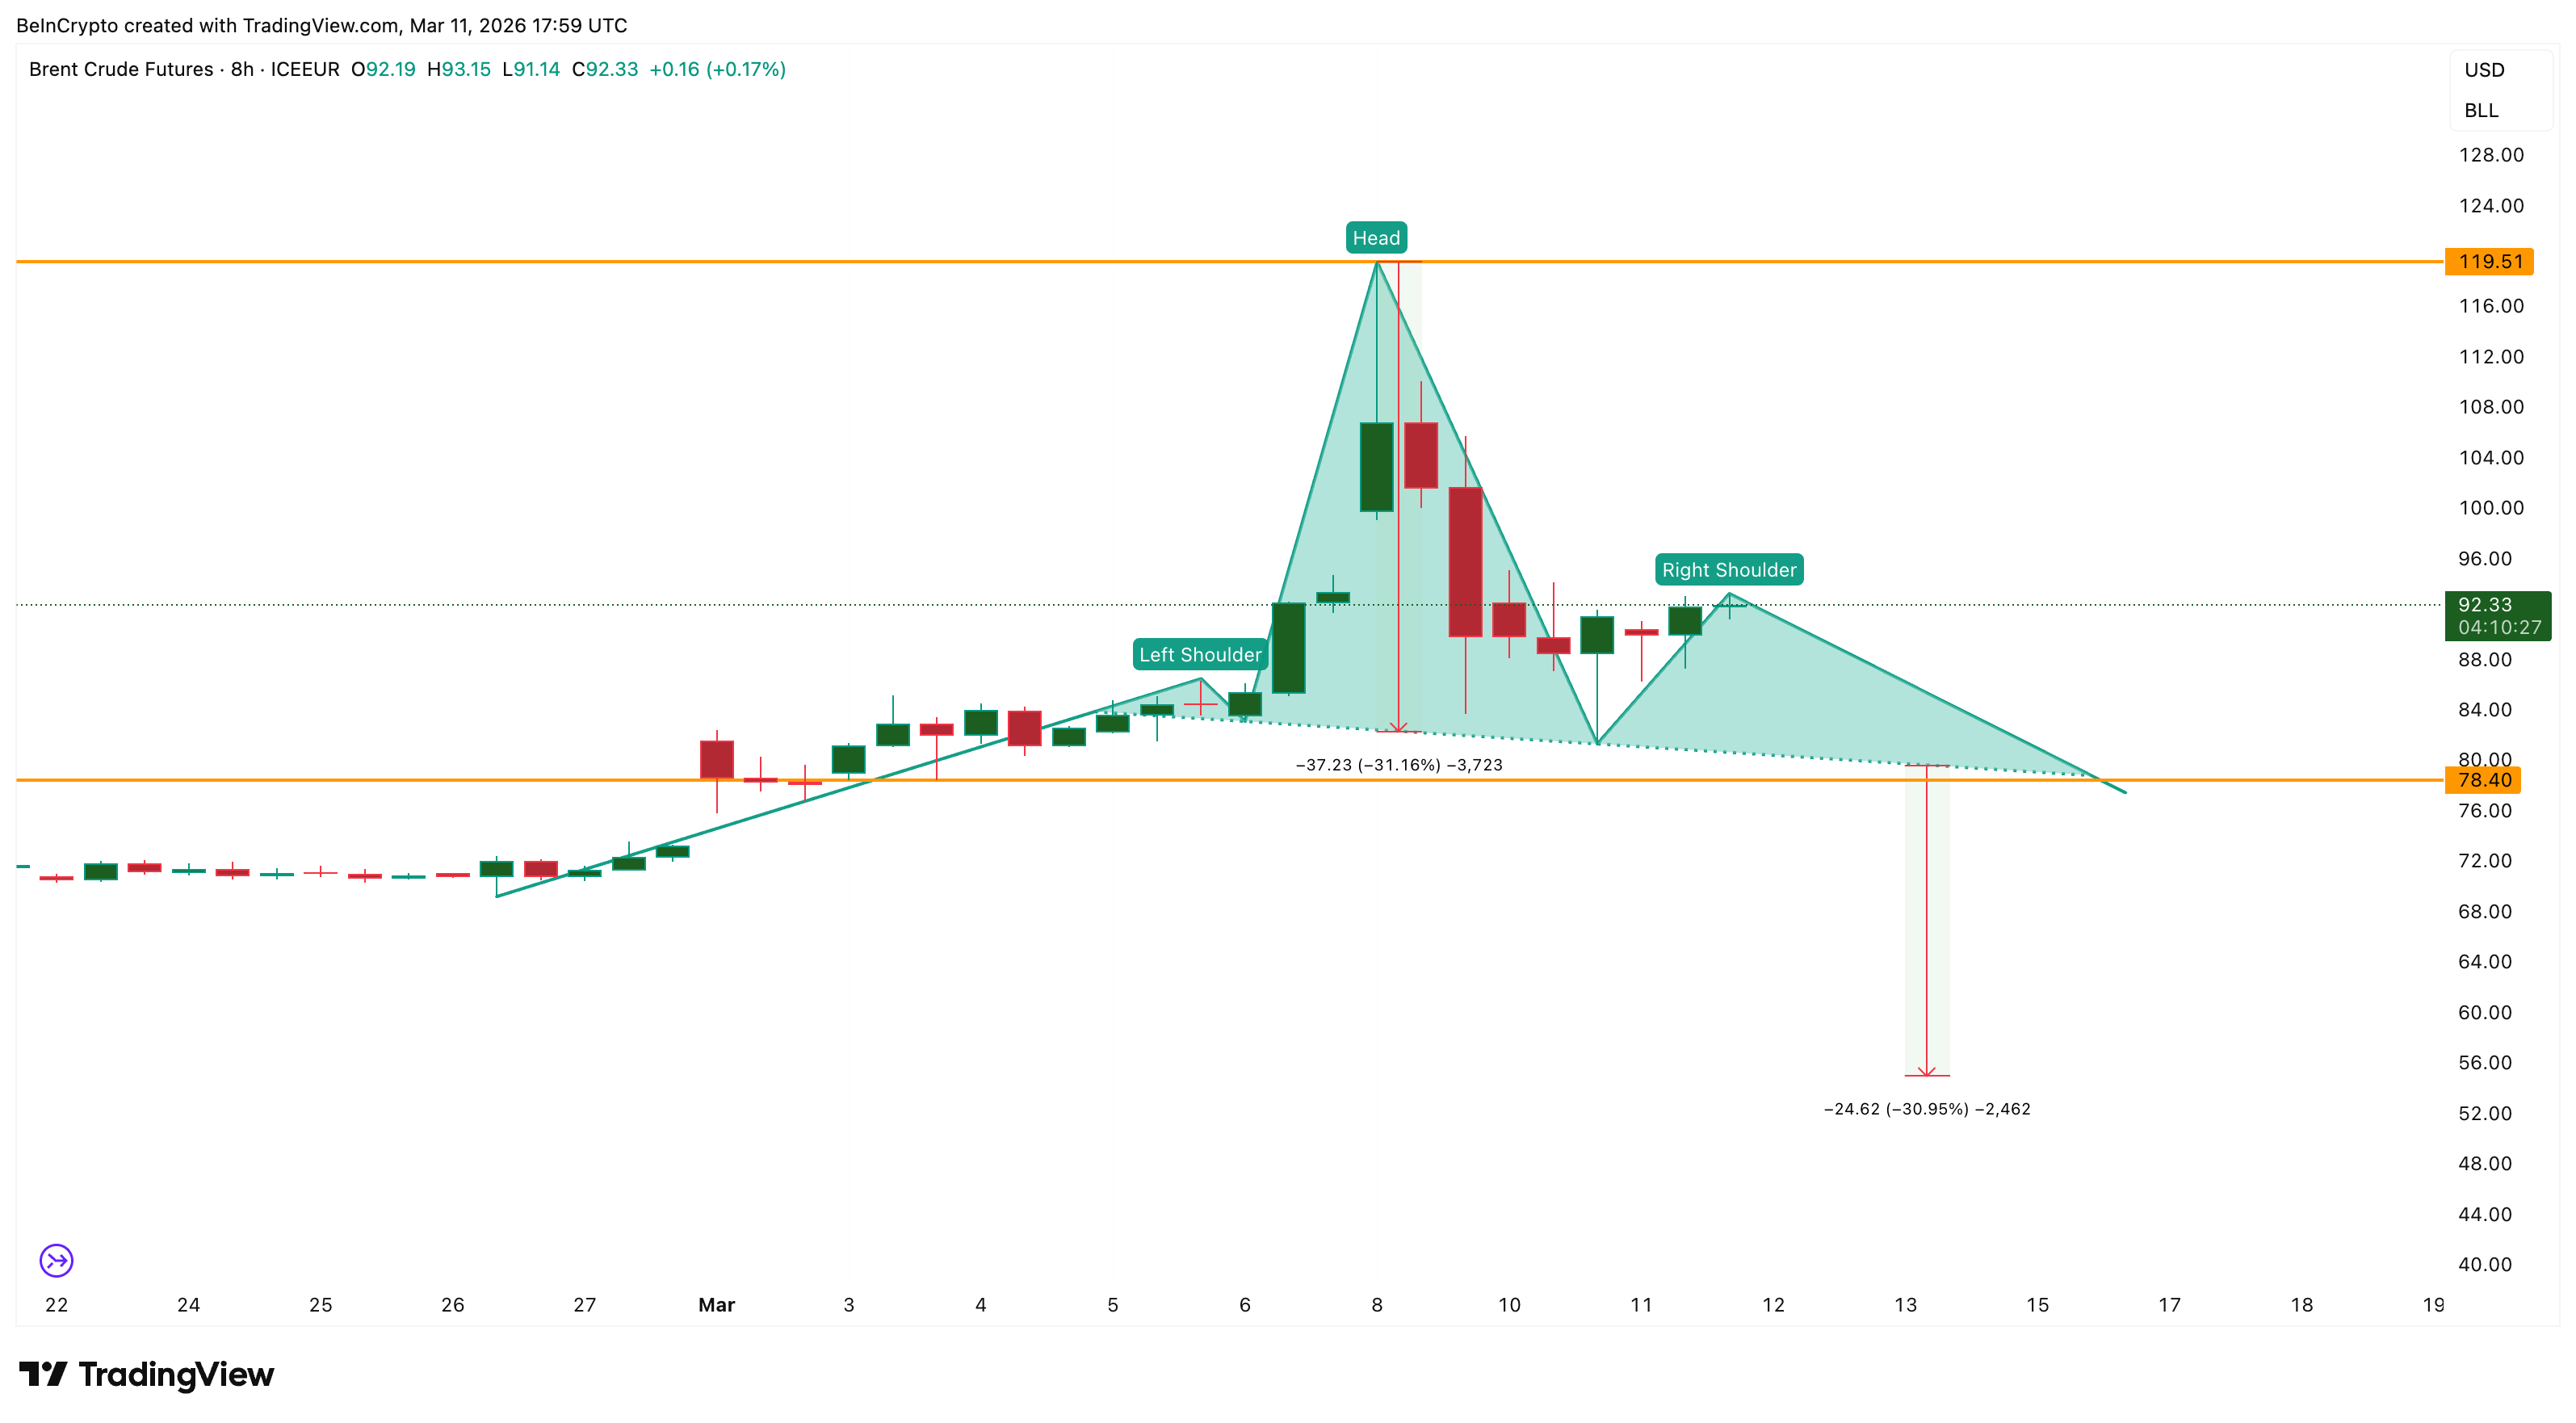
The head sits at $119, and the right shoulder is developing around $93 to $95. The neckline, the support connecting the lows between the shoulders, aligns with the $78 zone.
A confirmed break below $78 would validate the pattern. That would open the oil price path toward $73, then $67, with the full measured move target near $55, a roughly 31% decline from the neckline.
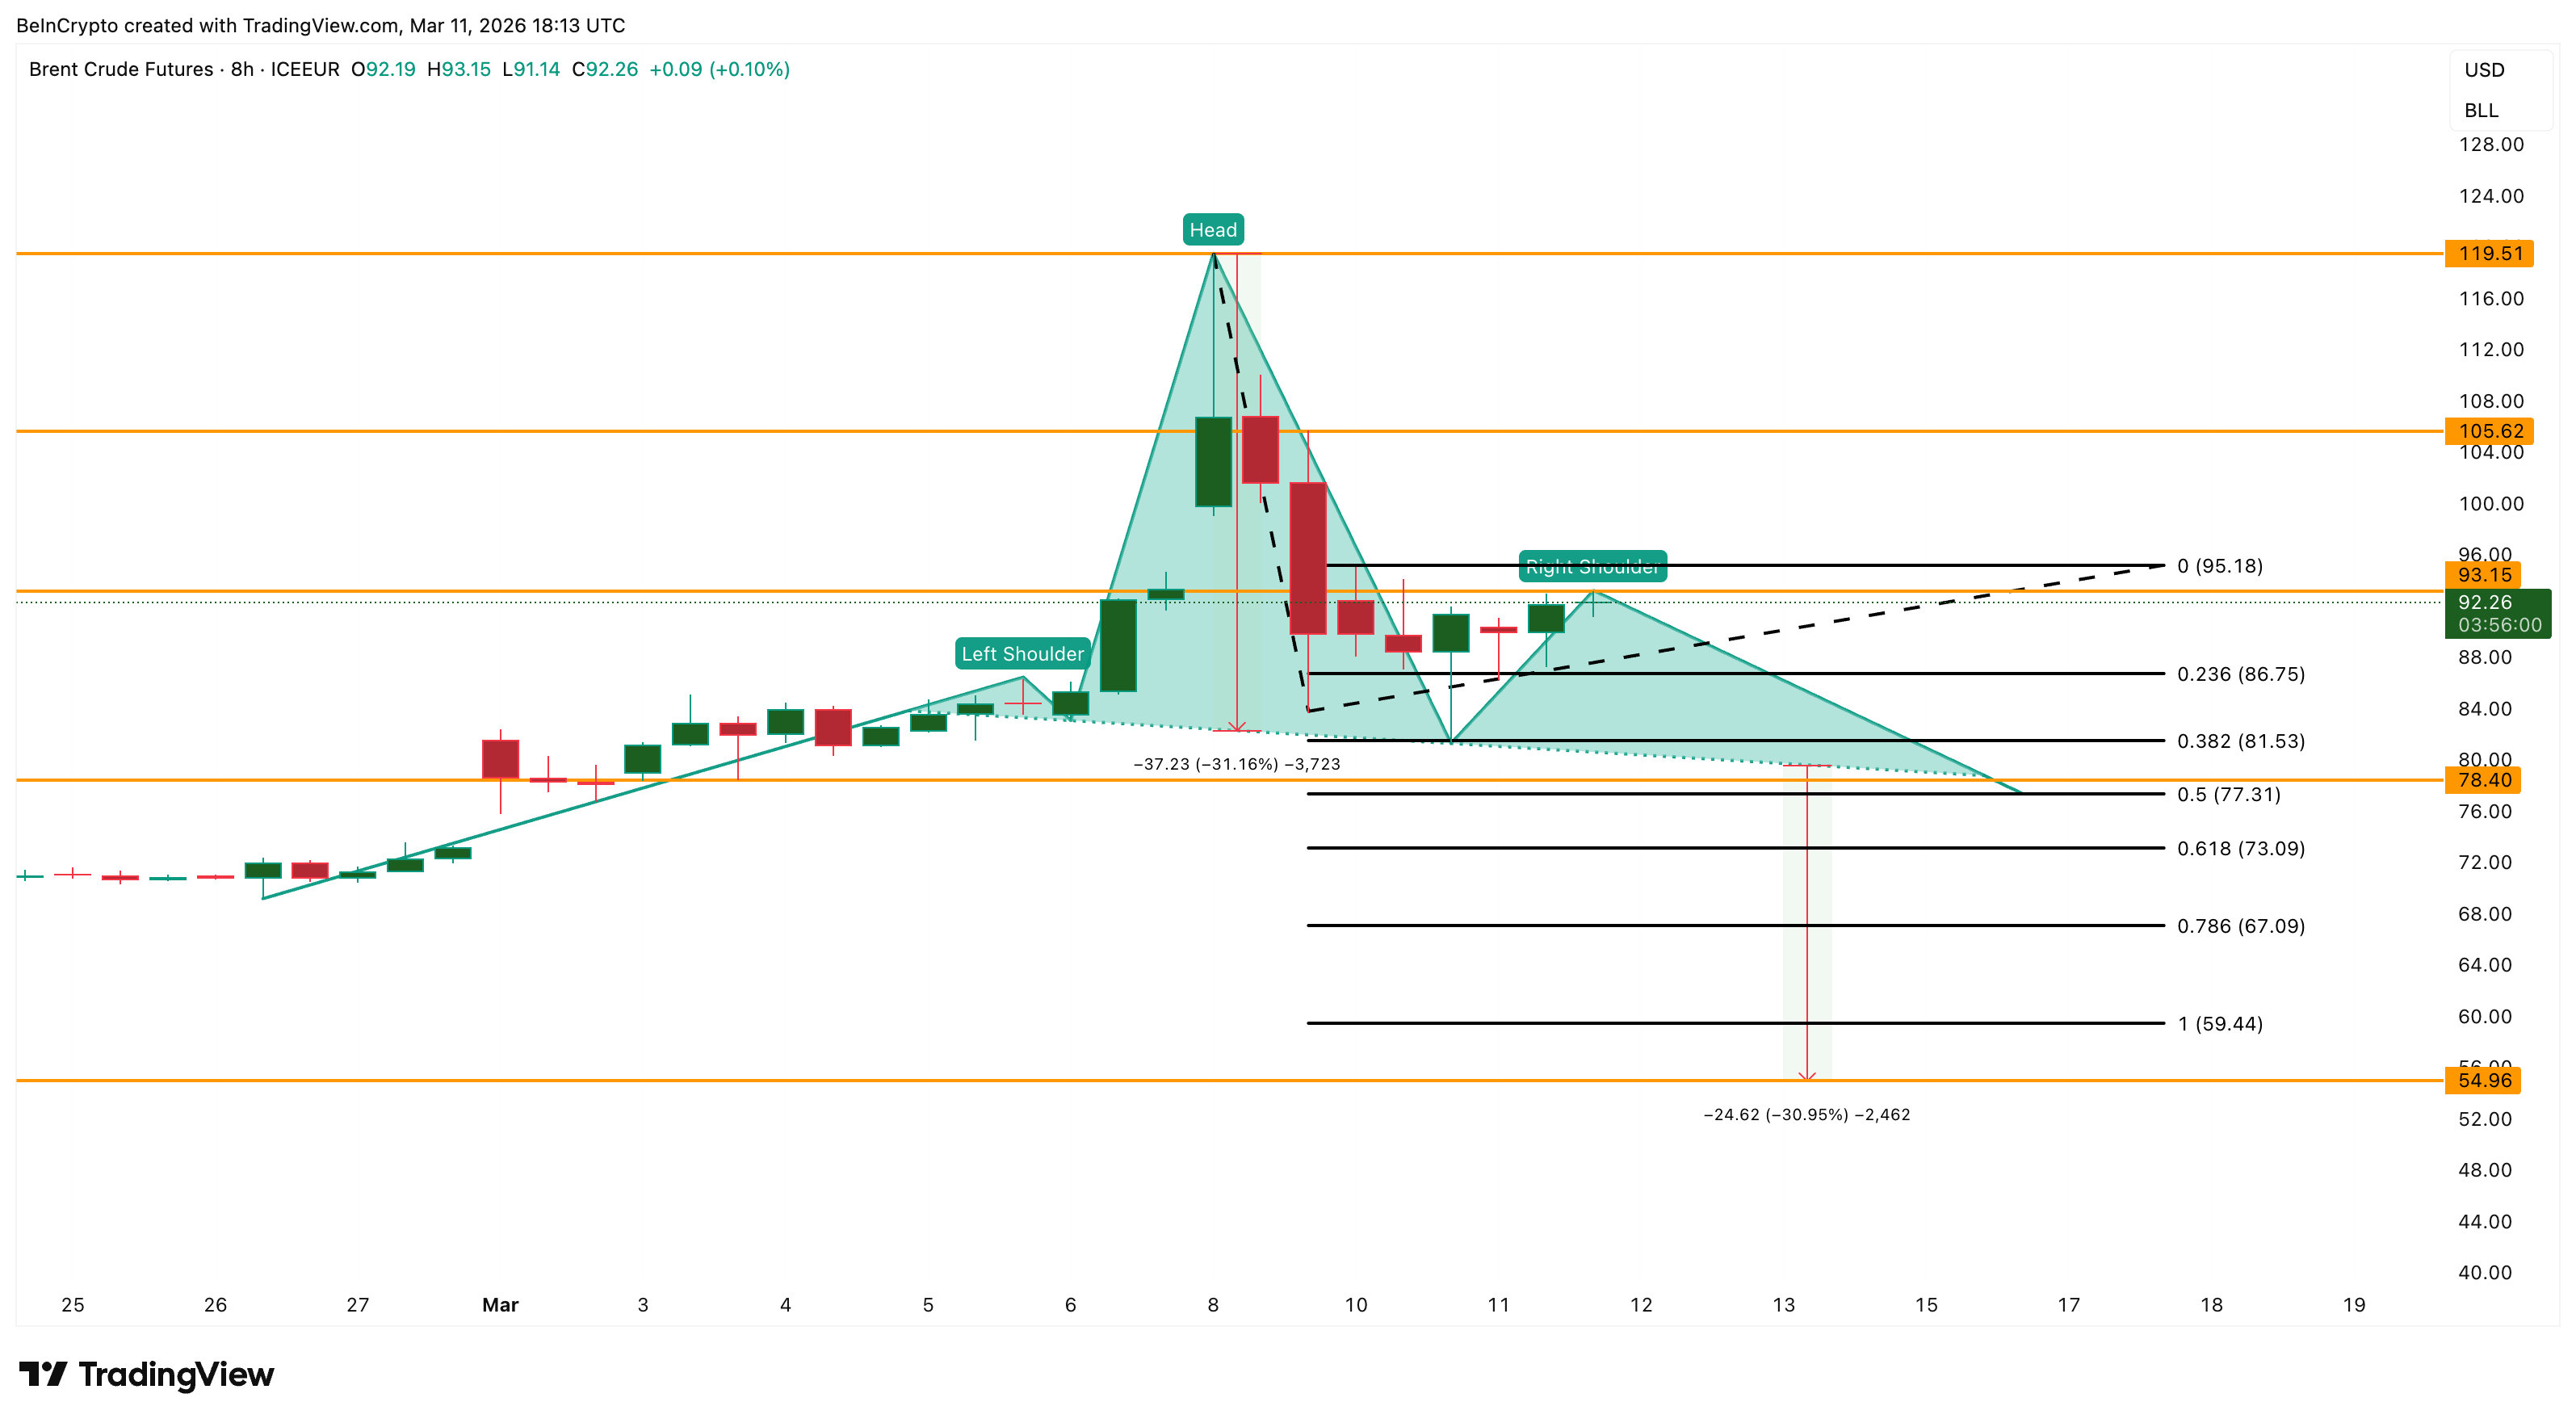
On the upside, a push above $93-$95 would weaken the bearish setup. A sustained move above $105 would invalidate it entirely.
However, retesting $119 looks unlikely given the de-escalation signals and the structural deterioration across backwardation, momentum, and participation covered above. More so with the ceasefire conditions released by Iran.
It could only happen if things between the US and Iran go from bad to worse.
The $78 neckline and $95 right shoulder cap define the range. A decisive break in either direction sets the tone for the next oil price move.
The post Oil Price Could Drop 30% Even With Iran’s Hormuz Standoff appeared first on BeInCrypto.