Brent crude futures are trading near $103 at press time after surging more than 40% over the past month, driven by the Iran-US conflict, Strait of Hormuz disruptions, and Iraqi force majeure declarations that collectively removed millions of barrels from global supply.
However, the rally’s intensity has faded over the past week, with Brent slipping roughly 2.84%. A closer look at the 4-hour chart reveals a pattern that suggests the market may already be pricing in the possibility that this conflict does not last. But then, it is just a possibility as one headline can change everything within hours.
Head and Shoulders Forms as RSI Weakens
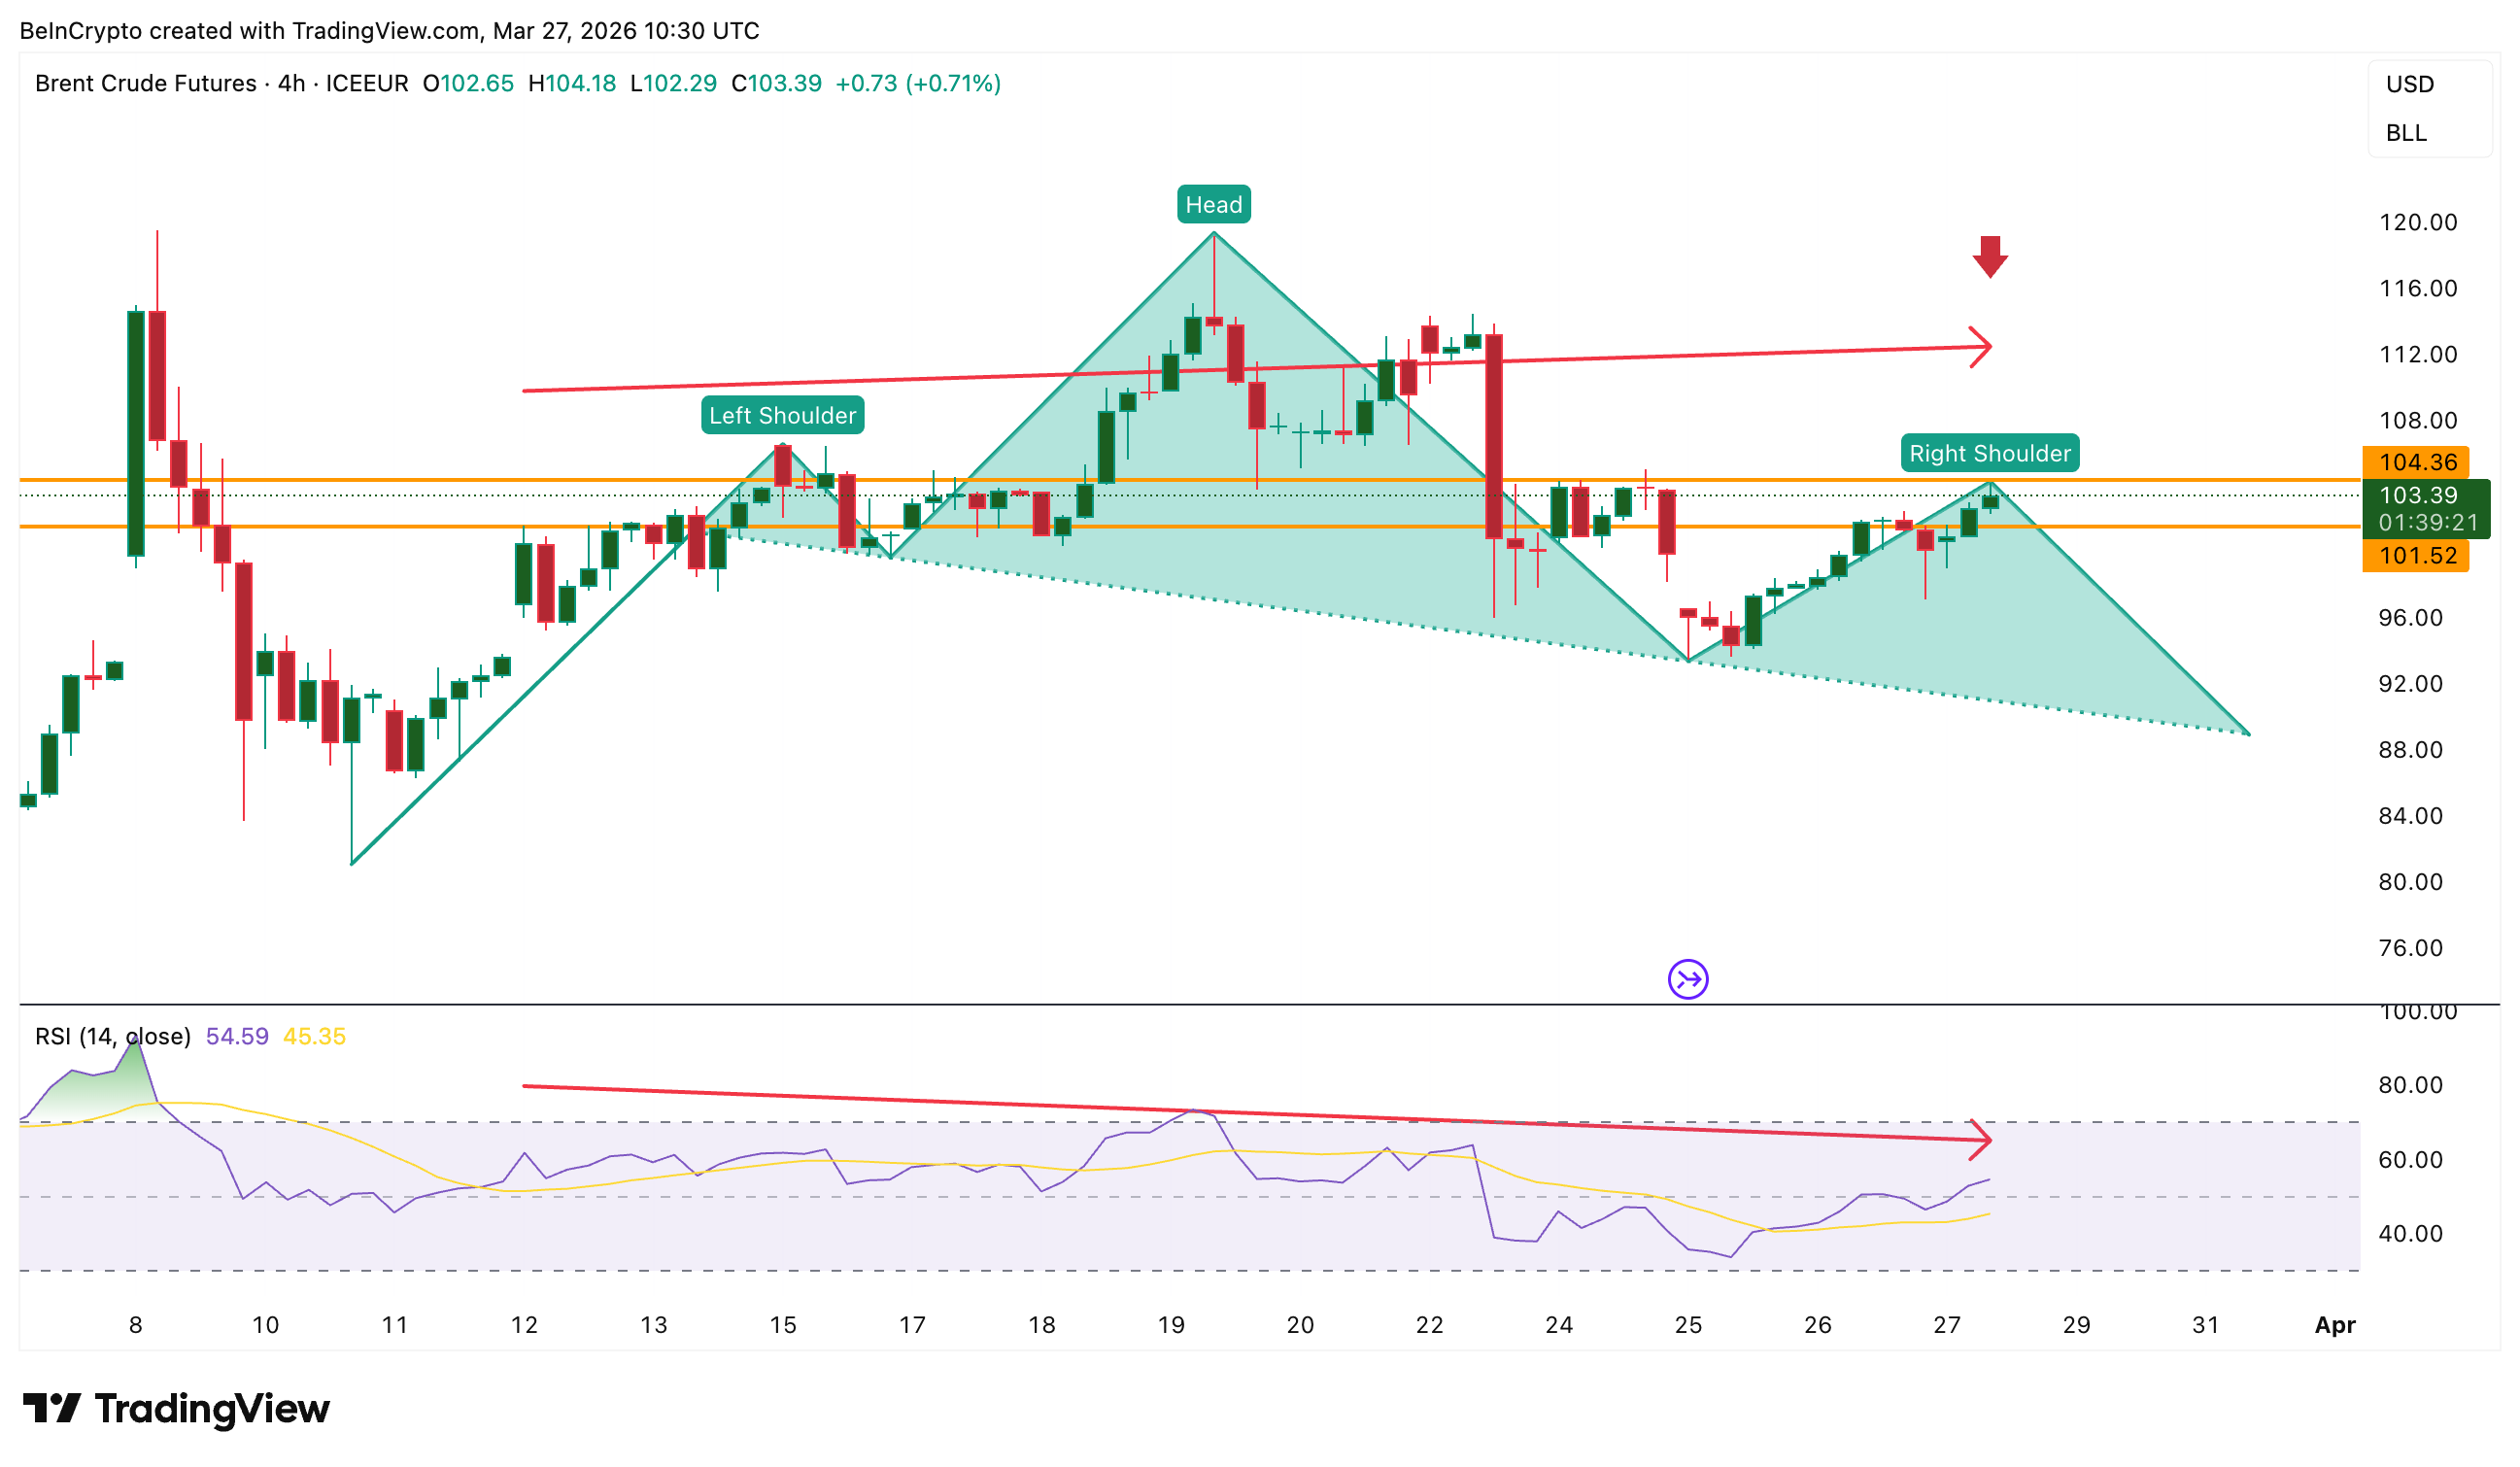
The Brent crude futures 4-hour chart on ICE Europe shows a head and shoulders pattern taking shape. This is a bearish pattern on the shorter time frame.
Between March 12 and March 27, the oil price is forming a higher high while the Relative Strength Index (RSI), a momentum oscillator, is forming a lower high. That bearish divergence suggests momentum is weakening even as the price holds elevated levels.
The divergence confirmation is pending. If the next 4-hour candle closes below the current candle’s high, it would confirm a swing high and validate the RSI structure. Above $104.37, the divergence gets invalidated for now.
In a market driven by geopolitical risk premium, weakening momentum on the 4-hour chart could reflect traders beginning to hedge against a de-escalation scenario.
Iran rejected direct US talks on Wednesday, but futures markets tend to price in outcomes before headlines confirm them.
Backwardation Holds, but the Dollar Adds Pressure on Brent Crude
The spread between front-month and second-month Brent contracts (BRN1! minus BRN2!) has climbed steadily to $5.73. When front-month contracts trade at a premium over later deliveries, the market is in backwardation, a condition reflecting urgency for immediate physical barrels.
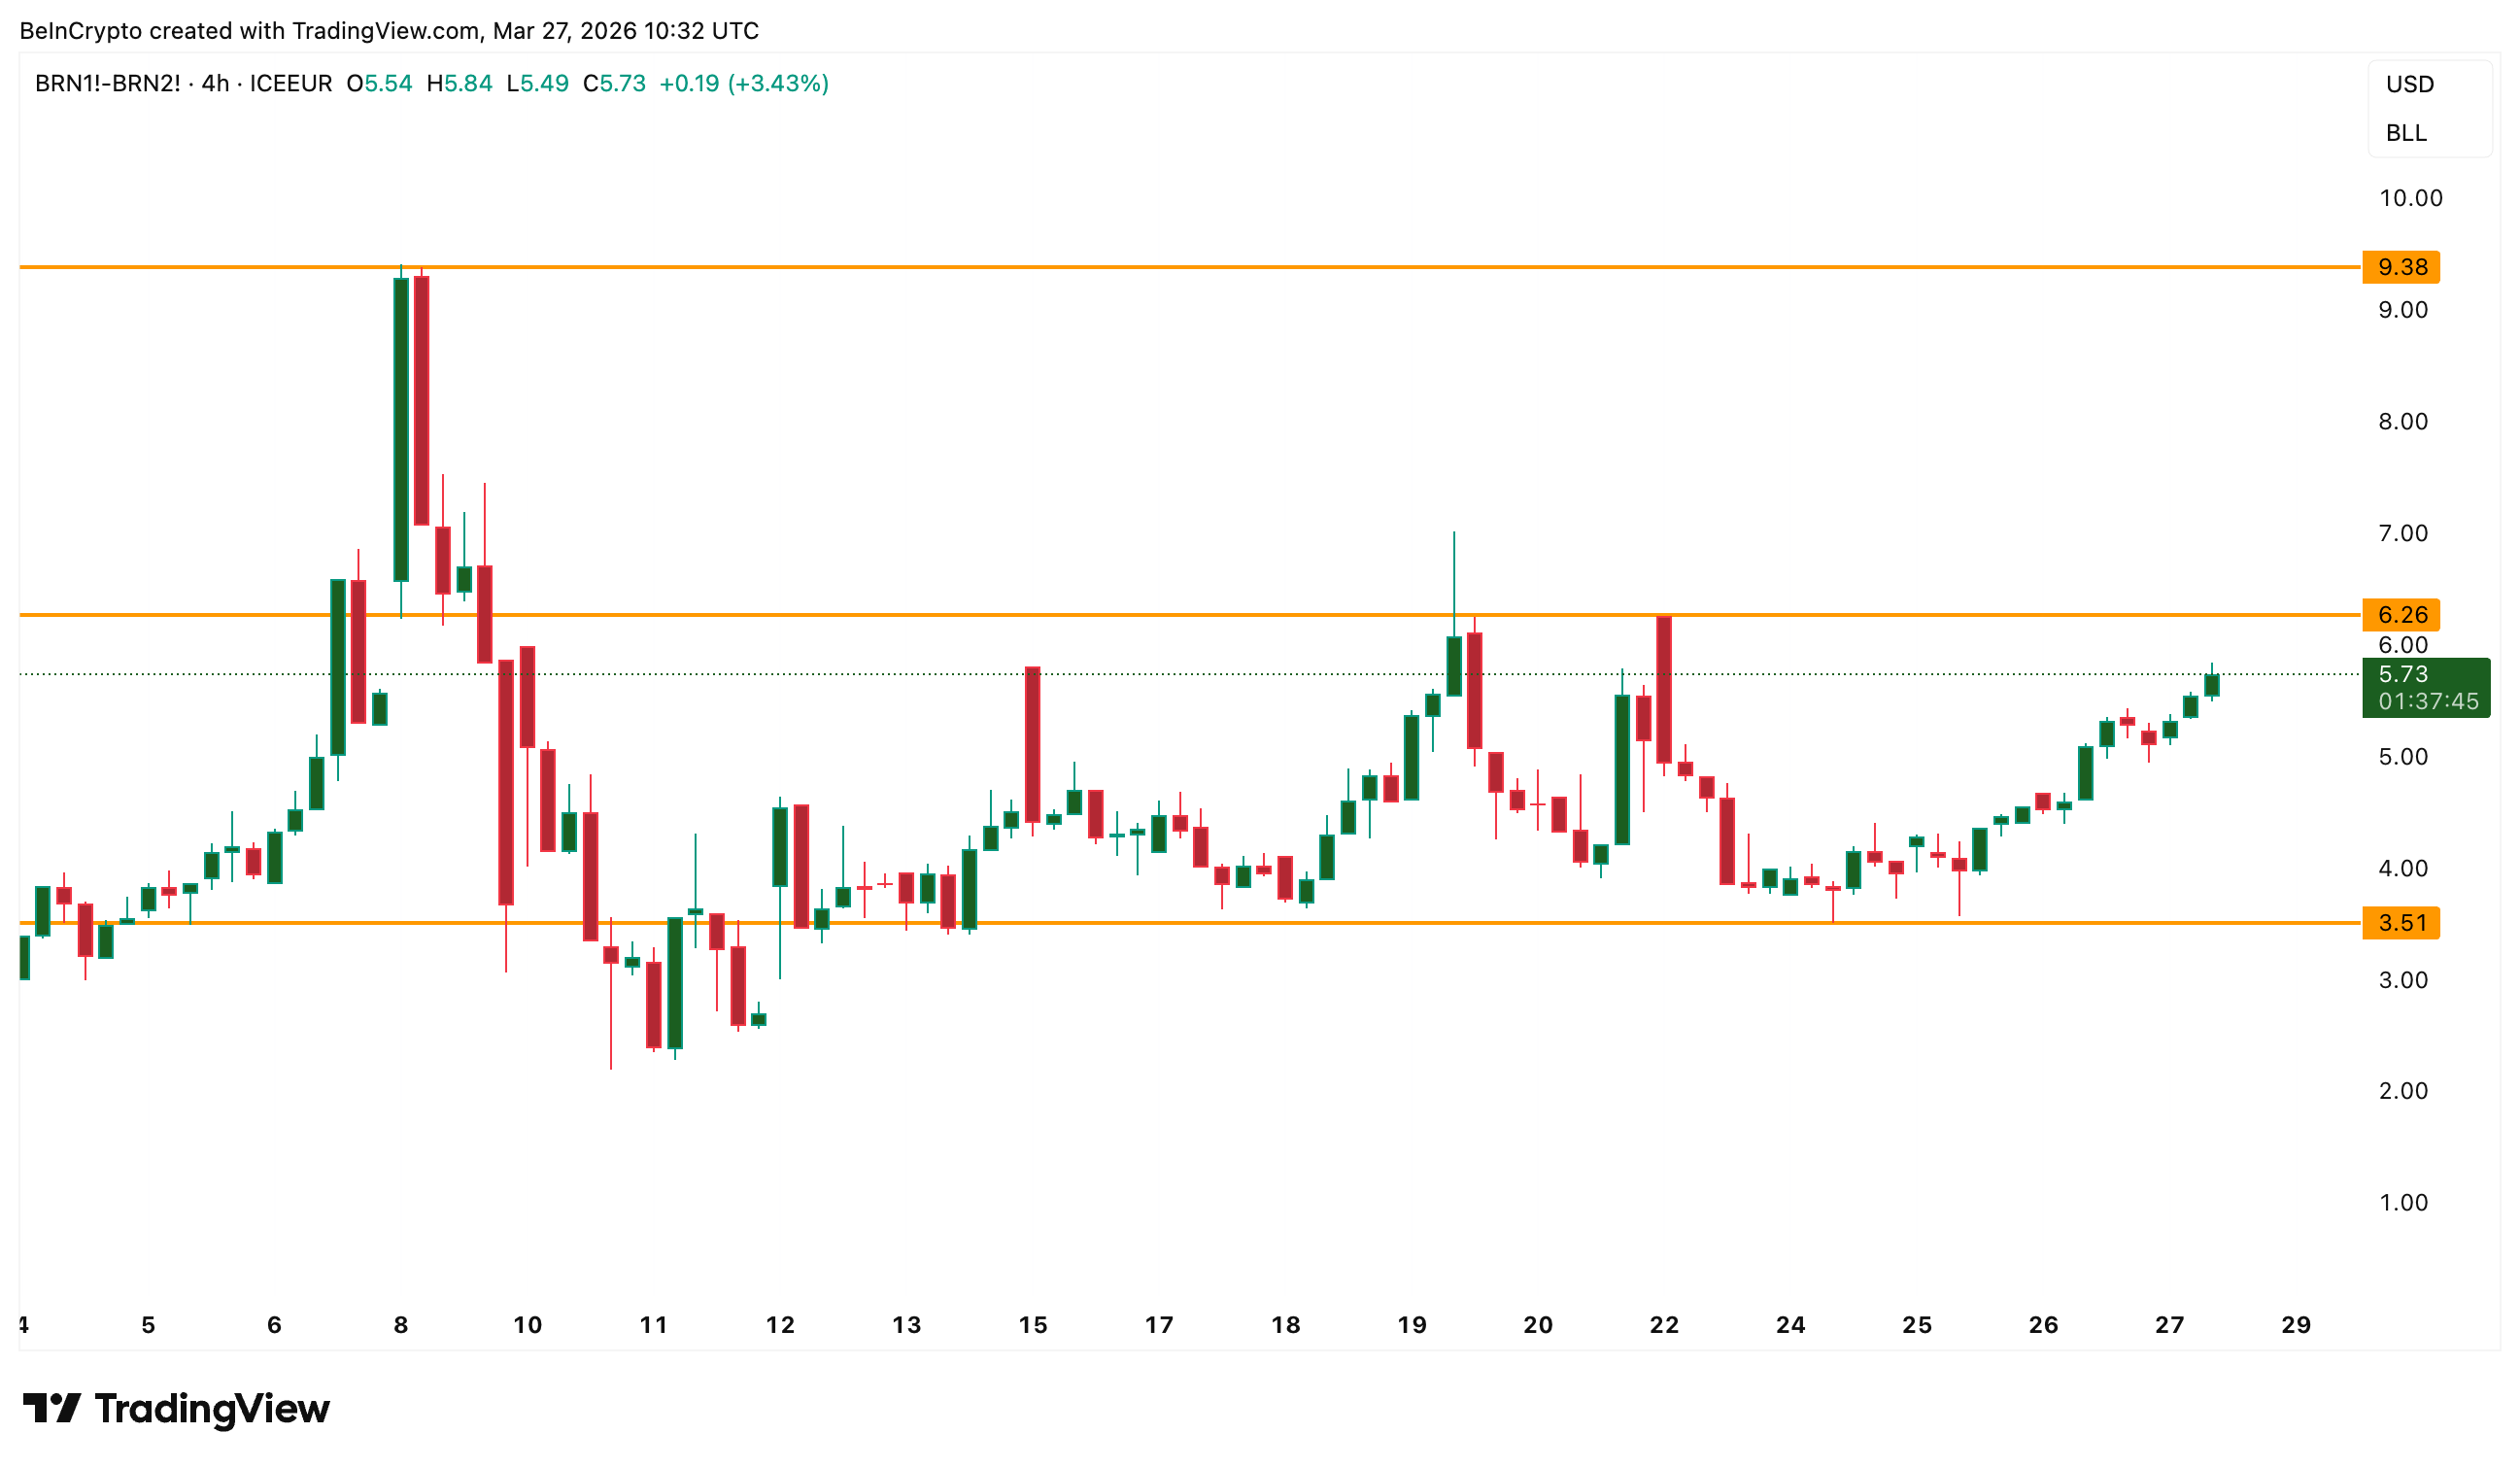
However, backwardation also carries a second reading. When later-month contracts trade at a discount to the front month, the market is effectively pricing in lower prices ahead (validates the pattern), suggesting that traders expect the current supply urgency to ease rather than persist. A possible hint at a ceasefire?
The US Dollar Index (DXY) has broken out of a bull flag on the daily chart and trades near 100.16.
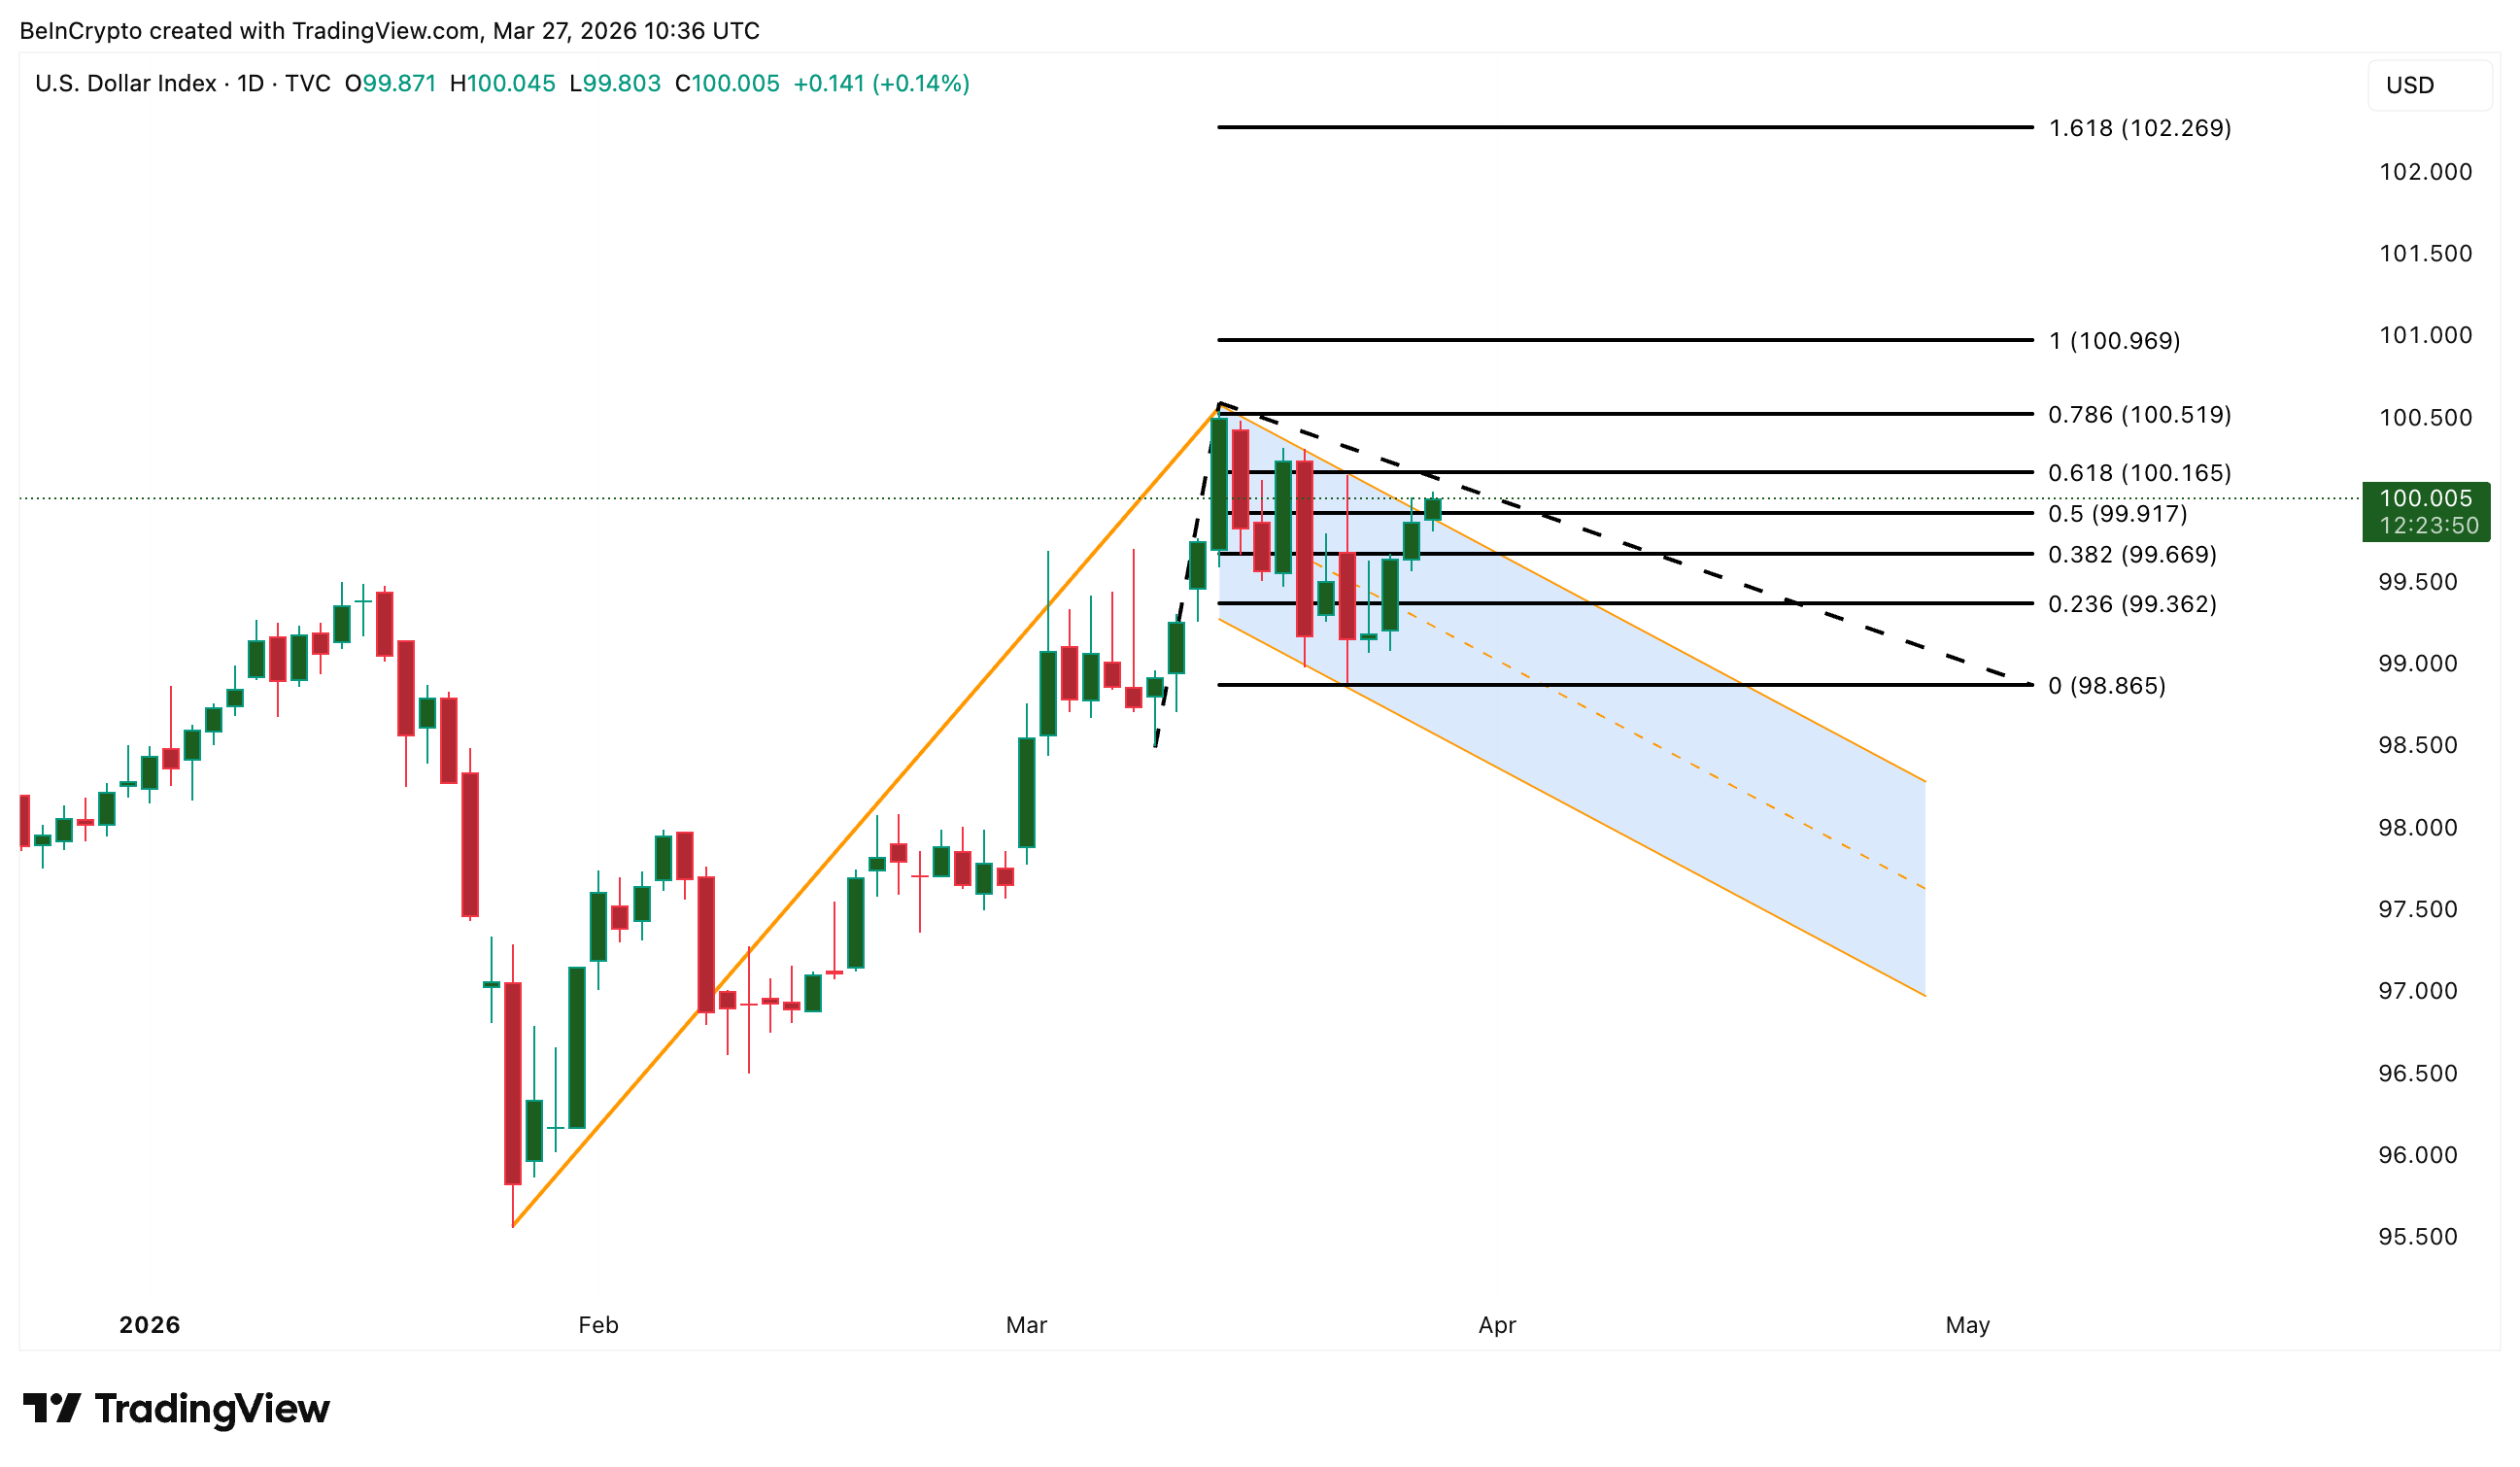
Traditionally, a rising dollar pressures oil lower because crude is priced in dollars. That inverse relationship was disrupted recently by the petrodollar effect, where rising oil forces importing nations to buy more dollars.
However, that positive correlation appears to be fraying. Over the past week, Brent slipped 2.84% while DXY gained 0.34%. If the traditional inverse playbook reasserts, dollar strength becomes a headwind for Brent.
BNO Positioning Leans Bullish, but Conviction Cools
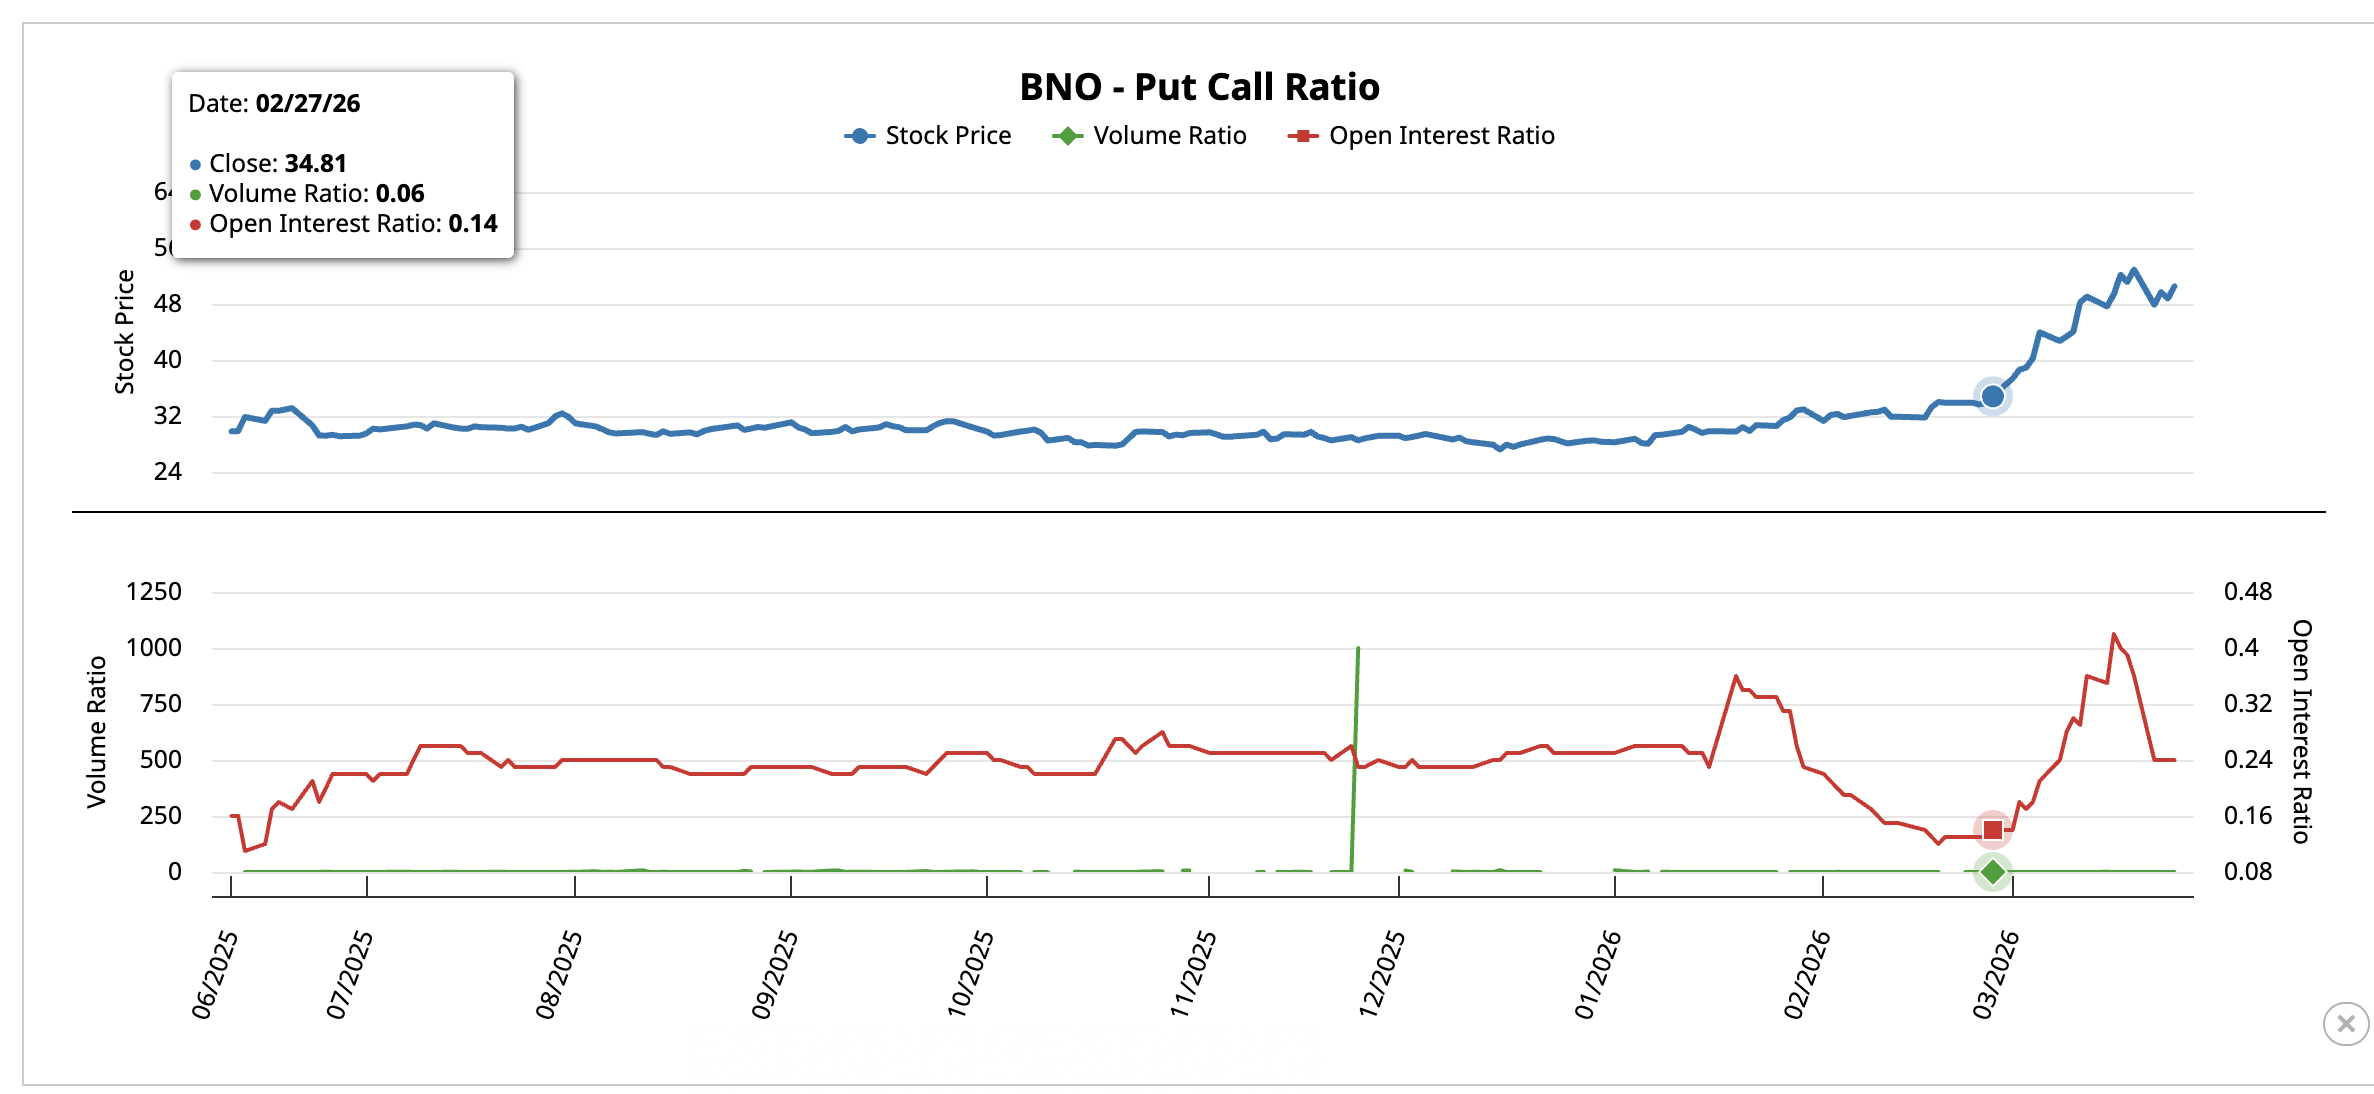
The BNO United States Brent Oil Fund, which tracks Brent crude futures, shows how options sentiment has shifted. One month ago, when BNO traded at $34.81, the put-call volume ratio sat at 0.06 and the open interest ratio at 0.14. The market was overwhelmingly positioned for upside.
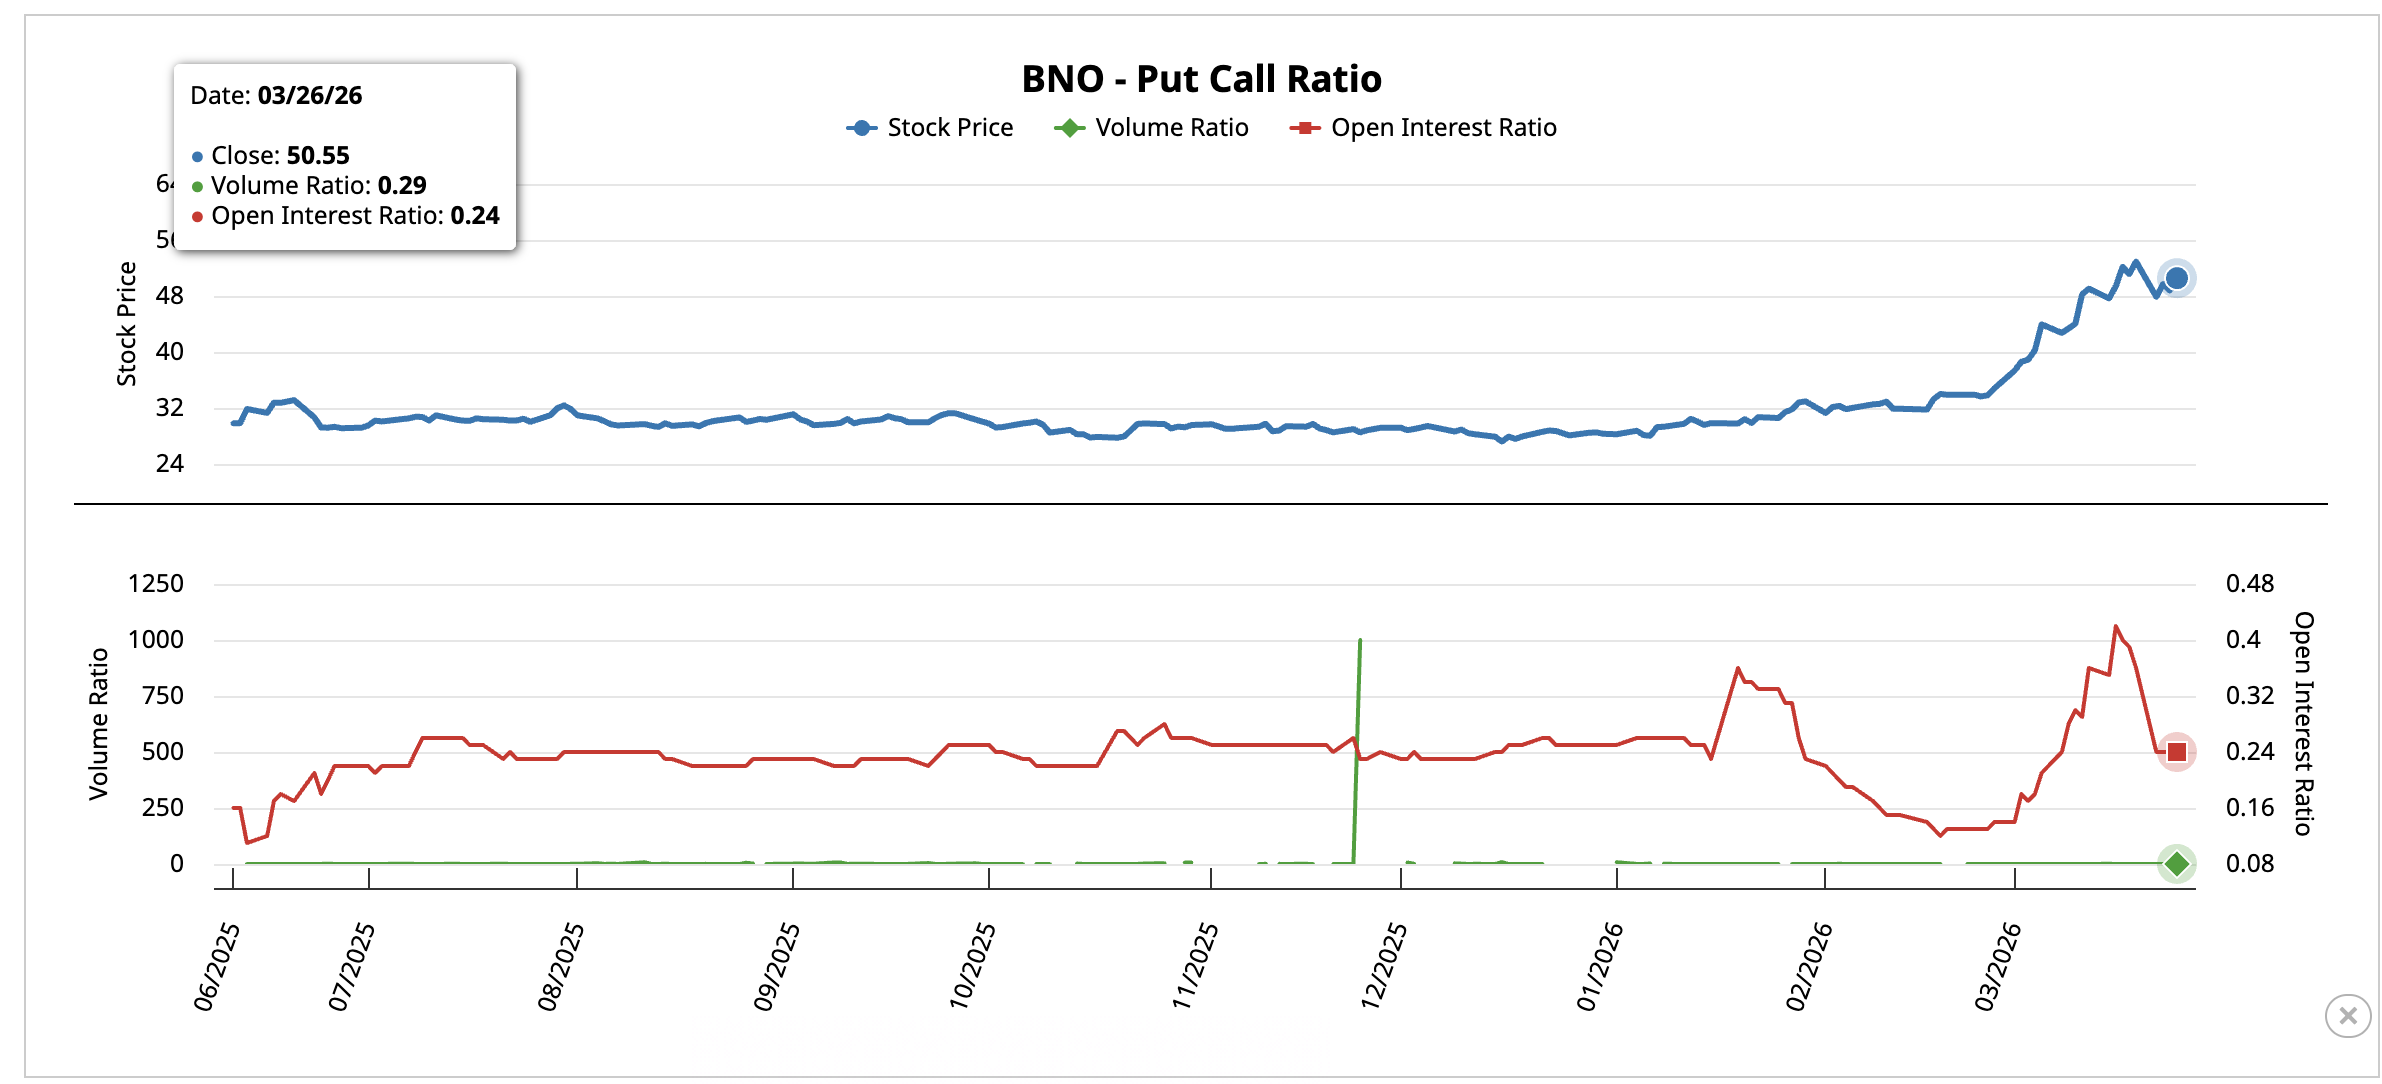
By March 26, with BNO at $50.55, the volume ratio had climbed to 0.29 and the open interest ratio to 0.24. Both remain below 1.0, so calls still dominate. However, the shift from 0.06 to 0.29 shows traders are adding downside protection as conviction cools.
This means a breakdown is possible, but may not be immediate. The 4-hour pattern leans bearish, the dollar leans bearish for oil, and the put-call ratio shows cooling conviction. Yet positioning has not flipped, and backwardation still reflects real supply urgency.
Oil Price Levels and the Ceasefire Question
While the 4-hour pattern leans bearish, current market conditions remain highly volatile. Shorter-timeframe patterns in a geopolitically driven market should be interpreted with appropriate caution.
If the head and shoulders pattern confirms, the measured move shows an 18% projected correction. Key levels on the downside include $98.27, followed by $88.39, the 0.618 Fibonacci level. Breaking under $88.39 would expose the neckline, with the full measured move pointing toward $72.62.
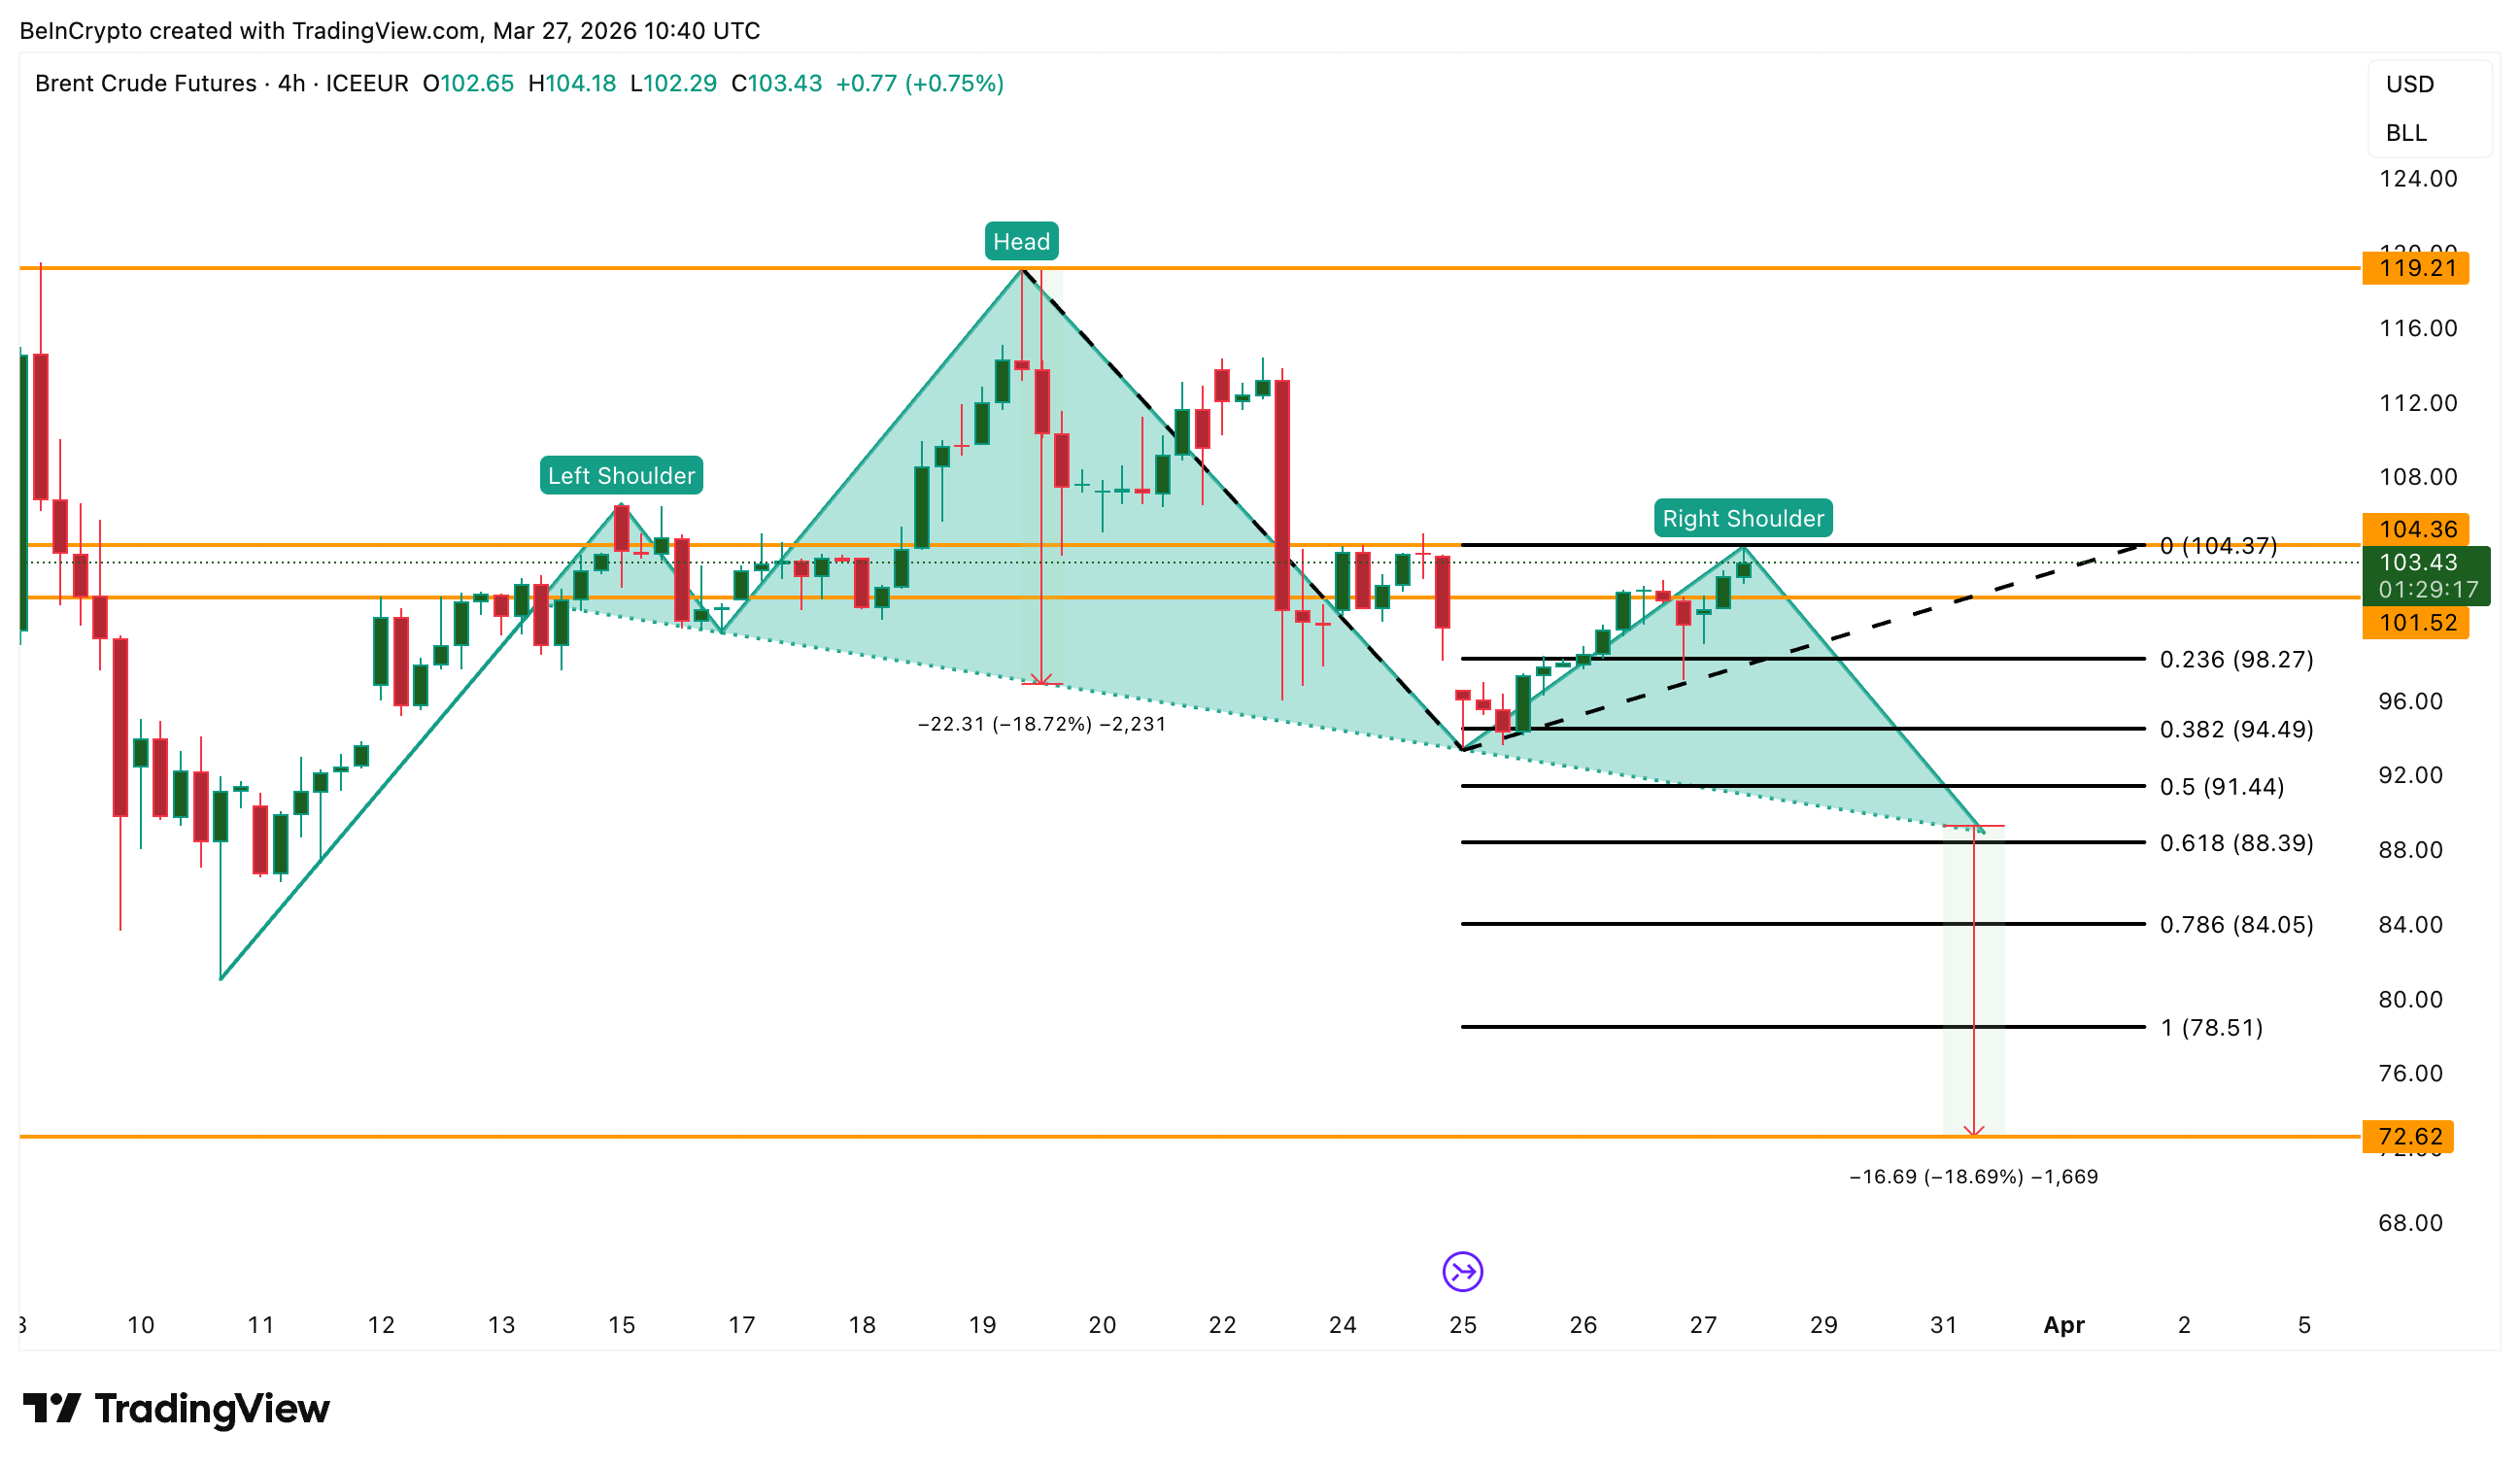
On the upside, a 4-hour close above $104.37 would weaken the bearish case for Brent Crude. Full pattern invalidation sits at $119.
For now, the chart, the dollar, and the RSI are collectively asking the same question. Is the oil price already pricing in a resolution that the headlines have not yet confirmed?
The post Oil Price at $103 Meets a Bearish Brent Pattern, Is a Ceasefire Being Priced In? appeared first on BeInCrypto.