Hyperliquid (HYPE) is trading at $39, down 2.79% on the day after failing to hold gains above $42. The chart shows a double top formation on the 2-day timeframe, and capital flow data is now tipping to negative for the first time since early March.
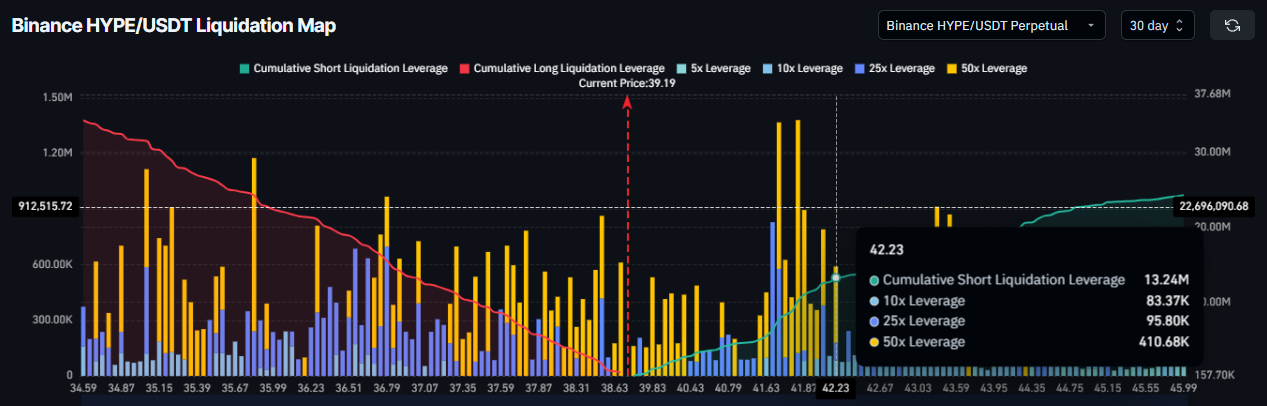
The $42 level carries the largest short liquidation cluster in the 30-day map. A move above it is now looking increasingly unlikely.
Short Liquidations Ahead In HYPE’s Path
HYPE liquidation map shows cumulative short liquidation leverage of $13.24 million concentrated at the $42 price level. This cluster acts as a ceiling rather than a catalyst.
For the price to move above $42 and trigger a genuine short squeeze, buyers would need to overpower $13.24 million in stacked short leverage. With CMF at zero and declining, the demand simply is not present to accomplish that.
Want more token insights like this? Sign up for Editor Harsh Notariya’s Daily Crypto Newsletter here.
Capital Is Leaving HYPE
The CMF on the HYPE chart peaked near 0.20 during March 15–19 as the price pushed toward $42. Since then, it has declined without interruption, reaching exactly 0.00 on March 26.
A CMF reading at zero means buying and selling volumes are perfectly balanced on a dollar-weighted basis. Any further decline pushes the indicator below the zero line, which would signal that capital outflows are dominating inflows. That transition — from positive to negative — is the precise inflection point that historically precedes sustained price drops rather than consolidations.
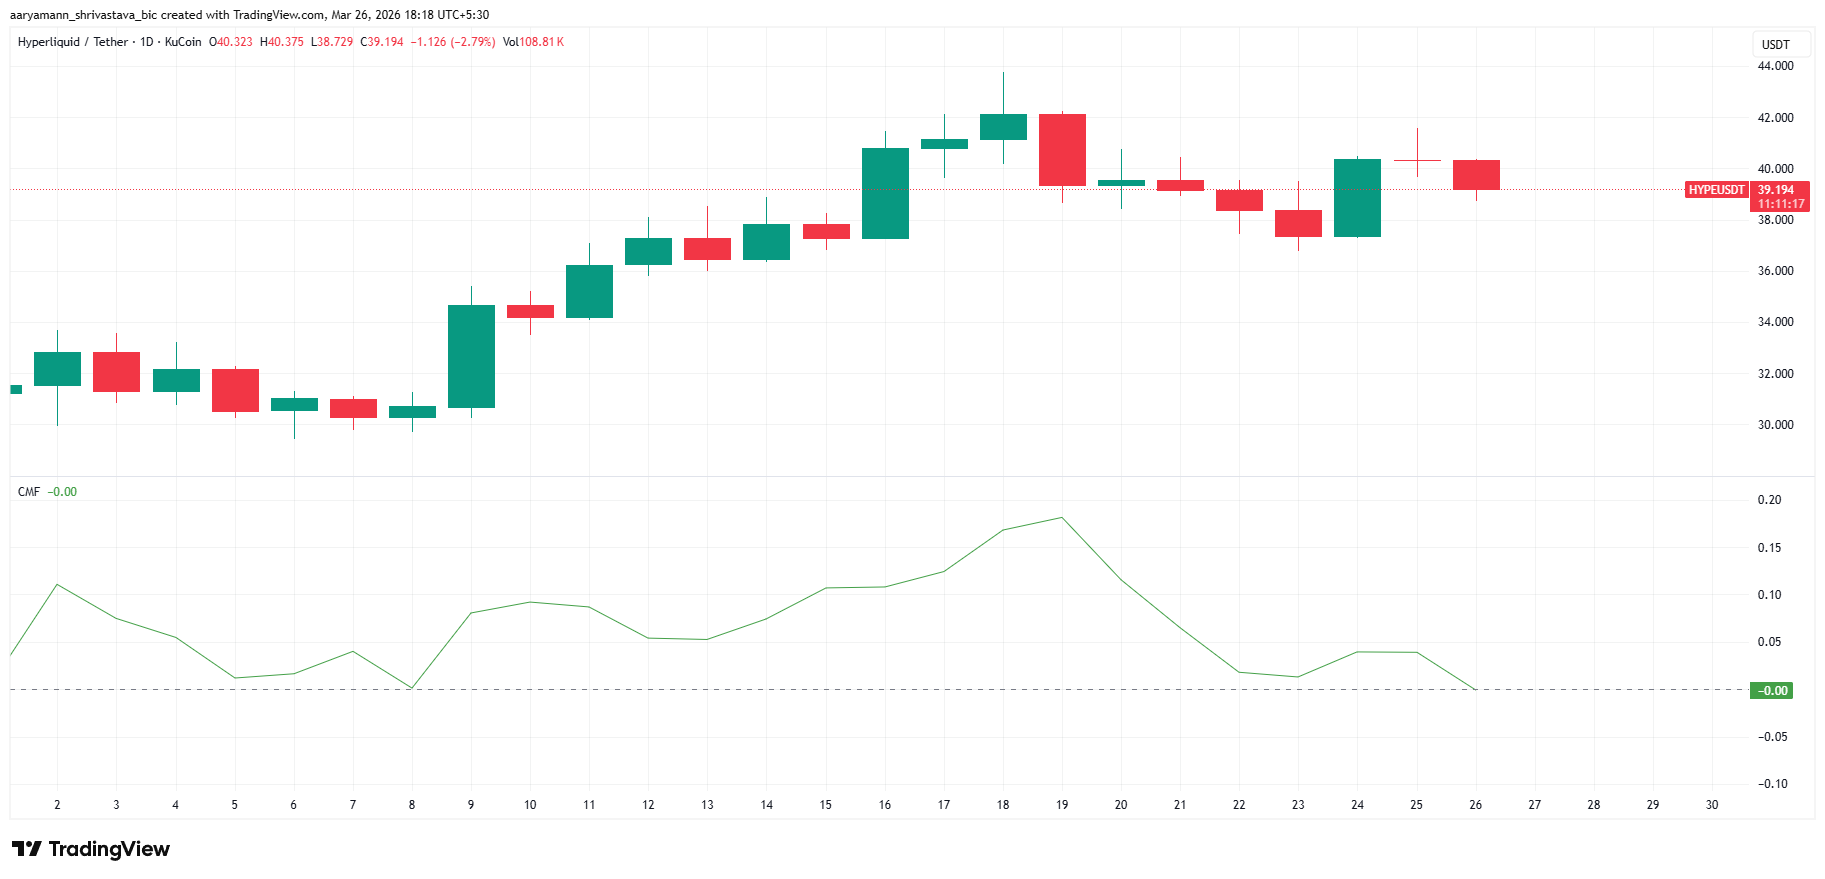
CMF spent most of early March building from 0.05 toward 0.20, providing the fuel for HYPE’s rally to $42. That tailwind has now fully unwound.
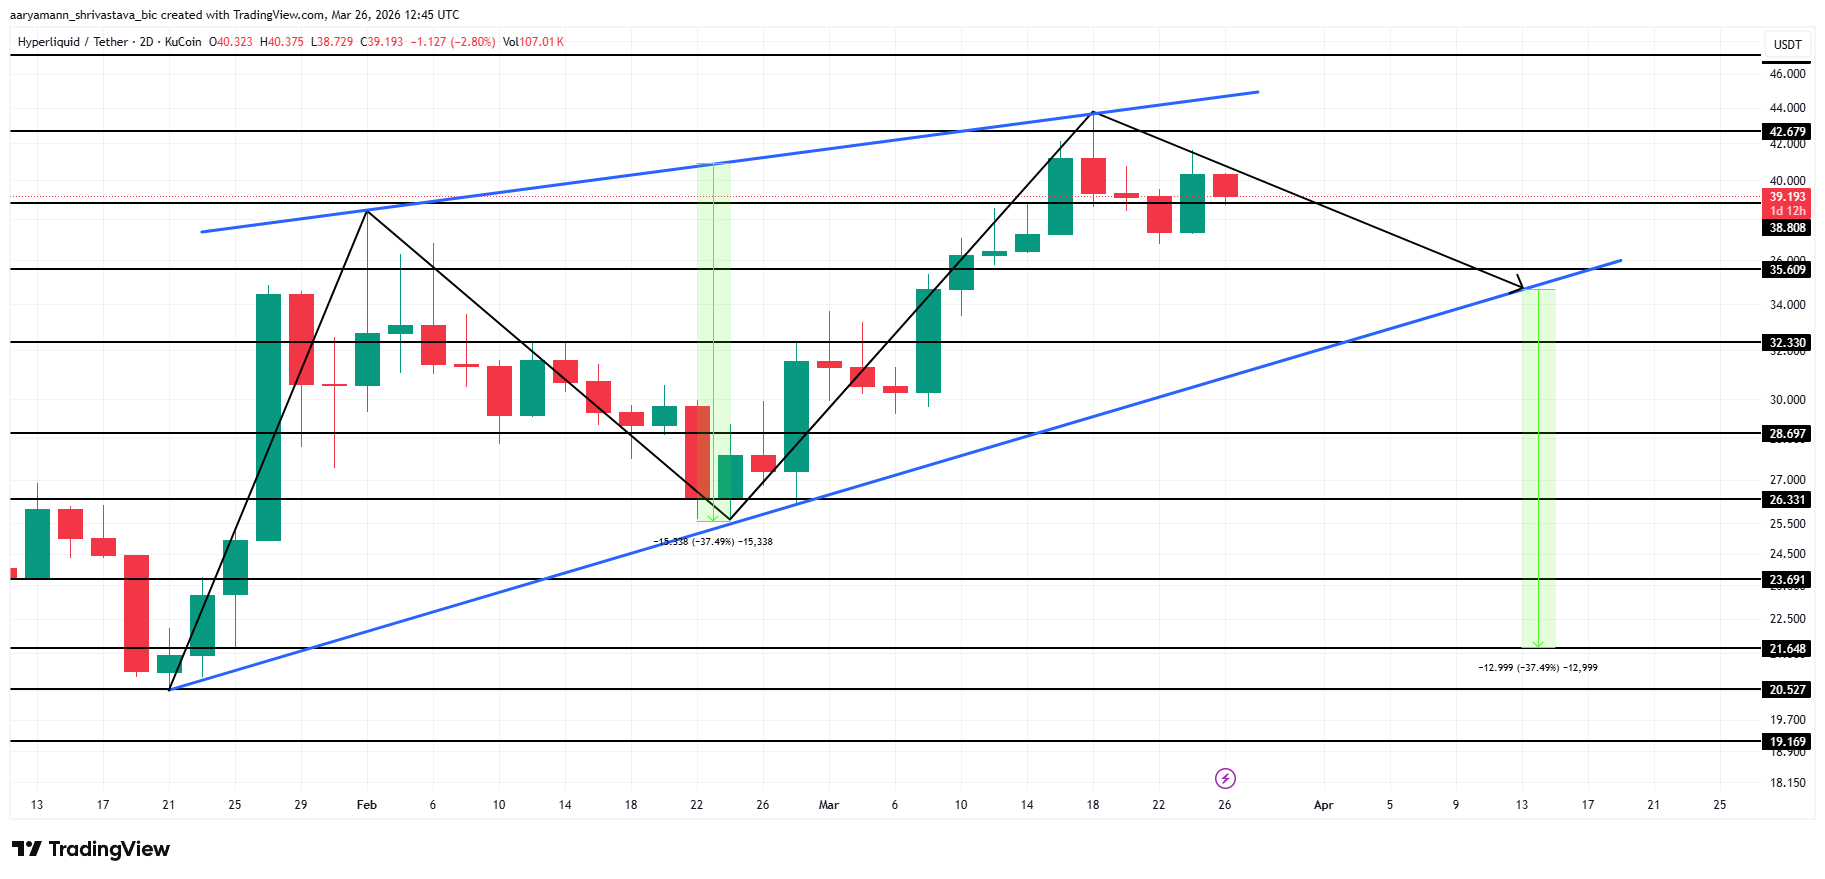
HYPE Price Prediction: Double Top Projects a Drop to $21
HYPE price is forming a clear double top pattern. The first peak formed near $38 in early February. HYPE then formed a second peak near $43 in mid-March before falling again. The annotated measured move on the chart applies the same 37.49% decline from the current breakdown zone, projecting a target of $21.
HYPE currently trades at $39. A 2-day close below $35 would confirm the double top breakdown and activate the $21 target. Below $35, the visible support levels on the chart are $32, then $28, then $26, then $23, with $21 as the measured move destination.
The bullish invalidation requires a daily close above $42. That level is both the double top neckline resistance and the apex of the short liquidation cluster. A confirmed close above $42 would break the pattern, squeeze $13.24 million in shorts, and open the path toward $44 and beyond.
The post HYPE Price is Looking At a 37% Decline As Capital Flows Tip To Negative appeared first on BeInCrypto.