The correlation between Bitcoin and gold in March is showing rare signals suggesting Bitcoin may have already formed a bottom.
As the market enters the final week of March, gold has recorded its fourth consecutive weekly decline. Meanwhile, Bitcoin continues to consolidate around $70,000. This divergence is drawing increasing attention from analysts.
BTC/Gold Ratio Signals a Potential Bottom in March
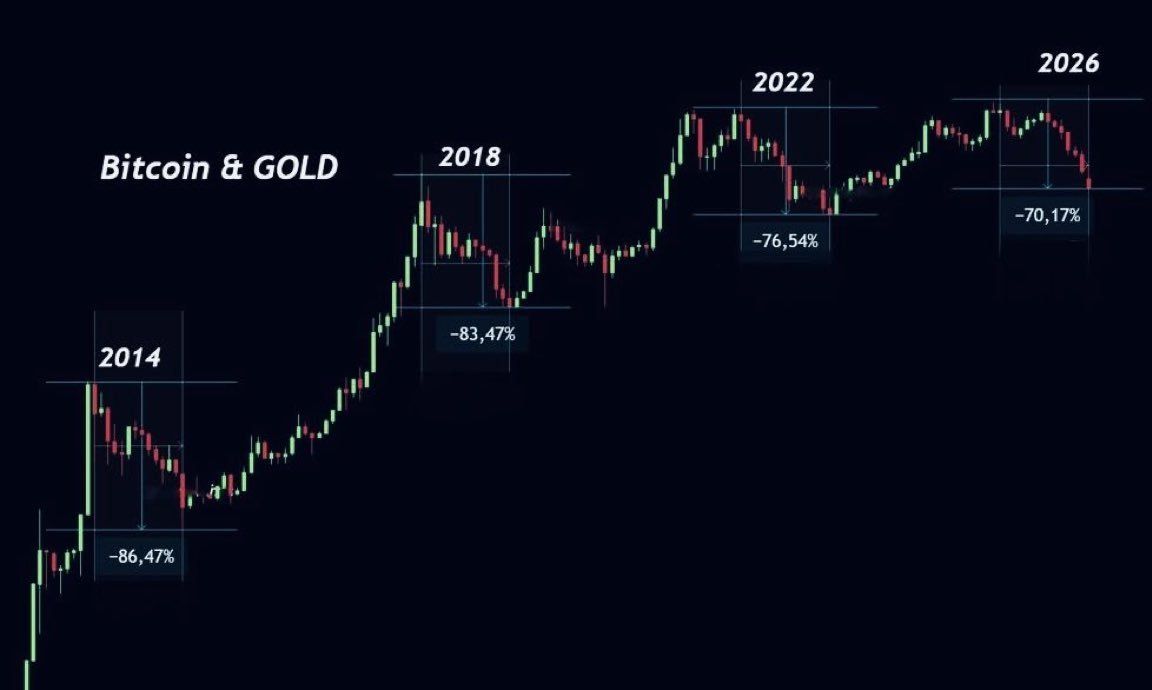
Analyst Michaël van de Poppe studied the BTC/Gold ratio chart. He stated that the current 70% drawdown closely matches historical bottoms following bear cycles lasting 13–14 months.
Previous deep drawdowns in this ratio—86% in 2014, 83% in 2018, and 76% in 2022—all marked cycle bottoms. When the ratio recovers, it indicates that Bitcoin is outperforming gold.
He believes the chart may no longer be declining. Instead, it appears to be entering a consolidation phase, opening the door for a potential recovery in Bitcoin.
“This time won’t be different,” Michaël van de Poppe predicted.
In the short term, a bullish divergence on the BTC/Gold chart further strengthens the expectation that Bitcoin will outperform gold in the near term.
Bitcoin–Gold Correlation Hits a 3-Year Low.
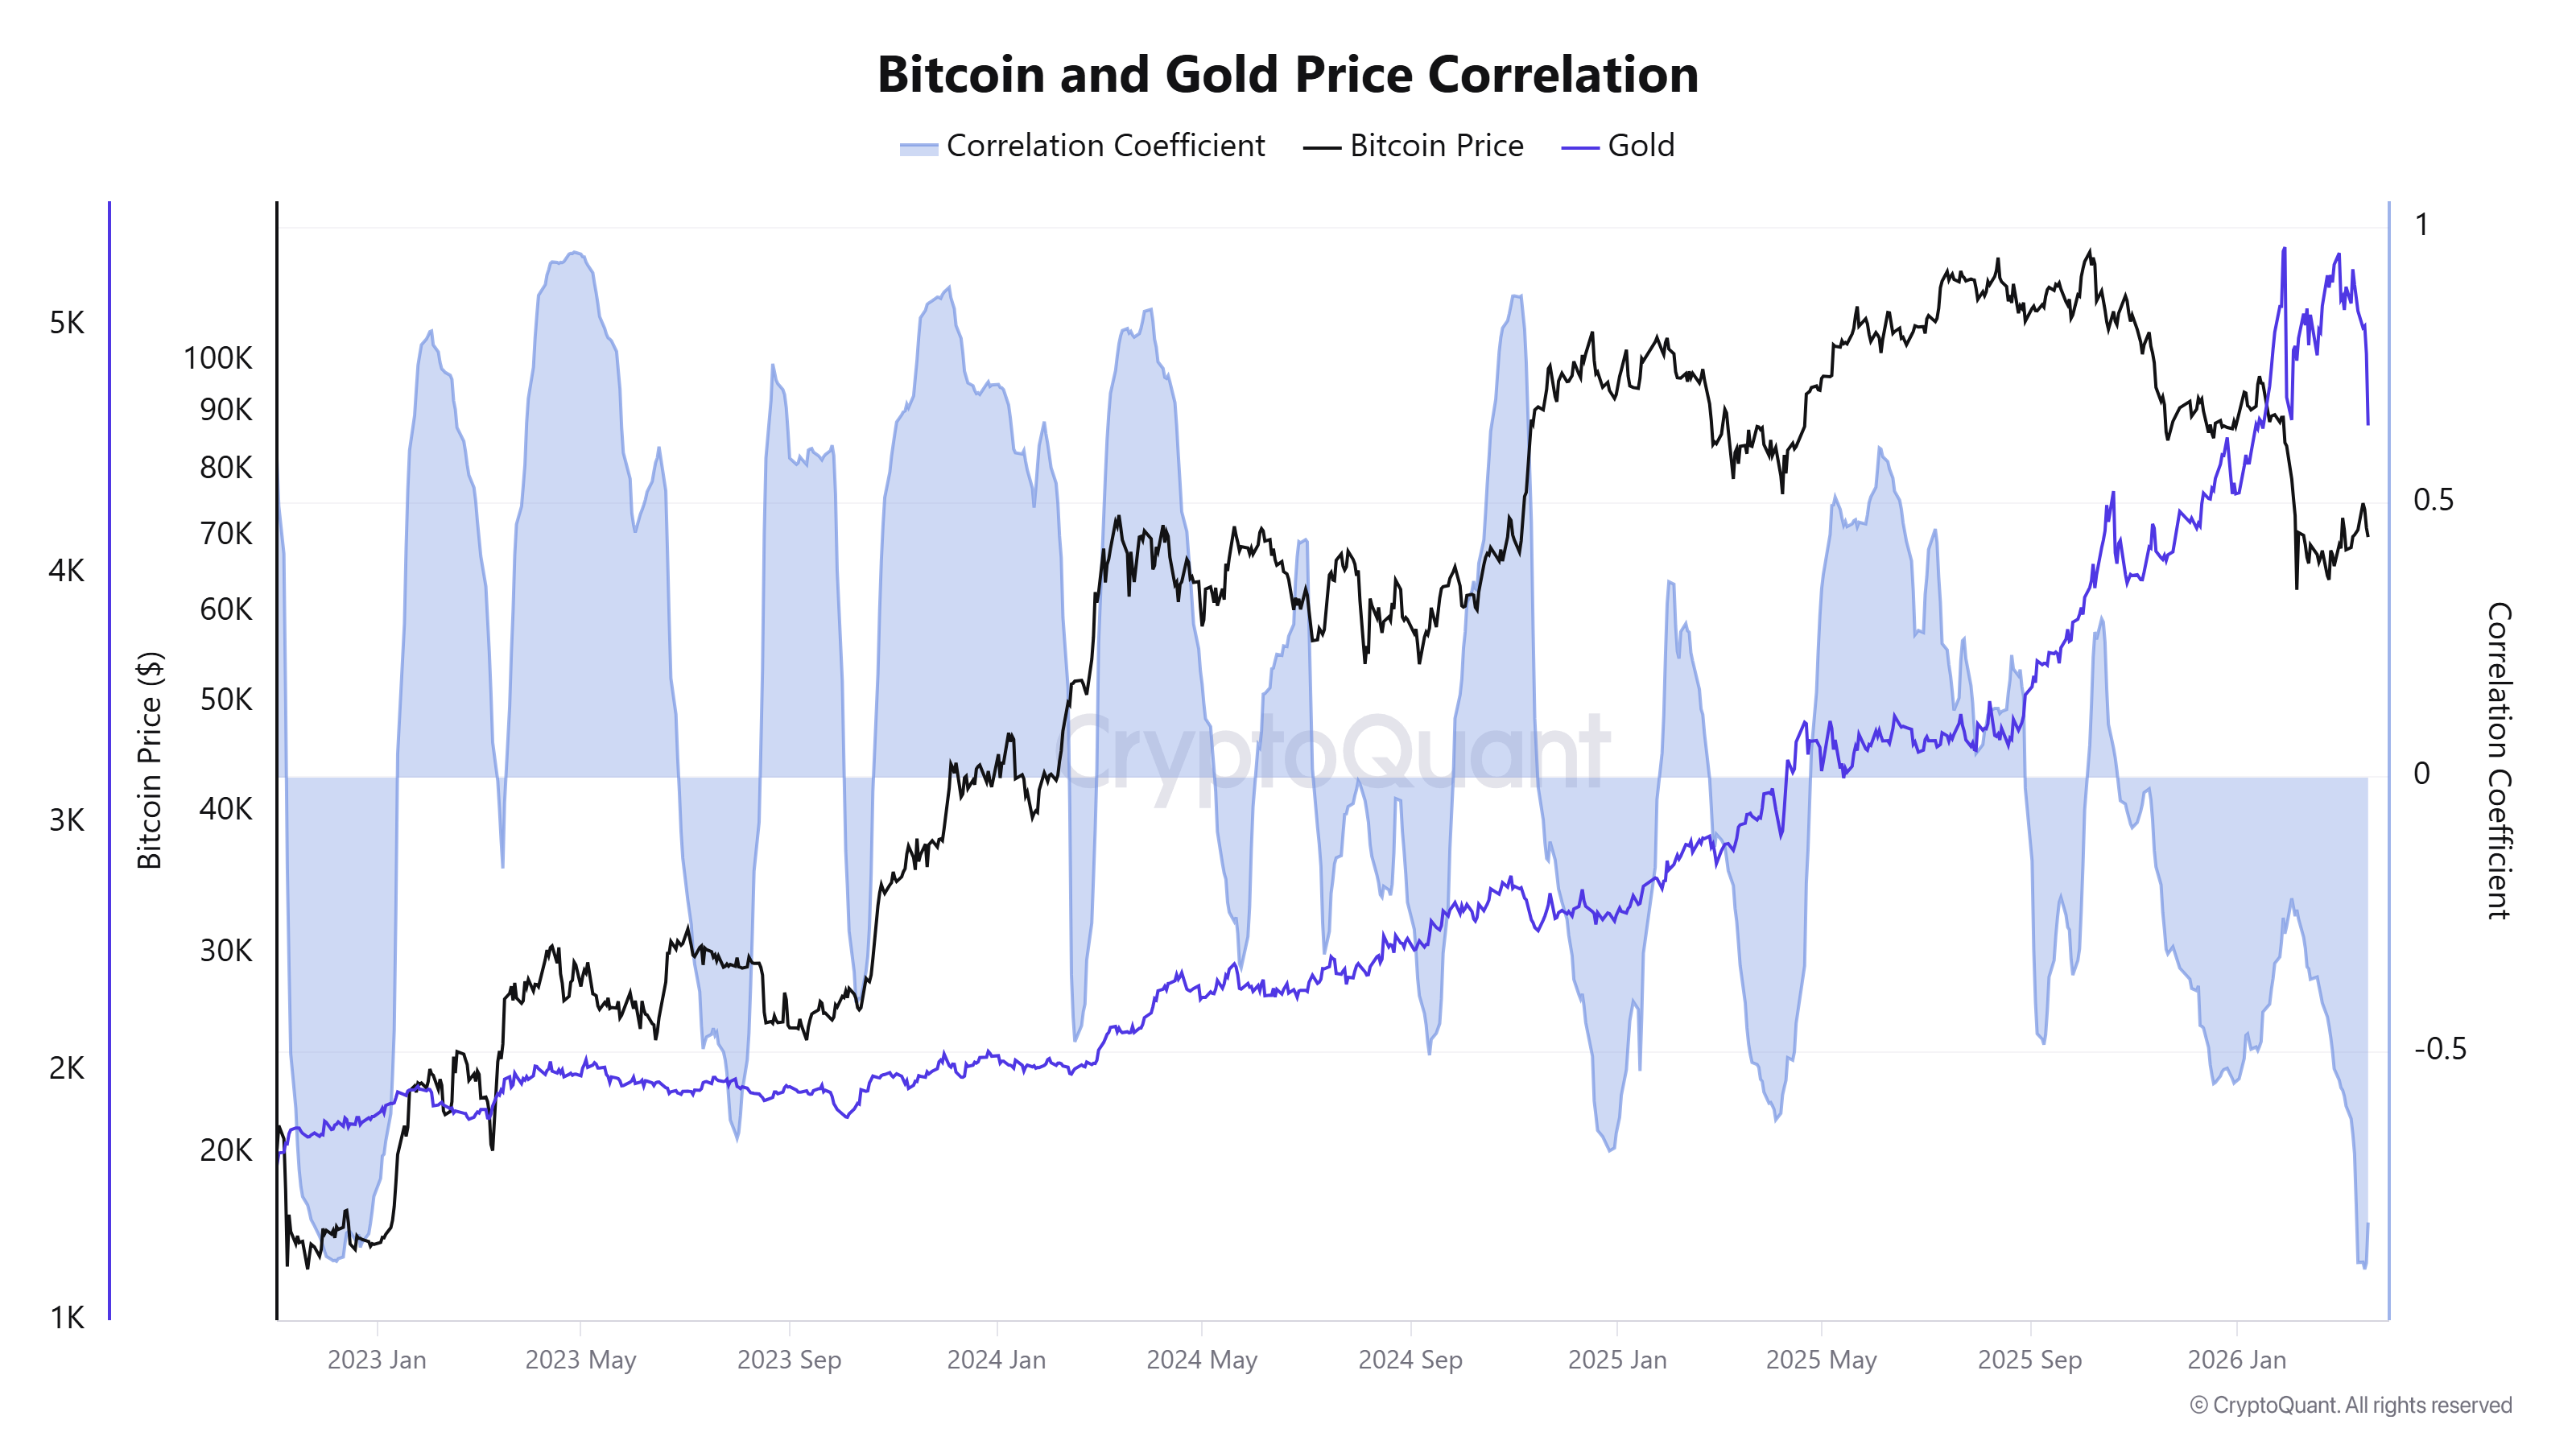
Data from CryptoQuant helps clarify the pattern observed by Michaël van de Poppe.
In March, the Bitcoin–gold correlation index dropped to -0.9, the lowest level since late 2022. At that time, Bitcoin hit a bottom at $15,600 and began a bullish trend that lasted more than two years.
Meanwhile, veteran trader Peter Brandt stated that gold is forming a clear bearish pattern known as the “Nine Red Birds” pattern. This pattern consists of nine consecutive daily closing declines.
He noted that this pattern has appeared only four times in his career. It often leads to markets taking years to recover.
The combination of Peter Brandt’s outlook and Bitcoin’s inverse correlation with gold suggests that Bitcoin may have already bottomed in March.
What Drives the Divergence Between Gold and Bitcoin?
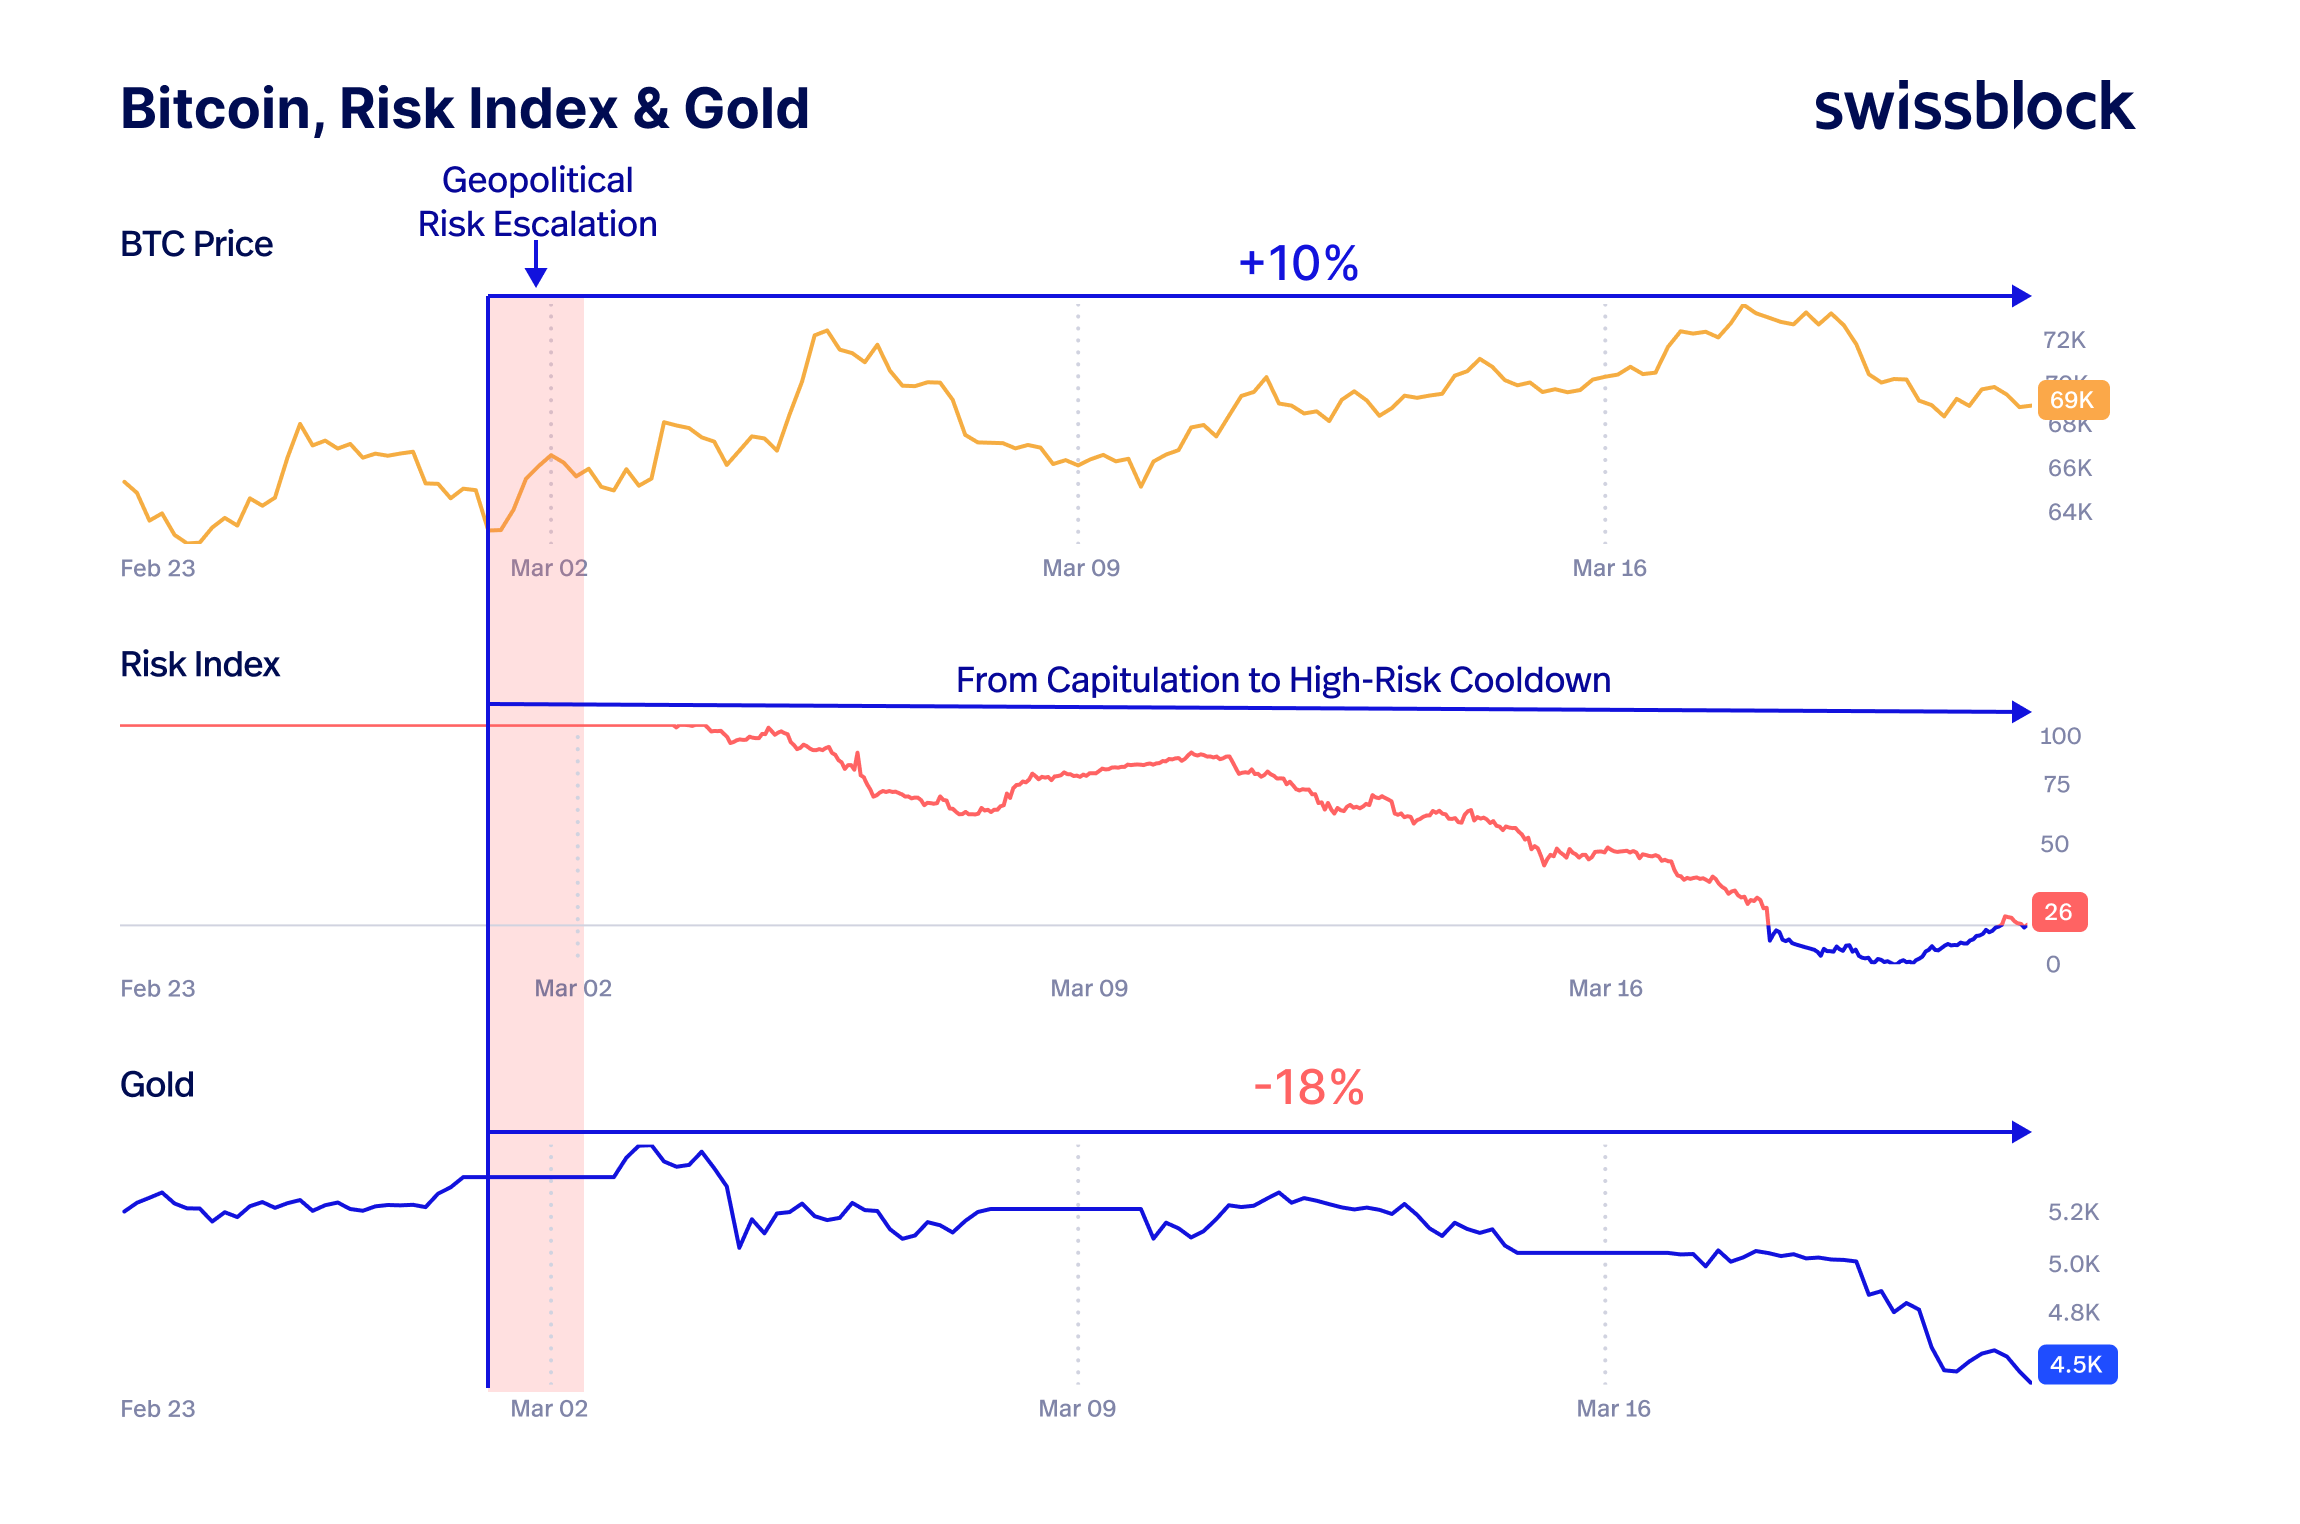
Swissblock, an institutional-grade analytics and market data firm, explained that Bitcoin priced in geopolitical risks early when the Iran conflict escalated at the beginning of the month.
“Bitcoin priced the geopolitical risk first. Bitcoin sold first, but recovered the fastest. The message is clear: Bitcoin has adapted to the shock better than expected, not repriced it as a systemic crisis,” Swissblock stated.
A recent report from BeInCrypto showed that whale addresses holding more than 1,000 BTC have climbed to a one-year high despite fears of war and recession.
In addition, Bitcoin entered the week alongside key macroeconomic data releases, including PMI and jobless claims. These indicators may help shape market trends in the coming months.
The post BTC/Gold Correlation Hits a 3-Year Low — And It Signals a Bitcoin Bottom appeared first on BeInCrypto.