Bitcoin’s market reaction to the ongoing Iran war is beginning to resemble the price behavior seen during the first month after Russia invaded Ukraine in 2022.
A comparison of the two periods shows a strikingly similar sequence: an initial panic sell-off, a rapid rebound, and then a volatile consolidation phase as markets adjust to geopolitical risk.
Initial Shock Followed by Rapid Recovery
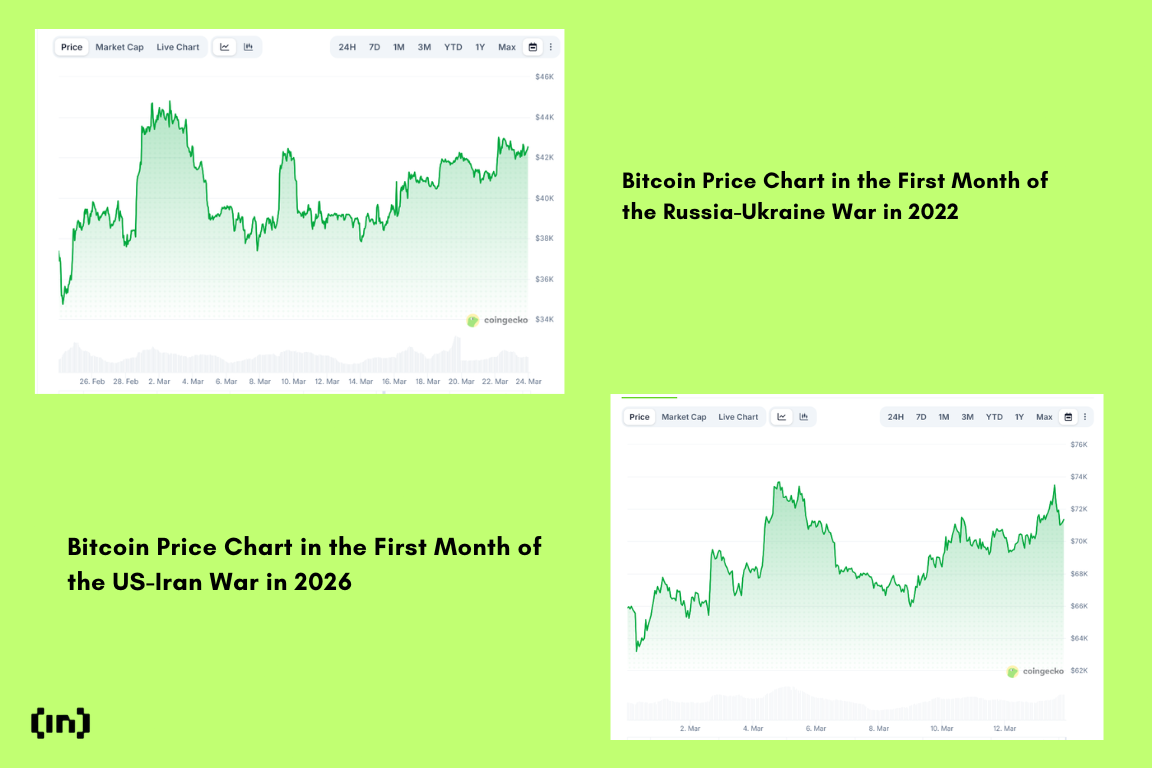
When Russia invaded Ukraine on February 24, 2022, Bitcoin initially plunged as global markets reacted to the sudden escalation.
Within days, however, the asset rebounded sharply as traders reassessed the immediate economic impact.
A comparable pattern is now visible following the US and Israeli strikes on Iran that began around February 28, 2026.
Bitcoin dipped on the initial headlines but quickly recovered, pushing back toward the $70,000–$73,000 range in the weeks that followed.
In both cases, the market appears to have rapidly priced in the geopolitical shock before stabilizing.

RSI Shows Similar Momentum Swings
Momentum indicators tell a similar story.
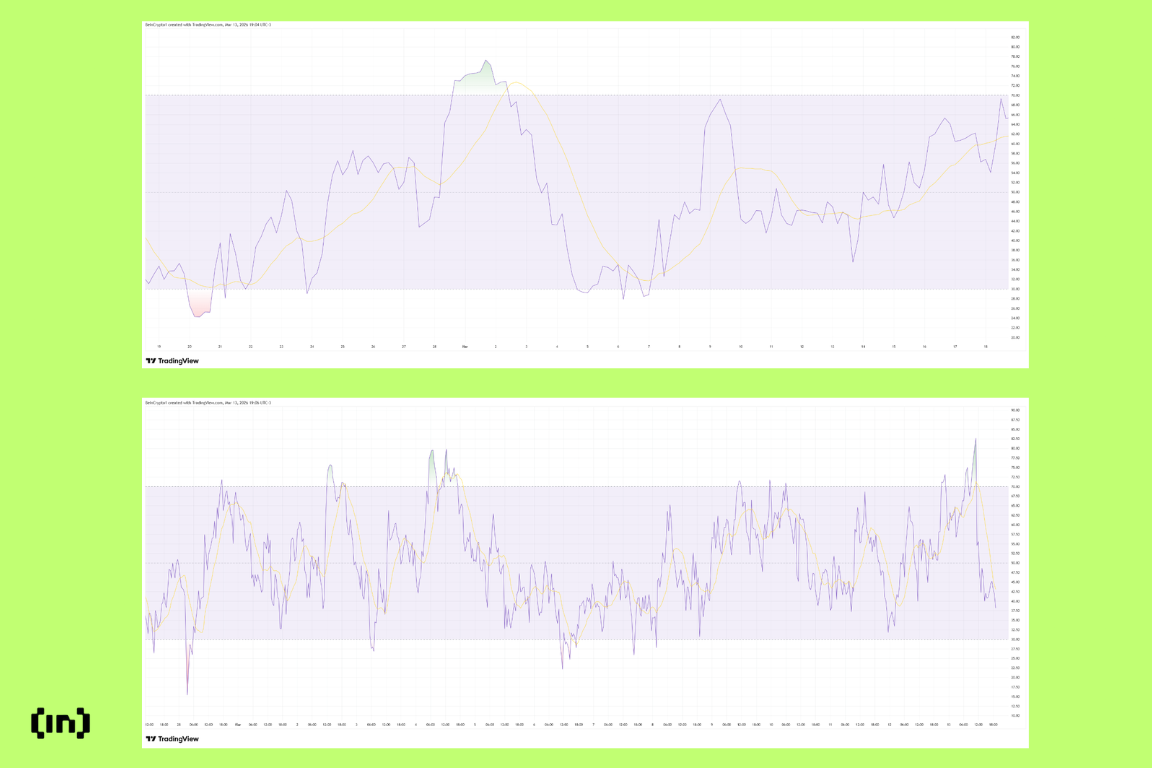
During the first month of the Ukraine war, Bitcoin’s Relative Strength Index (RSI) dropped sharply into oversold territory before rebounding and entering a strong momentum phase.
The current RSI pattern during the Iran conflict mirrors this behavior. The indicator initially fell as markets reacted to the war, then rebounded into stronger momentum territory before cooling again.
This type of movement typically suggests panic selling followed by aggressive dip buying, a pattern often seen during geopolitical shocks.
Money Flow Signals Continued Capital Rotation
Capital flow indicators reinforce the comparison.
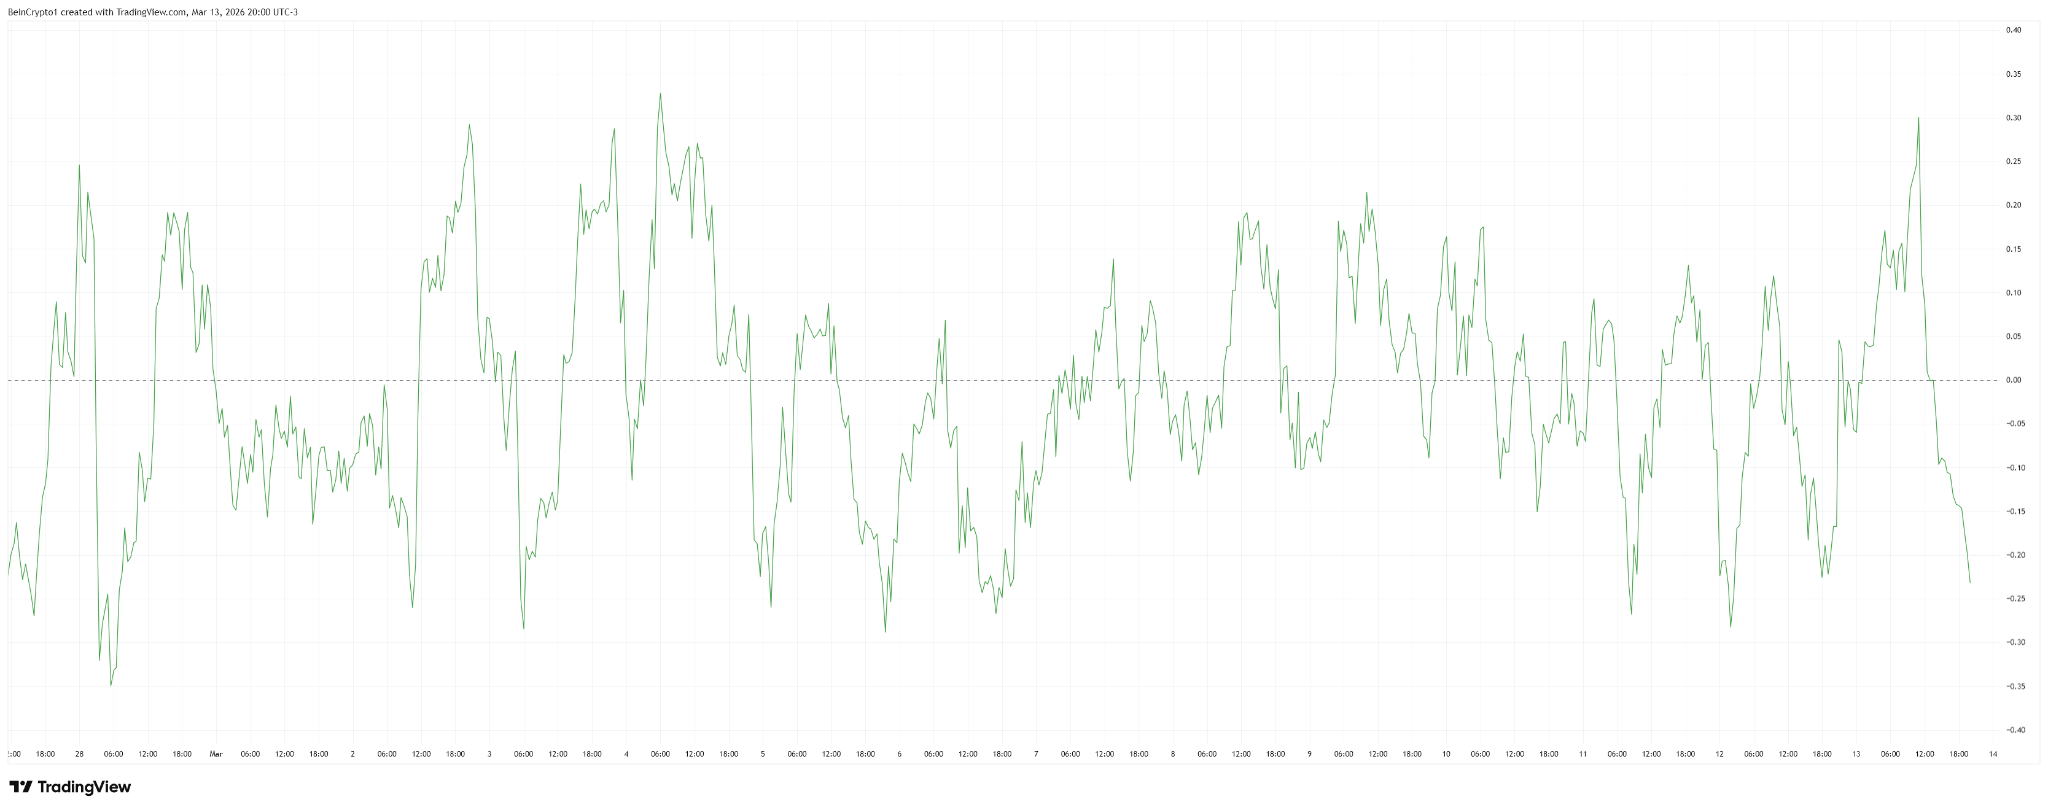
During the early stages of the Ukraine war, Chaikin Money Flow (CMF) gradually recovered after the initial sell-off, signaling renewed buying pressure entering the market.
The current CMF during the Iran conflict shows a similar tendency, with repeated moves back toward positive territory. This suggests that capital continues rotating into Bitcoin during price dips.
However, the 2026 chart appears more volatile, indicating short-term trading flows rather than steady accumulation.
Markets Appear to Be Adapting to War Risk
Taken together, the data suggest Bitcoin’s market reaction to the Iran war is following a familiar pattern.
Instead of triggering a sustained collapse, the geopolitical shock has so far produced a cycle of panic selling, rapid recovery, and range-bound volatility.
If the pattern continues to mirror the early Ukraine war phase, Bitcoin is more likely to trade sideways with an upward bias rather than collapse.
A similar trajectory would suggest Bitcoin could remain volatile in the short term but gradually push higher as traders buy dips and the war risk becomes priced in.
The post Bitcoin Price Action During Iran War Echoes Early Ukraine Pattern appeared first on BeInCrypto.